Comparative Analysis of Advanced Thresholding
Methods for Speech-Signal Denoising
Puneet Arora
Assistant Professor ECE deptt. B.M.I.E.T Sonepat M.D.U Rohtak, India
Mohit Bansal
Assistant Professor ECE deptt. B.M.I.E.T Sonepat M.D.U Rohtak, India
ABSTRACT
In traditional denoising techniques, filters and Short time Fourier transform are not so good for speech signal denoising. Wavelet thresholding de-noising techniques provide a new way to reduce background noise in speech signal. However, the soft thresholding is best in reducing noise but worst in preserving edges, and hard thresholding is best in preserving edges but worst in de-noising. In this paper, the wavelet coefficients are reduced to zero smoothly according to the function when their absolute values are less than threshold value. Adding a factor to the function can change the form of threshold function and adjust the estimated deviation of wavelet coefficients. Number of Wavelet thresohlding techniques has been applied on speech signal and its performance is evaluated. An wavelet threshold method is improved for signal denoising which gives better results in terms of SNR, MSE, Spectrogram & PRD particularly when a signal is corrupted with flicker noise. The simulation results show that the improved Wavelet thresohlding method has superior features as compared to conventional methods.
General Terms
Wavelet thresohlding, Speech Signal, Continuous wavelet Transform (CWT).
Keywords
Short term Fourier Transform (STFT), Spectrogram, Signal to Noise Ratio (SNR), Percentage Root mean square difference (PRD).
1.
INTRODUCTION
Over the past few decades there is tremendous increase in the level of ambient environmental noise. This has been due to growth of technology. Noise is added by various factors like noisy engines, heavy machines, pumps, vehicles, over noisy telephone channel or using radio communication device in an aircraft cockpit. For e.g. in hands free speech communication environments situation occurs that speech is superposed by background noise. The wavelet transform has become a powerful tool of signal analysis and is widely used in many applications which include signal detection and denoising. The wavelet denoising technique is called thresholding and it is a non linear algorithm [1]. The main focus of this paper is to improve wavelet threshold method which is improved for speech signal denoising. Also, Comparative analysis of two thresholding techniques for speech signal with wavelet, which gives better results in terms of SNR, PRD, MSE, and describing a time series data set by using a Spectrogram.
2.
INRODUCTION
TO
SIGNAL
DENOISING
Denoising of any speech signal can be classified in to two parts:
Traditional filtering method
Wavelet denoising method
2.1 Traditional filtering methods
What is a Transform and Why Do we Need One. Transform is a mathematical transformations applied to signals to obtain further information from that signal that is not readily available in the raw signal [2]. Wavelet transform helps in analyzing the signal both in frequency and time domain. Lengthy to simplified calculations.
2.1.1 Fourier transform
When we plot the signal one of the axes is time (independent variable), and the other (dependent variable) is usually the amplitude. When we plot time domain signals, we obtain a
time-amplitude representation of the signal. This
representation is not always the best representation of the signal for most signal processing related applications. In many cases, the most distinguished information is hidden in the frequency content of the signal. The frequency spectrum of a signal is basically the frequency components (spectral components) of that signal. The frequency spectrum of a signal shows what frequencies exist in the signal [2]. FT provides a signal which is localized only in the frequency domain It does not give any information of the signal in the time domain. Fourier transform is not suitable if the signal has time varying frequency, i.e. the signal is non-stationary.
2.1.2 Short time Fourier transforms or Gabor transform
The STFT looks at a signal through a small window, using the idea that a sufficiently small section of the wave will be approximately a stationary wave and so Fourier analysis can be used. The window is moved over the entire wave, providing some information about what frequencies appear at what time. Problem in STFT When using the STFT, there has to be a sacrifice of either time or frequency information. Having a big window gives good frequency resolution but poor time resolution; small windows provide better time
information, but poorer frequency information.
A compromise between time-based and frequency-based views of a signal. Both time and frequency are represented in limited precision. The precision is determined by the size of the window. Once you choose a particular size for the time window then it will be the same for all frequencies.
[image:2.595.311.542.72.425.2]3. WAVELET DENOISING METHOD
A wavelet is a waveform of limited duration that has an average value of zero. Unlike sinusoids that theoretically extend from minus to plus infinity, wavelets have a beginning and an end. Figure 1 shows a representation of a continuous sinusoid and a so-called “continuous” wavelet Daubechies 10 wavelet is depicted here) [3].Fig 1: Representation of a continuous sinusoid so-called “continuous” wavelet [3]
3.1 Types of wavelet transform
3.1.1 Continuous wavelet transform
The CWT is used to construct a time-frequency representation of a signal that offers very good time and frequency resolution. Tool for mapping the changing properties of non-stationary signals. The continuous wavelet transform is a convolution of the input data sequence with a set of functions generated by the mother wavelet. Computation is done for all values of s, s=1 or smaller and larger than “1”. Analysis starts from high frequencies and proceed towards low frequencies [2].
3.1.2 Discrete wavelet transform
Wavelets are discretely sampled and then signal is decomposed using a high-pass filter and a low pass filter. After that we get detail coefficients-from the high-pass filter and Approximation coefficients-from the low-pass filter. Only approximation coefficients are decomposed.
Table 1. Comparison between three transforms
Fourier transform Short time fourier transform
Wavelet transform Translates the
function from time domain to frequency domain.
Compromise between time based and frequency based view of signals.
Gives information in time domain and frequency domain. No concept of
windowing or scaling.
Both time and frequency are represented in limited precision determined by size of window.
Analyze according to scale-signal is looked at through a window.
Calculations involve complex numbers.
Analyze stationary signal.
Analyze non stationary signal.
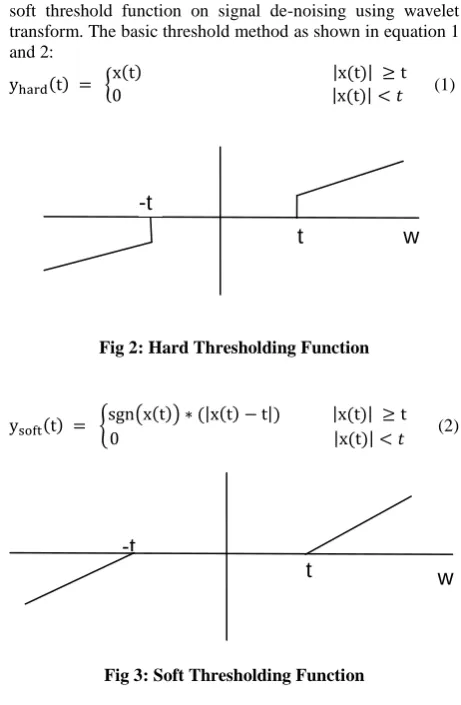
4. WAVELET THRESHOLDING
David L. Donoho and Iain M. Johnstone [4] was the first person who used threshold method on signal de-noising. In 1994, he performed a thresholding method, that is, hard and
soft threshold function on signal de-noising using wavelet transform. The basic threshold method as shown in equation 1 and 2:
[image:2.595.58.271.211.268.2]
(1)
Fig 2: Hard Thresholding Function
(2)
Fig 3: Soft Thresholding Function
The Donoho ’ s wavelet denoising algorithm (i.e., the SURE shrinkage) is summarized as follows [4]:
Transform f (k) to the wavelet domain and obtain wavelet coefficients with scales j =1 ~ J , and time
indices k =1~ N ;
Apply hybrid and pqs thresholding to using
threshold and obtain processed
wavelet coefficients .
Perform the inverse wavelet transform on to obtain
the denoised signal .
4.1 Value of Thresholding
The key steps of signal denoising based on wavelet transform are the threshold and shrinkage function selection. If the thresholding is too low, noise will be remained and if the thresholding is too high, useful signal will be lost. The universal threshold, which is proposed by D. L.Donoho[4], is the most popular in all kinds of threshold. It can be expressed as follows:
(3)
(4)
Where N is the sampling length of noisy signal, is the standard deviation of zero-mean additive white Gaussian noise(WGN) estimated by Donoho and Johnston. c is the detail coefficients of wavelet transform
-t
t
w
-t
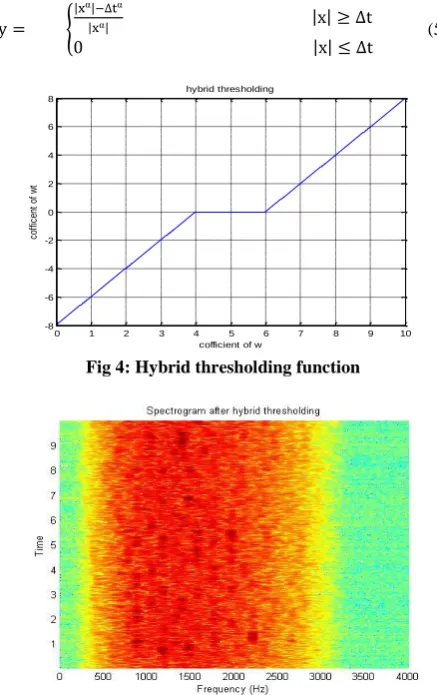
[image:2.595.56.279.535.727.2] [image:2.595.55.279.539.726.2]4.2 Hybrid thresholding
A. M G Sumithra B. Dr. K Thanuskodi [6] developed the soft thresholding which was the best method in reducing noise but worst in preserving edges, and hard thresholding was the best in preserving edges but worst in de-noising. The hybrid thresholding method was proposed in this paper for noisy speech co-efficient to reduce the noise and preserving the edges.
[image:3.595.326.530.83.403.2]
(5)
Fig 4: Hybrid thresholding function
Fig 5: Spectrogram of Denoised signal using Hybrid Thresholding
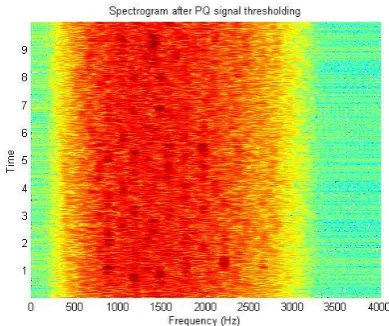
4.3 Thresholding for power quality signal
Gu Jie [7] proposed the key factor of wavelet thresholding de-noising method. These methods combine the advantages of hard and soft threshold techniques and also achieved better access to estimate the threshold of wavelet coefficients by adjusting the parameters and the improved threshold method was implemented to the soft and hard threshold functions. It could not only overcome the shortcomings of poor de-noising effect while using the hard threshold method but effectively solved the difficult problem that leads to signal distortion within the soft threshold method. After integrated the different characteristics of soft and hard threshold function, a new threshold method was used to estimate the wavelet coefficients. The expression is as follows:
(6)
Where ‘a’ and ‘m’ both are regulatory factors was used to dynamically adjust the value of threshold.
Fig 6: Thresholding function for power quality signal
Fig 7: Spectrogram of Denoised power quality signal
5.
IMPROVED
AND
PROPOSED
METHODOLOGY
The traditional methods has been improved by adding a factor to the function that can change the form of threshold function and adjust the estimated deviation of wavelet coefficients to the zero parts. For each level from 1 to j (as described in section 4), select a threshold and apply different thresholding functions and get the estimated wavelet coefficients through thresholding methods and make as small as possible to make it noise free. Thresholding methods i.e. Hybrid threshold function and thresholding for power quality signal has been improved in the form of Advanced hybrid threshold function and Advanced thresholding for power quality signal. Finally comparison has been done between traditional and proposed method. Analysing the results by both Qualitative and Quantities parameters.
Qualitative parameters Mean opinion score like listening the speech-signal and also plot Spectrogram after apply different thresholding functions.
Quantities parameters i.e. three parameters SNR (signal to noise ration), PRD (percentage root mean square difference), MSE (mean square error) and are calculated for all the outputs with their noisy and denoised counterparts, respectively. Hence, we get a good amount of comparison between the noisy and denoised signal.
0 1 2 3 4 5 6 7 8 9 10
-8 -6 -4 -2 0 2 4 6 8
hybrid thresholding
cofficient of w
co
ff
ic
en
t
of
w
t
0 1 2 3 4 5 6 7 8 9 10
-10 -8 -6 -4 -2 0 2 4 6 8 10
pqs thresholding
cofficient of w
co
ff
ic
en
t
of
w
[image:3.595.55.274.158.506.2]5.1 Advanced Hybrid threshold function
[image:4.595.55.275.69.433.2]
(7)
Fig 8: Advanced hybrid thresholding function
Fig 9: Spectrogram of Denoised signal using advanced hybrid Thresholding
5.2 Advanced PQ signal threshold function
(8)
Where ‘a’ and ‘m’ both are regulatory factors
[image:4.595.331.526.74.237.2]Fig 10: Advanced thresholding function for power quality signal
Fig 11: Spectrogram of Denoised power quality signal
6. KEY PARAMETERS OF SPEECH
DENOISING ALGORITHM BASED ON
WAVELET PACKET TRANSFORM
Ligang Du [9] presented key parameters in the wavelet packet denoising such as wavelet packet basis, decomposition layers, values of the threshold and threshold functions.The two methods evaluated the effects of denoised speech including signal-noise-ratio (SNR) and mean square error (MSE) parameters [7]. Soosan Beheshti [10] also proposed the MSE bounds which can also be used to evaluate the performance of denoising method. It can be confirmed from the results that not only the method provide an accurate estimate of the MSE for any given thresohlding method but also search and find an optimum threshold for any noisy data with regard to MSE.
(9)
(10)
Where x (j) is the amplitude of the original signals in the sample point j, is the amplitude of the de-noised signal in the sample point j, N is the length of the signal.
7. ANALYSIS AND RESULTS
The results have been demonstrated in the form of comparison and modification for thresohlding methods using different parameters i.e. SNR, PRD, MSE, and spectrogram. These modified methods are Advanced Hybrid and Advanced PQ Thresholding. Two wavelets i.e. Symlet and Daubechies are used for denoising of non-stationary speech signal. Table 2 is showing the values of different parameter for both wavelets and different thresohlding methods (conventional and improved). The analysis of values from Table 2 confirms that Advanced Hybrid Thresholding is more superior then Advanced PQ Thresholding and also Daubechies wavelet is better than Symlet wavelet for denoising of non-stationary speech signal. The work can be further enhanced to denoise the other type of non stationary signals like ECG signal and
-10 -8 -6 -4 -2 0 2 4 6 8 10
-1.5 -1 -0.5 0 0.5 1 1.5
advanced hybrid thresholding
cofficient of w
co
ff
ic
en
t
of
w
t
-10 -8 -6 -4 -2 0 2 4 6 8 10
-10 -8 -6 -4 -2 0 2 4 6 8 10
advanced pqs thresholding
cofficient of w
co
ff
ic
en
t
of
w
image. Application of curvelet technique instead of wavelet could be more efficient to denoise the speech signal.
Table 2. Comparison of SNR, MSE and PRD for advanced thresholding methods using Symlet and Daubechies
wavelet
Type of Thresholdi
ng
Symlet Daubechies
SNR (db)
MSE (db)
PRD (%)
SNR (db)
MSE (db)
PRD (%)
Hybrid 36.33 0.0167 1.524 35.362 0.0182 1.705
Advanced hybrid
63.32 0.0167 0.068 63.600 0.0182 0.066
PQ thresholding
34.43 0.0169 1.897 34.452 0.0185 1.894
Advanced PQ thresholding
37.21 0.0169 1.377 37.664 0.0185 1.308
8. REFERENCES
[1] Mahesh S.Chavan, Mrs Manjusha N.Chavan ,“Studies on Implementation of Wavelet for Denoising Speech Signal”, International Journal of Computer Applications ,Vol 3 – No.2, June 2010.
[2] Robi Polikar, “The Wavelet tutorial”
http://users.rowan.edu/polikar / WAVELETS/ WT
tut.html.
[3] Conceptual Wavelets in Digital Signal Processing by D. Lee Fugal. Space & Signals technical publishing 2009 ISBN… 007.
[4] David L. Donoho and Iain M. Johnston, “Threshold Selection for Wavelet Shrinkage of noisy Data”, 0-7803-2050-6D4 $4.00 01994 IEEE.
[5] Yating Lin, Jianli Cai, “A New Threshold Function for Signal Denoising Based on Wavelet Transform” 2010 International Conference on Measuring Technology and Mechatronics Automation.
[6] A. M G Sumithra B. Dr. K Thanuskodi, “Wavelet based speech signal de-noising using hybrid thresholding” INTERNATIONAL CONFERENCE ON “CONTROL, AUTOMATION, COMMUNICATION AND ENERGY CONSERVATION -2009, 4th-6th June 2009.
[7] Gu Jie, “Wavelet Threshold De-noising of Power Quality Signals” 2009 Fifth International Conference on Natural Computation.
[8] Yun Yin Yule Hu, Peizhi Liu, “The Research on Denoising Using Wavelet Transform” 978-1-61284-774-0/11/$26.00 ©2011 IEEE.
[9] Ligang Du, Ru Xu, Fang Xu, Deqing Wang, Huabin Chen “Research on Key Parameters of Speech Denoising Algorithm Based on Wavelet Packet Transform” 978-1-4244-5540-9/10/$26.00 ©2010 IEEE.