The importance of tourism for the
Brazilian economy: an input-output
analysis
Casimiro Filho, Francisco and Guilhoto, Joaquim José
Martins
Universidade Federal do Ceará, Universidade de São Paulo
2004
Online at
https://mpra.ub.uni-muenchen.de/54605/
Francisco Casimiro Filho1
Joaquim José Martins Guilhoto2
Paper Presented at the
43
rdAnnual Meetings of the
Southern Regional Science Association
New Orleans, Louisiana
March 11-13, 2004
ABSTRACT
This study is aimed to analyze the tourism contributions to the Brazilian economy by using a tourism input-output matrix constructed for the Brazilian economy by Casimiro Filho (2002) for the year of 1999. The analysis is conducted by using the traditional approach of the Hirschmann-Rasmussem backward and forward linkages as well as more recent theories, like the field of influence, and the pure linkage approach. The results allow the identification of key-sectors in the economy. Among the key-sectors classified as key ones, six are included into the tourism complex: a) schedule air transportation; b) nonscheduled air transportation; c) travel agencies; d) support activities for air transportation; e) accommodation; and f) foodservices and drinking places. In face of this, it is pointed out the importance of implementing policies and programs to promote the development of the tourism in the Brazilian economy.
1 Department of Agricultural Economics, Federal University of Ceará, Brazil. e-mail: casimiro@ufc.br
2 Department of Economics, University of São Paulo, Brazil; REAL, University of Illinois; and CNPq Scholar.
1. INTRODUCTION
One of the few economic sectors that have been showing continuous growth in the
world economy is tourism. Following the World Tourism Organization – WTO (2000), in the
last years it has presented an yearly average growth rate of 7%, while sectors like agriculture and industry have had growth, respectively, of 2.3% and 3% (World Bank, 2001). Based on this fact, some countries have given to this economic segment the task of balance and even get surplus in their external accounts. Other countries, mainly the developing ones, see the tourism as one of the alternatives capable of improving the way of life of their population, i.e., as an activity capable of promote development, generating income and employment, manly in the regions that show exotic landscapes and shortage of financial recourses (Lopes, 1990). One of the reasons for this is the low relative level of investment required for the implementation of a strategy of development based on the tourism sector, when compared with the other sectors in the economy.
As such, it is possible to say that the tourism is a solid option to minimize the regional disparities of a country (Cruz, 2000). However, despite recognizing that the tourism has a great importance over the economy of a given country, there are few studies in Brazil that quantify, with a solid methodology, the importance of this segment for the Brazilian economy.
As such it is necessary to identify and to measure the contribution of the sectors that make the tourism cluster, relatively to the other sectors in the economy. Using an input-output model constructed for the Brazilian economy for the year of 1999, this study aim exactly at this goal.
2. THEORETICAL BACKGROUND
This section first starts with a presentation of the Rasmussen and Hirschman approach used in the identification of key sectors in the economy, based on its productive
structure. Them it is followed by a presentation of the pure linkage theory which considers, besides the productive structure, the value of production generated into each economic sector. Ending this section, a presentation of the field of influence approach is made, recognizing that
some coefficients are more “influential” than others, this approaches is used to identify the
sectors responsible for the greater changes in the economy.
2.1. The Rasmussen/Hirschman Approach
The work of Rasmussen (1956) and Hirschman (1958) led to the development of indices of linkage that have now become part of the generally accepted procedures for
identifying key sectors in the economy. Define
b
ij as a typical element of the Leontief inversematrix,
B
;B
* as the average value of all elements ofB
, and if Bj and Bi are the associatedtypical column and row sums, then the indices may be developed as follows: Backward linkage index (power of dispersion):
.
/ /
*
U
j
B
jn B
(1)Forward linkage index (sensitivity of dispersion):
.
/ /
*
U
i
B
in B
(2)One of the criticisms of the above indices is that they do not take into consideration the
different levels of production in each sector of the economy, what it is done by the pure linkage
approach presented in the next section.
2.2. The Pure Linkage Approach
Consider a two-region input-output system represented by the following block matrix, A,
of direct inputs:
A A A
A A
jj jr
rj rr
F
H
G
I
K
J
(3)where Ajj and Arr are the quadrate matrices of direct inputs within the first and second region
and Ajr and Arj are the rectangular matrices showing the direct inputs purchased by the second
region and vice versa.
From (3), one can generate the following expression:
B
I
A
B BB B I A A I jj jr rj rr jj rr j r jr r rj j
F
H
G
I
K
J F
H
G
I
K
JF
H
G
I
K
JF
H
G
I
K
J
(
)
1 00 0 0
(4)
where:
j
c
I
A
jjh
1 (5)
r
I
A
rr
a
f
1(6)
jj
c
I
jA
jr
rA
rjh
1 (7)
rr
I
rA
rj
jA
jr
c
h
1(8)
By utilizing this decomposition (equation 4), it is possible to reveal the process of production in an economy as well as derive a set of multipliers/linkages.
From the Leontief formulation:
X
a f
I
A
1Y
(9)and using the information contained in equations (4) through (8), one can derive a set of indexes that can be used: a) to rank the regions in terms of its importance in the economy; b) to see how the production process occurs in the economy.
X X I A A I Y Y j r jj rr j r jr r rj j j r
F
H
GIK
J F
H
G
JF
K
I
H
G
I
K
JF
H
G
I
K
JF
H
GIK
J
0 0 0 0 (13)
which leads to the definitions for the Pure Backward Linkage (PBL) and for the Pure Forward
Linkage (PFL), i.e.,
PBL A Y
PFL A Y
r rj j j
j jr r r
(14)
where the PBL will give the pure impact on the rest of the economy of the value of the total
production in region j,
d i
jYj : i.e., the impact that is free from a) the demand inputs that regionj makes from region j , and b) the feedbacks from the rest of the economy to region j and
vice-versa. The PFL will give the pure impact on region j of the total production in the rest of the
economy
b g
r rY .The pure linkages as defined above are defined in value terms. So, to make it possible to compare indices values in time and space, it is necessary to normalize the value of these indices as given by the equations below.
The pure backward linkage normalized (PBLN) is given by:
n PBL PBL PBLN n i
(15)The pure forward linkage normalized (PFLN) is given by:
n PFL PFL PFLN n i
(16)The pure total linkage normalized (PTLN) is given by:
2.3. The Fields of Influence
The concept of field of influence was introduced and elaborated by Sonis and Hewings (1989, 1995). It is mainly concerned with the problem of coefficient change, namely the influence of a change in one or more direct coefficients on the associated Leontief inverse
matrix.3 Since, given an economic system, some coefficients are more “influential” than others,
the sectors responsible for the greater changes in the economy can be determined. Together with the Rasmussen/Hirschman linkage indices and the pure linkage indices, it completes our analytical framework for the determination of key sectors in an economic system.
Considering a small enough variation, , in the input coefficient, aij, the presentation of
the basic solution of the coefficient change problem proposed by Sonis and Hewings may be
presented as follows. let A = (aij) be an nxn matrix of direct input coefficients; let E(eij) be a
matrix of incremental changes in the direct input coefficients; let B
b g
I A 1 bij ,B E
bgb
I A Eg
1 b e( ) be the Leontief inverses before and after changes. ijUsing the notion of inverse-important input coefficients that is based on the conception of
the field of influence associated with the change in only one input coefficient, assume that this
change occurs in location
b g
i j1, 1 , that is,e e i i j j
i i j j
ij
R
S
T
, or 1 1 1 1 0 (18)then, the field of influence can be constructed as the matrix F e
di
ij generated by multiplication ofthe jth column of the Leontief matrix, B, with the ith row:
F e b
b
b
b b b
ij
j
j
nj
i i in
di
b
g
F
H
G
G
G
G
I
K
J
J
J
J
1 2 1 2 , (19)
3We considered here only the simplest case, i.e., the case in which the change occurs in only one input parameter.
where F e
di
ij is a nxn matrix, interpreted as the field of influence of the change on theinput coefficient, aij. For every coefficient, aij, there will be an associated nxn field of influence
matrix.
In order to determine which coefficients have the greater field of influence, reference is
made to the rank-size ordering of the elements, Sij , from the largest to the smallest ones.
Therefore, for every matrix F e
di
ij , there will be an associated value given by:Sij fkl eij
l n
k n
di
. (20)It is possible to see that Sij b bj i and thus provides a direct relationship with the
intensity matrix defined in (19). Thus, from the values of Sij , a hierarchy can be developed of
3. THE TOURISM SECTOR IN BRAZIL
The input-output (i-o) tables released by the official Brazilian institute of statistics (IBGE) only takes into consideration 42 economic sectors, and the last year that official i-o information is available is for the year of 1996. As so, to conduct the research being presented here some previous estimation needed to be made. First, based on the national accounts (see Guilhoto and Sesso Filho, 2004), an input-output table was constructed for the Brazilian economy for the year of 1999. Second, taking this i-o table as the base data, and using information from various sources, a set of new sectors, linked with the tourism segment, were estimated and introduced into the i-o table constructed for 1999, which now takes into consideration 54 economic sectors (see Casimiro Filho, 2002).
The results, using the estimated Tourism Input-Output Table constructed for the year of 1999 for the Brazilian economy, and the methodology presented in section 2, above, are presented below.
3.1. Intersectoral relations and the tourism segment in the Brazilian economy
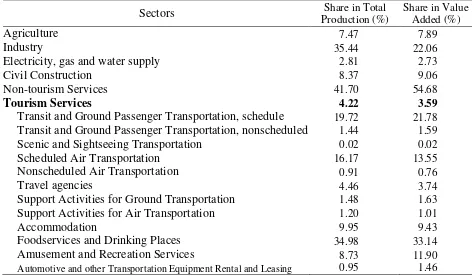
Table 1 gives an idea of the importance of the Tourism sector for the Brazilian economy, with a detailing of the sectors that make its aggregate. It is possible to see that, among the macro-sectors being considered, Non-Tourism services was the one with the greatest share in total production and value added, where inside this macro-sector the ones that have the biggest shares are Public Administration, Real Estate, and Trade. The second largest share was assigned to the industry macro-sector.
Table 1. Share of the Sectors in Production and Value Added, Brazil, 1999.
Sectors Share in Total
Production (%)
Share in Value Added (%)
Agriculture 7.47 7.89
Industry 35.44 22.06
Electricity, gas and water supply 2.81 2.73
Civil Construction 8.37 9.06
Non-tourism Services 41.70 54.68
Tourism Services 4.22 3.59
Transit and Ground Passenger Transportation, schedule 19.72 21.78
Transit and Ground Passenger Transportation, nonscheduled 1.44 1.59
Scenic and Sightseeing Transportation 0.02 0.02
Scheduled Air Transportation 16.17 13.55
Nonscheduled Air Transportation 0.91 0.76
Travel agencies 4.46 3.74
Support Activities for Ground Transportation 1.48 1.63
Support Activities for Air Transportation 1.20 1.01
Accommodation 9.95 9.43
Foodservices and Drinking Places 34.98 33.14
Amusement and Recreation Services 8.73 11.90
Automotive and other Transportation Equipment Rental and Leasing 0.95 1.46
Source: Casimiro Filho (2002).
3.1.1. The Hirschman-Rasmussen Linkages
As it was show before, from the Hirschman-Rasmussen linkages it is possible to identify and to analyze the level of sectoral integration in a given economy, i.e., how the sectors do relate with each other in terms of supply (forward linkages) and demand (backward linkages) of goods and services.
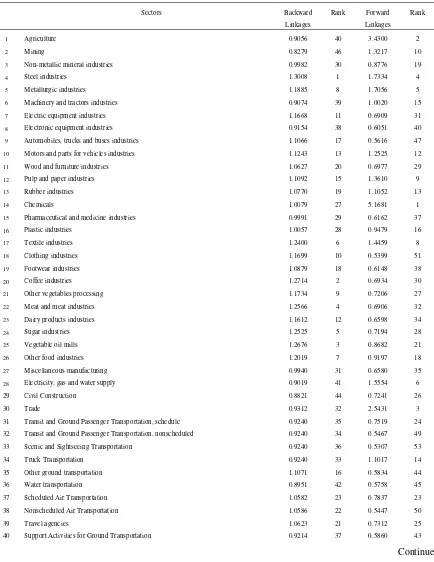
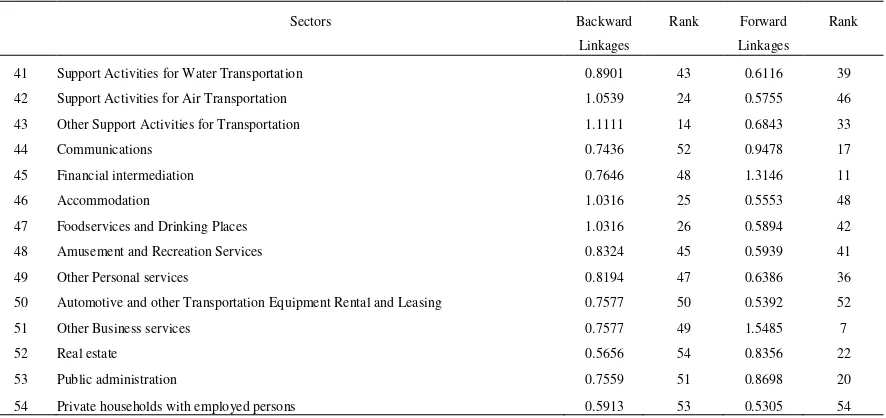
Table 2 shows the results for the Hirschman-Rasmussen linkages.
Table 2. Hirschman-Rasmussen Backward and Forward Linkages: Brazil, 1999.
Sectors Backward Rank Forward Rank Linkages Linkages
1 Agriculture 0.9056 40 3.4300 2
2 Mining 0.8279 46 1.3217 10
3 Non-metallic mineral industries 0.9982 30 0.8776 19
4 Steel industries 1.3008 1 1.7334 4
5 Metallurgic industries 1.1885 8 1.7056 5 6 Machinery and tractors industries 0.9074 39 1.0020 15 7 Electric equipment industries 1.1668 11 0.6909 31 8 Electronic equipment industries 0.9154 38 0.6051 40 9 Automobiles, trucks and buses industries 1.1066 17 0.5616 47 10 Motors and parts for vehicles industries 1.1243 13 1.2525 12 11 Wood and furniture industries 1.0627 20 0.6977 29 12 Pulp and paper industries 1.1092 15 1.3610 9
13 Rubber industries 1.0770 19 1.1052 13
14 Chemicals 1.0079 27 5.1681 1
15 Pharmaceutical and medicine industries 0.9991 29 0.6162 37 16 Plastic industries 1.0057 28 0.9479 16
17 Textile industries 1.2400 6 1.4459 8
18 Clothing industries 1.1699 10 0.5399 51 19 Footwear industries 1.0879 18 0.6148 38
20 Coffee industries 1.2714 2 0.6934 30
21 Other vegetables processing 1.1734 9 0.7206 27 22 Meat and meat industries 1.2566 4 0.6906 32 23 Dairy products industries 1.1612 12 0.6598 34
24 Sugar industries 1.2525 5 0.7194 28
25 Vegetable oil mills 1.2676 3 0.8682 21 26 Other food industries 1.2019 7 0.9197 18 27 Miscellaneous manufacturing 0.9940 31 0.6580 35 28 Electricity, gas and water supply 0.9019 41 1.5554 6 29 Civil Construction 0.8821 44 0.7241 26
30 Trade 0.9312 32 2.5431 3
31 Transit and Ground Passenger Transportation, schedule 0.9240 35 0.7519 24
32 Transit and Ground Passenger Transportation, nonscheduled 0.9240 34 0.5467 49
33 Scenic and Sightseeing Transportation 0.9240 36 0.5307 53
34 Truck Transportation 0.9240 33 1.1017 14
35 Other ground transportation 1.1071 16 0.5834 44
36 Water transportation 0.8951 42 0.5758 45
37 Scheduled Air Transportation 1.0582 23 0.7837 23
38 Nonscheduled Air Transportation 1.0586 22 0.5447 50
39 Travel agencies 1.0623 21 0.7312 25
40 Support Activities for Ground Transportation 0.9214 37 0.5860 43
Table 2 (Continued). Hirschman-Rasmussen Backward and Forward Linkages: Brazil, 1999.
Sectors Backward Rank Forward Rank Linkages Linkages
41 Support Activities for Water Transportation 0.8901 43 0.6116 39
42 Support Activities for Air Transportation 1.0539 24 0.5755 46
43 Other Support Activities for Transportation 1.1111 14 0.6843 33
44 Communications 0.7436 52 0.9478 17
45 Financial intermediation 0.7646 48 1.3146 11
46 Accommodation 1.0316 25 0.5553 48
47 Foodservices and Drinking Places 1.0316 26 0.5894 42
48 Amusement and Recreation Services 0.8324 45 0.5939 41
49 Other Personal services 0.8194 47 0.6386 36
50 Automotive and other Transportation Equipment Rental and Leasing 0.7577 50 0.5392 52
51 Other Business services 0.7577 49 1.5485 7
52 Real estate 0.5656 54 0.8356 22
53 Public administration 0.7559 51 0.8698 20
54 Private households with employed persons 0.5913 53 0.5305 54
Source: Casimiro Filho (2002).
Mainly with respect to the investment in the tourism macro sector, following Saab & Daemon (2001), in the last years there was the entrance of international chains of hotels in the country, this was accompanied by the construction of thematic parks by international companies as show in Embratur/FADE (1998).
Among the more integrated sectors, the ones that stand up with high values for the backward linkages are Steel Industries (4), Coffee industries (20), Vegetal Oil Mills (25), Meat and Meat Industries (22), and Sugar Industries (24).
As for the tourism complex, the higher values for the backward linkages are found in Schedule Air Transportation (37), Nonscheduled Air Transportation (38), Travel Agencies (39), Support Activities for Air Transportation (42), Accommodation (46), and Foodservices and Drinking Places (47).
[image:12.612.89.532.103.312.2]From the backward and forward linkages it is possible to classify the sectors as key ones in the economic system. McGilvray (1977) uses a more restricted definition for a key sector. Following this author, a sector to be considered a key one in the Hirschman-Rasmussen approach must have the backward and the forward linkages greater than one. However, there are authors who use a broader concept for a key-sector.
From Figure 1 and tanking into consideration the narrow definition, it is possible to classify the following sectors as key ones: Steel Industries (4), Metallurgic Industries (5), Motors and Parts for Vehicles Industries (10), Pulp and Paper Industries (12), Rubber Industries (13),
Chemicals (14), and Textiles Industries (17). All of which belong to the industry.
38 21 18 22 25 20 24 26 16 13 12 10 17 4 5 634 14 1 30 28 51 45 2 0.0000 1.0000 2.0000 3.0000 4.0000 5.0000 6.0000
[image:13.612.134.493.278.522.2]0.0000 0.2000 0.4000 0.6000 0.8000 1.0000 1.2000 1.4000 Bacward Linkages F o rw a rd L in ka g e s
Figure 1 – Key Sectors H/R Approach: Brazil, 1999.
3.1.2. The Fields of Influence
Complementing the analysis of the Hirschman-Rasmussen approach and using the fields of influence approach to identify the main links in the economy, it can be seen from Figure 2, which take into consideration the 200 highest values of the fields of influence, that the greatest changes in the economy would occur with changes in the coefficients of the following sectors: Agriculture (1); Steel Industries (4); Chemicals (14); and Textiles industries (17).
Key Sectors
0 2 4 6 8 10 12 14 16 18 20 22 24 26 28 30 32 34 36 38 40 42 44 46 48 50 52 54
0 2 4 6 8 10 12 14 16 18 20 22 24 26 28 30 32 34 36 38 40 42 44 46 48 50 52 54
Buying Sectors
S
e
lli
n
g
S
e
c
to
[image:14.612.116.489.92.376.2]rs
Figure 2 – Greatest Values of the Fields of Influence: Brazil, 1999.
3.1.3. The Pure Linkages
The Hirschman-Rasmussen approach does not take into consideration the value of the total production in each sector, which is done by the pure linkages approach (Guilhoto et al., 1996).
Table 3 shows the results for the pure normalized linkages.
The greatest values for the pure backward linkages are found in the following sectors: Civil Construction (29), Public Administration (53), Trade (30), Other Food industries (26), and Meat and Meat Industries (22).
For the pure forward linkages the sectors with the highest values are: Chemicals (14), Agriculture (1), Trade (3), Other Business Services (51), and Metallurgic Industries (5).
In general, the values of the linkages for the sectors in the tourism complex are smaller
Table 3. Pure Normalized Linkages for the Brazilian Economy – 1999.
Sectors Backward Rank Forward Rank Total Rank Linkages Linkages Linkages
1 Agriculture 2.1370 8 6.2046 2 4.1620 3
2 Mining 0.2577 37 1.5929 10 0.9224 20
3 Non-metallic mineral industries 0.1485 40 1.7000 9 0.9209 21
4 Steel industries 0.3791 36 2.0038 7 1.1879 14
5 Metallurgic industries 0.6910 21 2.8017 5 1.7418 8
6 Machinery and tractors industries 1.0605 12 0.9695 16 1.0152 17
7 Electric equipment industries 0.9645 15 0.4867 26 0.7266 27
8 Electronic equipment industries 0.5400 27 0.0849 42 0.3135 39
9 Automobiles, trucks and buses industries 1.8958 10 0.0598 46 0.9817 18
10 Motors and parts for vehicles industries 0.8619 17 1.0516 14 0.9563 19 11 Wood and furniture industries 0.7715 19 0.4552 28 0.6140 29 12 Pulp and paper industries 0.4844 29 1.7671 8 1.1230 15 13 Rubber industries 0.0994 44 0.7643 20 0.4304 35
14 Chemicals 0.5421 26 8.9589 1 4.7323 1
15 Pharmaceutical and medicine industries 1.0433 13 0.2475 34 0.6471 28 16 Plastic industries 0.0954 45 0.8955 19 0.4937 33 17 Textile industries 0.4331 33 1.1141 13 0.7722 24 18 Clothing industries 1.0174 14 0.0192 51 0.5205 31 19 Footwear industries 0.4379 32 0.0361 48 0.2379 42 20 Coffee industries 0.8541 18 0.0673 44 0.4624 34 21 Other vegetables processing 2.1844 7 0.5648 25 1.3781 11 22 Meat and meat industries 2.4354 5 0.2655 33 1.3551 12 23 Dairy products industries 0.5956 25 0.1166 40 0.3571 38 24 Sugar industries 0.5183 28 0.2460 35 0.3827 36 25 Vegetable oil mills 0.8898 16 0.6225 23 0.7567 25 26 Other food industries 2.6059 4 0.9443 18 1.7787 7 27 Miscellaneous manufacturing 0.3971 35 0.3671 30 0.3821 37 28 Electricity, gas and water supply 0.4019 34 2.1340 6 1.2642 13 29 Civil Construction 7.1990 1 0.7465 22 3.9867 4
30 Trade 4.6027 3 4.5987 3 4.6007 2
31 Transit and Ground Passenger Transportation, schedule 0.5979 24 0.4566 27 0.5275 30 32 Transit and Ground Passenger Transportation,
nonscheduled 0.0441 48 0.0337 49 0.0389 50 33 Scenic and Sightseeing Transportation 0.0005 54 0.0004 53 0.0005 54 34 Truck Transportation 0.6070 23 1.1625 12 0.8835 22 35 Other ground transportation 0.2085 38 0.1337 39 0.1712 43 36 Water transportation 0.0823 46 0.0700 43 0.0761 46 37 Scheduled Air Transportation 0.6789 22 0.3162 32 0.4983 32 38 Nonscheduled Air Transportation 0.0394 49 0.0189 52 0.0292 52 39 Travel agencies 0.0544 47 0.2330 36 0.1433 44 40 Support Activities for Ground Transportation 0.0256 52 0.0609 45 0.0432 49
Table 3 (Continued). Pure Normalized Linkages for the Brazilian Economy – 1999.
Sectors Backward Rank Forward Rank Total Rank Linkages Linkages Linkages
41 Support Activities for Water Transportation 0.0341 50 0.0888 41 0.0613 47 42 Support Activities for Air Transportation 0.0278 51 0.0494 47 0.0385 51 43 Other Support Activities for Transportation 0.1046 43 0.1679 37 0.1361 45 44 Communications 0.4638 31 1.0466 15 0.7540 26 45 Financial intermediation 1.9125 9 1.5035 11 1.7089 9 46 Accommodation 0.4694 30 0.1457 38 0.3082 40 47 Foodservices and Drinking Places 1.8041 11 0.3439 31 1.0772 16 48 Amusement and Recreation Services 0.1074 42 0.3768 29 0.2415 41 49 Other Personal services 2.3463 6 0.5754 24 1.4647 10 50 Automotive and other Transportation Equipment Rental
and Leasing 0.0130 53 0.0310 50 0.0220 53 51 Other Business services 0.1843 39 3.6024 4 1.8859 6 52 Real estate 0.7039 20 0.9456 17 0.8242 23 53 Public administration 6.8350 2 0.7504 21 3.8058 5 54 Private households with employed persons 0.1109 41 0.0000 54 0.0557 48
Source: Casimiro Filho (2002).
Taking as a key sector the one that presents its value for the pure normalized total linkage greater than one, the following ones can be considered key ones: Chemicals (14), Trade (30), Agriculture (1), Civil Construction (29), Public Administration (53), Other Business Services (51), Other Food Industries (26), Metallurgic Industries (5), Financial Intermediation (45), Other
Personal Services (49), Other Vegetables Processing (21), Meat and Meat Industries (22), Electricity, Gas and Water Supply (28), Steel Industries (4), Pulp and Paper Industries (12), Foodservices and Drinking Places (47), and Machinery and Tractors Industries.
As it can be seen, the key sectors in the Brazilian economy for the year of 1999 show a great diversity. This can be attributed to the complex productive structure of the Brazilian economy.
[image:16.612.72.542.95.309.2]4. FINAL REMARKS
The aim of this study was to construct an input-output model for the tourism complex of the Brazilian economy, for the year of 1999, and from there to measure and to analyze the intersectoral relations that take place in the economy, with the identification of key economic sectors.
Among the sectors considered as key one, six are found in the tourism complex: Schedule Air Transportation (37), Nonscheduled Air Transportation (38), Travel Agencies (39), Support Activities for Air Transportation (42), Accommodation (46), and Foodservices and Drinking Places (47).
REFERENCES
CASIMIRO FILHO, F. Contribuições do turismo à economia brasileira. Piracicaba, 2002.
220p. Ph.D. Dissertation – Escola Superior de Agricultura Luiz de Queiroz, Universidade de São
Paulo.
CRUZ, R. C. Política de turismo e território. São Paulo: Contexto, 2000. 167p.
GUILHOTO, J.J.M.; SONIS, M.; HEWINGS, G.J.D. Linkages and multipliers in a
multiregional framework: integration of alternative approaches. Urbana: University of
Illinois/Regional Economics Applications Laboratory, 1996. (Discussion paper)
GUILHOTO, J.J.M.; SESSO FILHO, U. Estimação da Matriz Insumo-Produto à Partir de
Dados Preliminares das Contas Nacionais. Economia Aplicada. 2004. In Printing.
HIRSCHMAN, A. O The strategy of economic development. New Haven: Yale University
Press, 1958. 217p.
INSTITUTO BRASILEIRO DE TURISMO; FUNDAÇÃO DE APOIO AO
DESENVOLVIMENTO DA UFPE. Estudo econômico-financeiro dos meios de hospedagens
e parque temáticos no Brasil. Brasília: EMBRATUR, 1998. 180p.
LOPES, J.C. O turismo e o desenvolvimento regional do Norte e Nordeste. Informações FIPE,
n.120, p.15-17, jul. 1990.
McGILVRAY, J. Linkages, key sectors and development strategy In: Leontief, W. (Ed.).
Structure, system and economic policy. Cambridge: University Press, 1977. p.49-56.
RASMUSSEN, P. N. Studies in intersectoral relations, Amsterdam: North-Holland, 1956.
SAAB, W.G.L.; DAEMON, I.G.O segmento hoteleiro no Brasil. BNDES Setorial, n.13,
p.127-156, mar. 2001.
SONIS, M.; HEWINGS, G.J.D. Erro and sensitivity input-output analysis: a new approach. In:
MILLER, R.E.; POLENSKE, K.R.; ROSE, A.Z. (Ed.). Frontiers of input-output analysis.
New York: Oxford University Press, 1989. p. 232-244.
SONIS, M.; HEWINGS, G.J.D. Fieds of influence in input-output systems. Urbana:
University of Illinois / Regional Economics Applications Laboratory, 1995. 27p.
WORLD BANK. Growth of output. http://www.worldbank.org/data (02/04/2001)
WORLD TOURISM ORGANIZATION. Tourism highlights. http://www.world-tourism.org