© 2018, IRJET | Impact Factor value: 6.171 | ISO 9001:2008 Certified Journal | Page 516
EXPERIMENTAL STUDY ON IMPROVING THE STRENGTH OF COHESIVE
SOIL BY BITUMINOUS EMULSION
G.ELAVARASI
1, P.SANKAR
2, S.SEDURAMAN
3K.SIDDHARTHAN
4, P.SIVANESAN
51Assistant professor, Department of civil Engineering, K.Ramakrishnan College of Technology, Trichy, Tamil Nadu, India.
2,3,4,5 Student, Department of civil Engineering, K. Ramakrishnan College of Technology, Trichy, Tamil Nadu, India. ---***--- Abstract - Soil is one of the nature’s most abundant
construction materials. Almost all type of construction is built with or upon the soil. If the sub grade is not enough good the whole structure will face failure such as cracks. Therefore the sub grade is normally replaced with stronger soil material so as to improve the strength but this is not economical. In this project the strength of soil is increased by adding bituminous emulsion instead of replacing with stronger soil. The initial strength of the soil is determined by conducting soil tests such as specific gravity, plastic limit, liquid limit, unconfined compression strength test, tri-axial test and California bearing ratio tests. The results obtained are then compared with the soil treated with 5%, 10% and 15% of bitumen emulsion. The process of soil stabilization helps to achieve the require properties in a soil needed for the construction work.
Key Words: Cohesive Soil, Bitumen Emulsifier, index properties, Shear strength.
1.INTRODUCTION
In this thesis, the strength of the soil is improved by using bituminous emulsion. Bitumen emulsion is a mixture of water & bitumen. As bitumen is an oil product it cannot be mixed with water. Hence an emulsifier (a surface active agent) is added with water before bitumen. Addition of emulsifier with water before adding bitumen into minute particles and keeps it dispersed in suspension. The term emulsion means that dispersion of small droplets of one liquid in another liquid. Types of emulsion are oil –in-water (continuous phase is –in-water and the disperse phase is an oily) and water-in-oil (continuous phase is an oil and the disperse phase is water). Here the emulsifier is used as kerosene with water. Initially the properties of soil are determined by using conducting sieve analysis, plastic limit, liquid limit and specific gravity. The strength of soil is determined by UCC, triaxial test and CBR test.
1.1 Objective
To increase the shear strength of soil.
To improve the soil strength using bitumen emulsion. To compare the test results of normal soil and bitumen emulsion added soil.
Verdict the variation of strength in the soils by using the bitumen emulsion performance different proportions applied and determining the variation in properties of soil
2. MATERIALS USED
2.1 Soil
[image:1.595.319.545.411.477.2]Cohesive soil means clay (fine grained soil), or soil with a high clay content, which has cohesive strength. Cohesive soil does not crumble, can be excavated with vertical slide slopes, and is plastic when moist. Cohesive soil is hard to break up when dry, and exhibits significant cohesion when submerged.
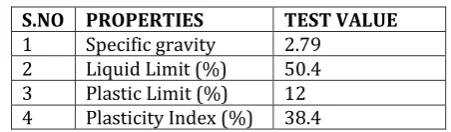
Table.1 Properties of soil
S.NO PROPERTIES TEST VALUE
1 Specific gravity 2.79 2 Liquid Limit (%) 50.4 3 Plastic Limit (%) 12 4 Plasticity Index (%) 38.4
2.2 Properties of Bitumen
Molecular weight wise, bitumen is a mixture of about 300-2000 chemical components .Elementally it is around 95%carban and hydrogen (87% carbon 8% hydrogen) and up to 5% sulphur, 1% nitrogen, 1% oxygen and 2000ppm metals. Bitumen is composed mainly of highly condensed polycyclic aromatic hydrocarbons. They also contain several elements.
2.3 PROPERTIES OF KEROSENE (EMULSIFIER)
Kerosene is a thin, clear liquid formed from hydrocarbons obtained from the fractional distillation of petroleum between 150°C and 275°C, resulting in a mixture with a density of 0.78-0.81 g/cm3 composed of carbon chains that typically contain between 6 and 16 carbon atoms per molecule.
2.3.1 ADVANTAGES OF USING BITUMENOUS EMULSION
Emulsifier improves the handling of bitumen at room temperature.
© 2018, IRJET | Impact Factor value: 6.171 | ISO 9001:2008 Certified Journal | Page 517 Economical and saves human energy.
Reduced atmospheric pollution.
Water can also added before use to dilute as per requirements
Rains cannot affect it at the time of use and after use
3. DETERMINE THE INDEX PROPERTIES OF SOILS WITH AND WITHOUT BITUMEN EMULSION
3.1. Specific gravity
To determine the specific gravity of laterite soil by using density bottle. Specific gravity G is defined as the ratio of the weight of an equal volume of distilled waters at that temperature both weights taken in air.
FORMULA:
[image:2.595.310.558.129.206.2]G = (W2-W1) / (W4-W1)(W3-W2)
Table 2. Specific gravity
S.NO SAMPLE SPECIFIC GRAVITY
1 Cohesive soil 2.79
2 Soil with 5% bitumen
emulsion 2.83
3 Soil with 10%
bitumen emulsion 2.88
4 Soil with 15%
bitumen emulsion 2.84
3.2. Liquid Limit
[image:2.595.312.556.308.384.2]The Liquid Limit (LL) is often conceptually defined as the water content at which the behavior of a clayey soil changes from plastic to liquid. Actually, clayey soil does have very small shear strength at the liquid limit and the strength decreases as water content increases; the transition from plastic to liquid behavior occurs over a range of water contents.
Fig 1. Liquid limit
Table 3 Liquid limit of cohesive soil
Weight of the soil sample taken is 120gm
S.NO WATER CONTENT IN % NO OF BLOWS
1 46 56
2 48 38
3 50 26
4 52 21
5 54 18
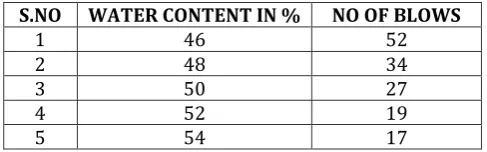
Table 4 liquid limit of cohesive soil with 5% bitumen emulsion
Weight of soil taken 150gm Sieve size 75μ
Soil with 5% bitumen emulsion
S.NO WATER CONTENT IN % NO OF BLOWS
1 46 52
2 48 34
3 50 27
4 52 19
5 54 17
Table 5 liquid limit of cohesive soil with 10% bitumen emulsion
Weight of soil taken 120gm Sieve size 75μ
Soil with 10% bitumen emulsion
S.NO WATER CONTENT IN % NO OF BLOWS
1 46 50
2 48 35
3 50 26
4 52 18
[image:2.595.29.284.353.454.2]5 54 16
Table 6 liquid limit of cohesive soil with 15% bitumen emulsion
Weight of soil taken 120gm Sieve size 75μ
Soil with 15% bitumen emulsion
S.NO WATER CONTENT IN % NO OF BLOWS
1 46 47
2 48 32
3 50 24
4 52 16
[image:2.595.313.556.488.564.2] [image:2.595.39.287.582.734.2]© 2018, IRJET | Impact Factor value: 6.171 | ISO 9001:2008 Certified Journal | Page 518 3.3 plastic Limit
[image:3.595.40.286.164.321.2]The plastic limit is defined as the moisture content where the thread breaks apart at a diameter of 3.2 mm (about 1/8 inch). A soil is considered non-plastic if a thread cannot be rolled out down to 3.2 mm at any moisture.
[image:3.595.310.554.334.510.2]Fig 2. Plastic limit
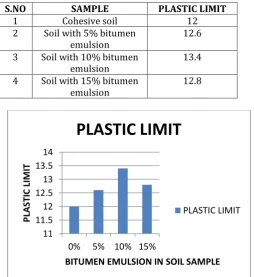
Table 7 Plastic limit of cohesive soil with and without bitumen emulsion
Weight of soil sample taken 50 gram Sieve size 75μ
S.NO SAMPLE PLASTIC LIMIT
1 Cohesive soil 12
2 Soil with 5% bitumen
emulsion 12.6
3 Soil with 10% bitumen
emulsion 13.4
4 Soil with 15% bitumen
emulsion 12.8
Percentage of variance for 0% and 10% sample is 11.6.
Chart1. Plastic limit value for different proportion of bitumen emulsion in soil.
4. SHEAR STRENGTH OF SOIL WITH AND WITHOUT BITUMEN EMULSION
4.1Unconfined compressive strength
The unconfined compressive strength (qu) is the load per unit area at which the cylindrical specimen of a cohesive soil falls in compression.
qu =P/A
P= axial load at failure, A= corrected area A=Ao/(1-e)
Ao= initial area of specimen e= axial strain
The undrained shear strength (s) of the soil is equal to the one half of the unconfined compressive strength,
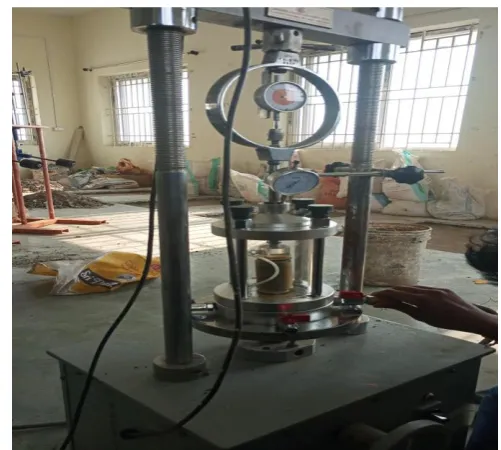
[image:3.595.32.287.424.702.2]S=qu/2
Fig 3. UCC test
Table 8 UCS test for cohesive strength
Weight of soil sample taken 280gm Sieve size 75μ
Water content 48ml Size of the mould:
Height 9cm Diameter 4.5cm
load Deflection
(mm) strain 1-e A= Ao/(1-e) (cm2)
Stress P/A (N/cm2)
8 0.9 0.100 0.900 17.65 0.4532
12 1.2 0.133 0.864 18.28 0.6564
16 1.9 0.211 0.789 20.13 0.7948
20 3.8 0.422 0.578 27.49 0.7278
24 4.4 0.488 0.512 31.03 0.7734
24.8 4.9 0.544 0.456 34.84 0.7118 UCS value=0.3974
11 11.5 12 12.5 13 13.5 14
0% 5% 10% 15%
P
LA
ST
IC
L
IM
IT
BITUMEN EMULSION IN SOIL SAMPLE
PLASTIC LIMIT
© 2018, IRJET | Impact Factor value: 6.171 | ISO 9001:2008 Certified Journal | Page 519 Table 9 UCS test for soil with 5% bitumen emulsion
Weight of soil sample taken 300gm Bitumen emulsion 5% added soil (15ml) Sieve size 75μ
Water content 33ml Size of the mould:
Height 9cm Diameter 4.5cm
load Deflection (mm)
strain 1-e A= Ao/(1-e) (cm2)
Stress P/A (N/cm2)
12.8 1.4 0.155 0.845 18.80 0.6808 16.8 1.7 0.188 0.812 19.56 0.8588
20.8 2 0.222 0.772 19.91 1.0447
24.8 2.6 0.288 0.712 22.31 1.1116
28.8 3.6 0.4 0.6 26.48 1.0876
32 4.4 0.488 0.512 31.03 1.0312
UCS VALUE = 0.5558 N/cm2
Table10 UCS test for soil with 10% bitumen emulsion
Weight of soil sample taken 300gm Bitumen emulsion 10% added soil (30ml) Sieve size 75μ
Water content 18ml Size of the mould:
Height 9cm Diameter 4.5cm
load Deflection (mm)
strain 1-e A= Ao/(1-e) (cm2)
Stress P/A (N/cm2)
20 2.6 0.288 0.712 22.31 0.8964
24 2.9 0.322 0.678 23.43 1.0243
28 3.2 0.355 0.645 24.63 1.1368
32 4.1 0.455 0.545 29.19 1.0977
36 4.5 0.5 0.5 31.78 1.1327
40 5.3 0.588 0.412 38.56 1.0373
UCS VALUE = 0.5684 N/cm2
Table11 UCS test for soil with 15% bitumen emulsion
Weight of soil sample taken 280gm Bitumen emulsion 15% added soil Sieve size 75μ
Water content 3ml Size of the mould:
Height 9cm Diameter 4.5cm
load Deflection
(mm) strain 1-e A= Ao/(1-e) (cm2)
Stress P/A (N/cm2)
24 3 0.333 0.666 23.82 1.0075
28 3.7 0.411 0.588 26.97 1.0381
32 4.2 0.466 0.533 29.97 1.0756
36 5.3 0.588 0.511 31.09 1.0579
40 6.9 0.711 0.288 54.98 0.7275
46.4 7 0.778 0.222 71.57 0.6483
UCS VALUE = 0.5378 N/cm2
Percentage of variance for 0% and 10% sample is 43
Chart2. UCC valuefor different proportion of bitumen emulsion in soil
[image:4.595.303.554.506.731.2]4.2 TRI AXIAL COMPRESSION TEST
Fig 4. Tri axial test
0 0.1 0.2 0.3 0.4 0.5 0.6
0% 5% 10% 15%
U
C
C
V
A
LU
E
(N/
cm
2)
BITUMEN EMULSION IN SOIL SAMPLE
UCC VALUE
© 2018, IRJET | Impact Factor value: 6.171 | ISO 9001:2008 Certified Journal | Page 520 Table 12 Tri axial test for cohesive soil
Lo ad D ef le ct io n (m m ) st ra in 1
-e A=A
o/ (1 -e ) (c m 2 ) St re s P /A (N/ cm 2 ) co h esi on C
20 1.1 0.122 0.878 18.09 1.1056 0.553 24 1.4 0.155 0.845 18.73 1.2813 0.640 28 1.7 0.188 0.812 19.56 1.4315 0.715 32 2.2 0.244 0.756 21.02 1.5223 0.761 36 4.1 0.455 0.545 29.16 1.2346 0.617 40 5.8 0.644 0.356 44.63 0.8962 0.448
[image:5.595.29.286.87.266.2]Tri axial value = 0.7612 N/cm2
Table 13 Tri axial test for soil with 5% bitumen emulsion Lo ad D ef le ct io n (m m ) st ra in 1
-e A=A
o/ (1 -e ) (c m 2 ) St re s P /A (N/ cm 2 ) co h esi on C
52 2.1 0.233 0.767 20.72 2.509 1.254 56 2.3 0.255 0.745 21.33 2.625 1.312 60 2.5 0.277 0.728 21.82 2.750 1.375 64 2.8 0.311 0.689 23.06 2.775 1.387 68 3.3 0.367 0.633 25.10 2.710 1.355 72 4.2 0.467 0.533 29.81 2.415 1.207
Tri axial value = 1.3875 N/cm2
Table 14 Tri axial test for soil with 10% bitumen emulsion lo ad D ef le ct io n (m m ) st ra in 1
-e A=A
o/ (1 -e ) (c m 2 ) St re s P /A (N/ cm 2 ) co h esi on C
68 2.2 0.22 0.756 21.02 3.235 1.617 72 2.5 0.277 0.723 21.98 3.275 1.637 76 3 0.333 0.664 23.93 3.176 1.588 80 3.6 0.400 0.600 26.48 3.021 1.511 84 3.9 0.433 0.564 28.02 2.998 1.499 88 4.1 0.456 0.544 29.20 3.014 1.507
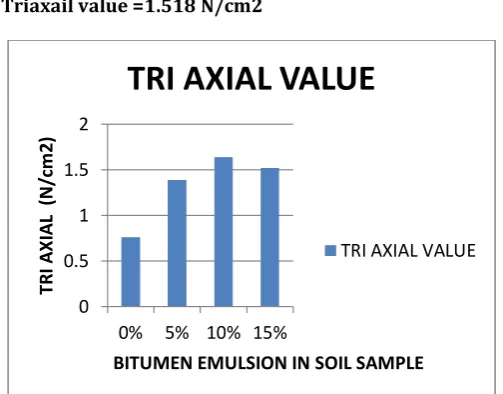
Triaxail value =1.6375 N/cm2
Table 15 Tri axial test for soil with 15% bitumen emulsion lo ad D ef le ct io n (m m ) st ra in 1
-e A=A
o/ (1 -e ) (c m 2 ) St re s P /A (N/ cm 2 ) co h esi on C
61 2.3 0.255 0.75 21.31 2.871 1.435 66 2.6 0.289 0.711 22.35 2.935 1.467 71 2.9 0.322 0.678 23.44 3.036 1.518 76 3.5 0.389 0.611 26.01 2.937 1.468 81 3.9 0.433 0.567 28.02 2.884 1.442 84 4.3 0.78 0.522 30.44 2.760 1.380
Triaxail value =1.518 N/cm2
Percentage of vairence for 0% and 10% sample is 37.
Chart 3 Tri axial valuesfor different proportion of bitumen emulsion in soil
4.3 CALIFORNIA BEARING RATIO TEST
The C.B.R test is an empirical test and depends upon the condition of the soil at the time of testing. According to the state commission of roads and bridges (SCRB, 1999) specification the CBR must correspond to 95% of the maximum dry density of the AASHTO compaction.
CBR = Test load * 100/ standard load
Table 16 CBR TEST FOR COHESIVE SOIL
PENETRATION LOAD Kg/cm2 CBR VALUE
0.5 160 2.28
1 165 2.35
1.5 170 2.43
2 175 2.50
2.5 180 2.57
0 0.5 1 1.5 2
0% 5% 10% 15%
TR I A X IA L ( N/ cm 2)
BITUMEN EMULSION IN SOIL SAMPLE
TRI AXIAL VALUE
[image:5.595.307.559.282.479.2]© 2018, IRJET | Impact Factor value: 6.171 | ISO 9001:2008 Certified Journal | Page 521
3 190 1.80
4 210 2.00
5 235 2.23
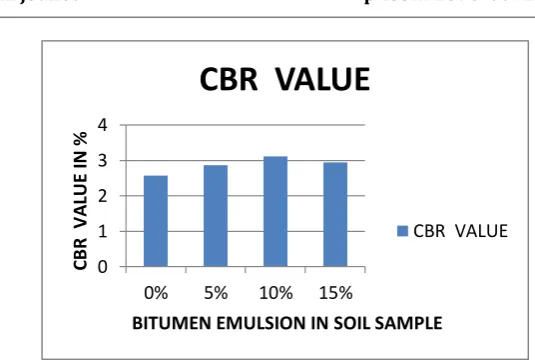
CBR VALUE =2.57%
Table 17 CBR TEST FOR SOIL WITH 5% BITUMEN EMULSION
PENETRATION LOAD Kg/cm2 CBR VALUE
0.5 180 2.57
1 185 2.64
1.5 190 2.71
2 195 2.79
2.5 200 2.88
3 210 2.00
4 230 2.19
5 255 2.43
[image:6.595.290.558.62.242.2]CBR VALUE =2.86%
Table 18 CBR TEST FOR SOIL WITH 10% BITUMEN EMULSION
PENETRATION LOAD Kg/cm2 CBR VALUE
0.5 200 2.86
1 205 2.93
1.5 210 3.00
2 215 3.07
2.5 220 3.11
3 230 2.19
4 255 2.43
5 270 2.57
CBR VALUE =3.11%
Table 19 CBR TEST FOR SOIL WITH 15% BITUMEN EMULSION
PENETRATION LOAD Kg/cm2 CBR VALUE
0.5 185 2.64
1 190 2.71
1.5 195 2.79
2 200 2.86
2.5 205 2.94
3 215 2.05
4 235 2.24
5 260 2.48
CBR VALUE =2.94%
Percentage of vairence for 0% and 10% sample is 21.
Chart 4 CBR valuesfor different proportion of bitumen emulsion in soil
[1] E.Kowalski and Dale W.Starry, Jr.Wirtgen
America,Inc.,(2007)Modern Soil Stabilization Techniques.
[2] SK. Wasim Anwar, Experimental Investigations on Mar
shall and Modified Marshall Specimens by using Neat Bitumen. International Journal of Civil Engineering and Technology (IJCIET) , 7(5), 2016, pp.409–419
[3] Talaat Abde-Wahed and Hassan Al Nageim,
Investigating the Effects of Cement and Cement Kiln Dust as a Filler on the Mechanical Properties of Cold Bituminous Emulsion Mixtures. International Journal of Civil Engineering and Technology (IJCIET), 7 (1), 2016, pp.441 – 453.
[4] Justyna Mrugala (2004)-Soil Stabilisation with Foamed
Bitumen.
[5] Maheswari G. Bismal and Ravikumar Badiger (July
2015) Study On Stabilization Of Soil Using Sea Shell And Bitumen Emulsion.
0 1 2 3 4
0% 5% 10% 15%
C
BR
V
A
LU
E
IN
%
BITUMEN EMULSION IN SOIL SAMPLE
CBR VALUE
CBR VALUE
5. CONCLUSION
This study made a comprehensive examination of the effectiveness of soil on the performance of bitumen emulsion. The characteristics of soil sample were known from the tests conducted and the similar tests are conducted for the soil sample mixed with three different proportions of bitumen emulsion (5%, 10%, and 15%) . The test results indicate that with the increase of bitumen emulsion in the soil sample till 10% proportion ratio the shear strength is increased and after certain percentage (15%) is getting decreased .The results are shown that the shear strength of the soil good when 10% bitumen emulsion is added.