Document Clustering using Learning from Examples
G. Thavasi Raja, R. Malmathanraj & M. Arun
Department of Electronics and Communication Engineering
National Institute of Technology (NIT), Tiruchirappalli
Tamil Nadu- 620 015, India
ABSTRACT
Information filtering (IF) systems usually filter data items by correlating a set of terms representing the user’s interest with similar sets of terms representing the data items. Many techniques have been employed for constructing user profiles automatically, but they usually yield large sets of data. Various dimensionality-reduction techniques can be applied in order to reduce the number of terms in a user query. A new framework is described to classify large scale documents and retrieve the documents related to the user’s query based on the application of trained artificial neural network (ANN) model. Its novel feature is the identification of an optimal set of documents that are relevant to the user. As a case study the government orders issued by Tamil Nadu state government, a state in India are classified according to their semantic similarity. Various neural architectures such as back propagation neural network (BPN), radial basis function (RBF), Learning Vector Quantization (LVQ) and Support vector machines (SVM) are used and their performance evaluation is analyzed.
General Terms
Text classification
Keywords
Document clustering, Artificial Neural Networks (ANN), Learning form examples.
1.
INTRODUCTION
While searching textual databases by keywords, a large number of the retrieved texts may not be relevant to the searcher/user. An automatic filtering system, which learns the user’s preferences and filters the search results accordingly, might be useful. Information filtering (IF) is a research area that provides tools for filtering out irrelevant information. It provides personalized assistance for continuous retrieval of information in situations of information-overflow in general, and on the Internet in particular. Automatic text classification is the task of assigning predefined categories to unclassified text documents. When an unknown document is given to the system it automatically assigns it to the category which is most appropriate. The classification of textual data has practical significance in effective document management. In particular, as the amount of available online information increases, managing and retrieving these documents are difficult without proper classification. There are two main approaches for document classification namely Supervised and Unsupervised learning. In supervised learning, the classifier is first trained with a set of training data in which documents are labeled with their category, and then the trained system is used for classifying new documents. The unsupervised learning is mainly based on clustering. Due to the development of information technology, extensive studies have been conducted on document classification. The classification and organization of documents in an effective way can make accessing of information from these documents
a lot easier. Currently, many researchers are working in this area [12],[1] and [4]. Competitive learning[5,2] in particular self organizing map [12],[13],[10],[7],[8],[9],[11],[3],[6] has been use for text mining. For neural network, training documents and testing documents are represented as vectors. Input vectors and the corresponding target vectors are used to train until it can approximate a function, associate input vectors with specific target vectors. The automatic classification of text plays a major role in the process of corpus building. The documents available in online can be added to the corpus by proper classification of those documents. Text categorization can be used in applications where there is a flow of dynamic information that needs to be organized. In this paper, the corpus is the government orders issued by Tamil Nadu state government and is used for training and testing the models. These models are used in the process of automatic corpus building process in which new government orders issued recently are classified into one of the predefined classes and added in the corpus.
The objective of this work is to design a tool to search related documents from the database of articles. The aim of this tool is to reduce manual workload and to give an immediate answer to the human being (when possible) by exploring the cumulative experiences from the database of contents. A new technique is proposed and implemented to concern the automatic answering of human queries about some government orders (G.O). The aim of this tool is to reduce the search related to Government orders and to give an immediate answer to the human by exploring the cumulative experiences from the developed corpus. In this paper we use a hierarchy of self organizing map (SOM), coding schemes, BPN, RBF, LVQ and SVM to classify the Government orders.
2.
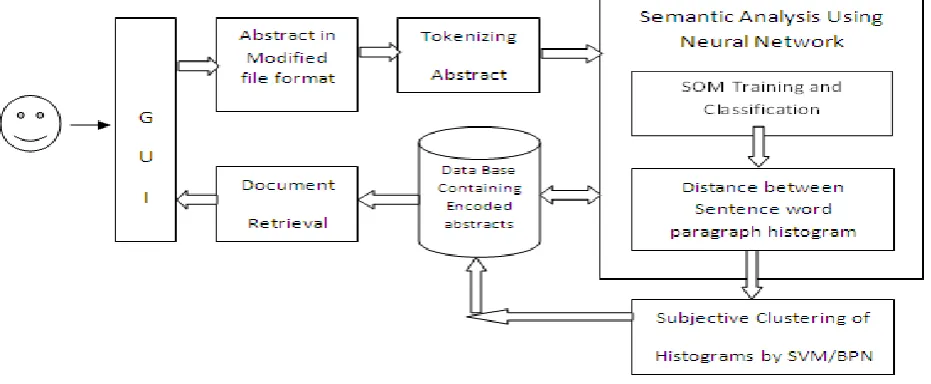
METHODOLOGY
Fig 1: Proposed architecture for Semantic search
Fig 2: SOM for clustering closer words and to plot histogram with number of occurrences in the document.
Note closer words are clustered into one word by SOM.
The filtered text is translated into a suitable form for clustering purposes. This is done by encoding. The encoding of words is a wide subject and there are several approaches for doing it: 1) The word is recognised and replaced by a code. This approach is sensitive to new words. 2) The succeeding words are replaced with a code. This method is language sensitive. 3) Each word is analysed character by character and based on the characters a key entry to a code table is calculated. This approach is sensitive to capital letters and conjugation if the code table is not arranged in a special way. We chose the third alternative, because it is accurate and suitable for statistical analysis.
A word w is transformed into a number in the following manner:
10 4
2
L
i
i L i
C
y
(1)where L is the number of characters in the word and ci is a character within a word w. The word w assigns now a value, a word vector Y by a tabulated function. The table has a size of
N*M where N is the length of the table and M is the length of the word vector. Now
P
y
f
Y
(
)
mod
(2)where P is the suitable prime and N<P<NW. The table consists of Gray coded binary numbers. The idea is that similar words will get the same word vector. The words that resemble like each other get word vectors that are close to each other. Note that the relation is not a unique one. The actual code in the table is produced from binary code in iterating manner. Note that x<N
1
1
x
y
(3)2 1
2
x
x
y
(4)3 1
3
x
x
y
(5)
N N
N
x
x
y
1
(6)where
is a logical exclusive-or operation. A word W is associated to a word vector Y. The word vectors are clustered by the Self-Organizing Feature Map.output of the SOM are topologically arranged in the sense that the closer input vectors are represented by closer neurons. Given an input document W and a bank of unique words 𝐹𝛼∝
= 1,2,3, … , 𝐾, we compute, for each bank of words a word histogram by calculating the number of occurrences of words. For 𝐹∝we define the marginal distribution or histogram
.
))
(
(
/
1
)
(
z
W
z
W
v
H
w
(7) We then define the spectral histogram with respect to the chosen filters as
)
,...,
,
,
(
1w w2 w3 wKW
H
H
H
H
H
(8) The encoding of words is a wide subject and there are several approaches for doing it:
1) The word is recognized and replaced with a code. This approach is sensitive to new words.
2) The succeeding words are replaced with a code. This method is language sensitive.
[image:3.595.61.275.441.516.2]3) Each word is analyzed character by character and based on the characters a key entry to a code table is calculated. This approach is sensitive to capital letters and conjugation if the code table is not arranged in a special way.
Fig 3: Creating sentence vectors from the encoded words.
The last alternative is chosen because it is accurate and suitable for statistical analysis. In the second step the filtered text is encoded word by word. A K-gram, small neighborhood of encoded words, i.e. K is words, is taken as an input to a Self-Organizing process. The small neighborhood glides step by step over the sentence. The words are translated into the input vectors, sentence vectors S and paragraph vectors, by the SOM (illustrated in Figure 2 and Figure 3). The document is considered as paragraph by paragraph as a fixed length K-sentences, i.e. K is 30. These K-sentences on the document are considered as paragraph vectors C and clustered by SOM. The created map is now called a paragraph map. The paragraphs are processed in similar way as sentences. A window of K-sentence vectors glides over the paragraph. They are replaced with the address of the best matching units on the paragraph map. Now, a histogram A corresponding to the best matching elements is collected.
One such simple method for document indexing is defined by the following steps:
1. Find the unique words in each document in the collection of training documents.
2. Encode the words.
3. Calculate the frequency of occurrence of each of these unique words for each document in the database. This is word histogram. Similarly calculate sentence histogram and paragraph histogram.
4. Compute the Kullback-leibler distance (KLD) between these distributions.
5. Classify the documents depending on the KLD by neural networks using learning from examples principle.
3.
LEARNING FROM EXAMPLES
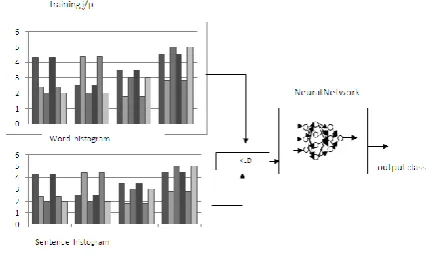
The objective of this research work is to predict the semantic closeness of documents by using the concept of Learning from examples as shown in Fig 4. The first step in building a neural network application to perform classification of G.O’s is to develop a test data set for the neural network to use in training itself.
The classification in this approach is based on the comparison between the histograms. This procedure is one form of vector quantization. This histogram approach makes it possible to gain accuracy and speed in comparison. The word histograms, sentence histograms, paragraph histograms and the KLD measure are used as input features for classification. The training algorithm of the BPN, RBF, LVQ and SVM is modified to include the histogram in the training set. The KLD distance measure is also used for classification.
Fig 4: Text classification using neural networks and KLD Measure
[image:3.595.320.537.500.629.2]according to the KLD’s between the word and sentence histograms of the documents.
3.1
Kullback-Leibler distance (KLD)
Measure
The histograms have been used since the early days of image retrieval, especially in Image processing. In this research work we use the histogram approach to find the semantically close documents.
Let us consider the family of piecewise constant densities defined as 𝑝 𝑥: 𝜃 = 𝑝𝑖 for x𝜖𝑆𝑖, (i=1,…,R). Here the set of model parameters is 𝜃𝑖= (𝑝1, … . , 𝑝𝑅) where 𝑝𝑖≥ 0 and
𝑝𝑖= 1 𝑅
𝑖=1 . The feature extractor step is to calculate the
feature vector θ where
arg
max
L
i 1
log
)
:
(
x
i
p
(9) = k R k kp
n
R
k
i
p
log
1
max
arg
1
(10)where nk is number of data samples in (
(
x
1,...,
x
l)
).When searching for similar documents given the query data
) (q
x
and its featurep
(q) the KLD between the query wordhistogram and each candidate histogram Ii can be used to rank the documents in the database.
)
(
log
)
| |
(
1 q k R k q k q k i qp
p
p
p
p
D
(11)
. =
R k i k q k q k qk
p
p
p
p
1
log
log
(12)
3.1.1
Inputs and Outputs
This module is used to choose which variables would be used as input variables and outputs, and to either specify or compute the minimum and maximum values for each variable. Input variables were used by the neural network to make the prediction or classification (the independent variables). The learning from examples concept is used for predicting the classification label for the given G.O. The input variables used are the histogram graphs for word, sentence and document projections. The KLD measure is also used as an input. Output variable (the dependent variable) contains the class to which the input document G.O belongs to.
3.1.2
File Extraction
From the data set population (inputs and results), test, training, and production files were extracted. A test data set containing 136 data points for word maps was randomly extracted by the neural network to compute average training error used to determine when to stop training. A training set containing all the Government order word maps data was used for network learning.
3.1.3
Architecture Selection
A variety of neural network architectures are available to process the data from the input data set files. The BPN, RBF, LVQ and SVM were used for training because of their ability to generalize well when applied to a wide variety of applications and also for the ability to have better regression.
3.2
Support Vector Machines (SVM)
Support Vector Machines (SVM) is a novel powerful machine learning method based on small-sample Statistical Learning Theory (SLT). SVM for classification and nonlinear function estimation, as introduced by Vapnik [18] and further investigated by many others [19], is an important new methodology in the area of neural networks and nonlinear modeling. Least squares support vector machines (LS-SVM) proposed by Suykens and Vandewalle [20] is trained by solving a set of linear equations. LS-SVM is an extension of standard SVM and used to formulate for two-class classification problems and multiclass classification problems. LS-SVMs have been investigated for classification and function estimation.
The SVM proposed by Vapnik has been studied extensively for classification, regression and density estimation. SVM maps the input patterns into a higher dimensional feature space through some nonlinear mapping chosen a priori. A linear decision surface is then constructed in this high dimensional feature space. Thus, SVM is a linear classifier in the parameter space, but it becomes a nonlinear classifier as a result of the nonlinear mapping of the space of the input patterns into the high dimensional feature space. Let m dimensional training data be Xi(i= 1, . . . ,M) and their class labels be Yi, where Yi = 1 and Yi =-1 for classes 1 and 2, respectively. If these input data are linearly separable in the feature space, then the following decision function can be determined:
D(x)= wt g(x)+ b where g(x) is the mapping function that maps x into the l-dimensional space, w is the l-dimensional vector and b is a scalar. To separate data linearly, the decision function satisfies the following condition:
𝑌
𝑖𝑤
𝑡𝑔 𝑥 + 𝑏 > 1
for i = 1, . . . ,M.
(13) If the problem is linearly separable in the feature space, there are an infinite number of decision functions. Among them the hyperplane that has the largest margin between two classes is required. The margin is the minimum distance from the separating hyper plane to the input data and this is given by ||D(x) ||/||w||. Then we call the separating hyper plane with the maximum margin optimal separating hyper plane. Assuming that the margin is q, the following condition needs to be satisfied: Yi D(xi)/w≥p i = 1, . . . ,M, minimizing ½ w wt .The optimal separating hyper plane is determined so that the maximization of the margin and the minimization of the training error are achieved. When p = 1, the SVM is called L1 soft margin SVM (L1-SVM), and when p = 2, L2 soft margin SVM (L2-SVM).
3.2.1
Learning
known, network results can be improved by the addition of more variables. Data may need different representation, for example if data has a very large value range, logarithms or other data transformations or conversions may be necessary.
4.
IMPLEMENTATION ISSUES
Knowledge discovery from text documents is a difficult task for a computer. The computers are not yet capable of reaching the same level as human beings. It is common that text documents are characterized with some keywords. The clustering or the classification is based on these keywords. Our approach is different; it is a multilevel one consisting of word, sentence and paragraph level considerations. In our approach the search, the comparison and the classification are also based on a considerable number of keywords. However, these keywords are extracted in an automatic way and they are combined to “typical” sentences and paragraphs. The keywords are learnt in unsupervised way from the given documents. This is a big advantage compared with the traditional methods. The competitive learning based neural networks make this progress possible. Neural networks make it also possible to adapt the proposed solution to different user groups or applications fields. The smart word encoding and the statistical nature of the competitive learning based neural networks make our approach also language independent. This is a clear advantage. The relations between the words and the sentences make it possible to cluster paragraphs and documents. The search, the comparison, and the classification are based on one desirable document. The similar ones, the instances, or the groupings are returned. This is the reason why we claim that our technology does knowledge recovery from text documents. The size of the word map, vocabulary WN, is chosen by the needs of the user group. However, it is not necessary that the size of the vocabulary WN in the proposed approach is as large as in conventional histogram based classification cases. The same procedure is also used to find the size of the sentence map SN and the size of the paragraph map. One should, however, observe that it is useful to assume the following relation. This is a strong assumption. The classification in our approach is based on the distribution of histograms. The procedure is one form of vector quantization. The fact that there may appear words in the text that are not included in dictionary is a big advantage to the proposed approach. In many fields the development is rapid and new terms are often introduced. The encoding, the unsupervised way to create the prototypes and the classification based on the distance metrics makes it possible to consider new words easily. The methodology makes also the proposed approach almost independent of language. However, the word encoding is crucial to the success of the whole process. It is very important that the encoding and the rest of method have a high degree of compatibility. The encoding depends on the problem. It should be checked or selected for each specific case. The word histograms and the paragraph histograms are first extracted from the Government orders by using the concept of Knowledge maps. The histograms are shown in Fig. 7 and Fig. 9. The validation of the results is discussed next. Given the contingency table for
category Ci from the category space {C1, … , Cm} in Table 1, one can define these indices accordingly.
\ Table 1. Contingency table
4.1
Recall
𝑟𝑒𝑐𝑎𝑙𝑙 = 𝑅𝑒
𝑖=
𝑇𝑃𝑖𝑇𝑃𝑖 + 𝐹𝑁𝑖
(14)
4.1.1
Micro-average recall
The overall recall of the category space is obtained from the overall number of documents correctly accept and wrongly rejected
𝑅
𝑒𝑈=
𝑚𝑖=1 𝑇𝑃𝑖𝑇𝑃𝑖 + 𝐹𝑁𝑖 𝑚
𝑖=1
(15)
4.1.2
Macro-average recall
The overall recall of the category space is computed by averaging the recall for all the categories in the category space.
𝑅
𝑒𝑀=
𝑅𝑒𝑖𝑚 𝑖=1
𝑚
(16)
4.2
Precision
𝑝𝑟𝑒𝑐𝑖𝑠𝑖𝑜𝑛 = 𝑃𝑟
𝑖=
𝑇𝑃𝑖𝑇𝑃𝑖 + 𝐹𝑃𝑖
(17)
4.2.1
Micro-average precision
The overall precision of the category space is obtained from the overall number of documents correctly accept and wrongly accept
By exercising above indices, one can evaluate the performance of the proposed text categorization system, and compare it with other systems.
Category Ci Expert judgments
YES NO
Classifier YES TPi FPi
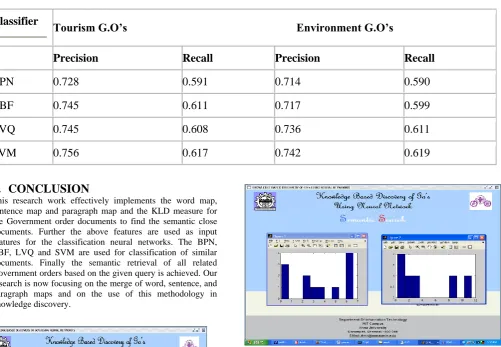
Table 2. Performance analysis for 2 sample category of G.O’s
Classifier
Tourism G.O’s Environment G.O’s
Precision
Recall
Precision
Recall
BPN
0.728
0.591
0.714
0.590
RBF
0.745
0.611
0.717
0.599
LVQ
0.745
0.608
0.736
0.611
SVM
0.756
0.617
0.742
0.619
5.
CONCLUSION
This research work effectively implements the word map, sentence map and paragraph map and the KLD measure for the Government order documents to find the semantic close documents. Further the above features are used as input features for the classification neural networks. The BPN, RBF, LVQ and SVM are used for classification of similar documents. Finally the semantic retrieval of all related Government orders based on the given query is achieved. Our research is now focusing on the merge of word, sentence, and paragraph maps and on the use of this methodology in knowledge discovery.
Fig 6: Plot to show the learning trial of the BPN for a query data with word map and KLD measure
[image:6.595.292.551.115.451.2]Fig 7: Plot to show the word map and sentence map during the training procedure of Government orders using knowledge maps.
[image:6.595.45.273.427.625.2] [image:6.595.305.557.523.678.2]Fig 9: Plot to show the word histogram by using Histogram Knowledge maps.
Fig 10: Plot to show F measure versus Training set size for RBF, LVQ and SVM.
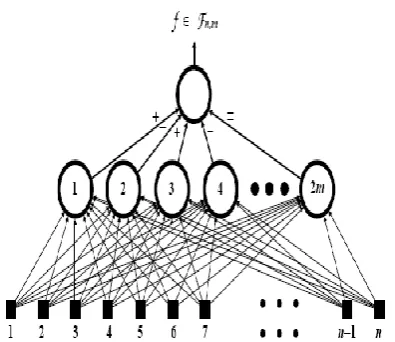
APPENDIX A
Proof: Learning From Examples
Any set of k functions of n variables specified by m examples can be computed by a neural network with ±1 weights having
sizekf*(n,m,∆) = o(m*(n+k)/ ∆) and . depthkf*(n,m,∆) = o(lg(mn)/lg(∆))
and occupying an area of: Akf*(n,m,∆) = o(m(n+k))
for all the values of the fan-in (∆) in the range 2 to n. The construction is
M TGs of n variables in the first layer (atmost); as . . they are MAJORITY gates of n inputs
(AND- equivalent gates)
K TGs of m/2 variables in the second layer which are . MAJORITY gates of m/2 inputs
(OR- equivalent gates) We can compute:
depthkf*(n,m,∆) = [lgn/lg∆] + [lgm/lg∆] = . . O(lg(mn)/lg(∆)) A.1 sizekf*(n,m,∆) = m[n-1/∆-1] + k[m-1/∆-1] = . . O(m/∆(n+k)) A.2 and occupying:
Akf*(n,m,∆) = m∆ [n-1/∆-1] + k∆ [m-1/∆-1] . = O(m(n+k)) A.3 concluding the proof.
6.
REFERENCES
[1] Miller, K.-R., Mika, S., Ratsch, G., Tsuda, K. and Scholkopf, B. 2001. An Introduction to Kernel-Based Learning Algorithms. IEEE Transactions on neural Networks, Vol 12, No. 2.
[2] Kohonen, T. 1982. Self-Organized formation of topologically correct feature maps. Biological Cybernetics, Vol 43, 59–69.
[3] Kohonen, T., Kaski, S., Lagus, K. and Honkela, T. 1996. Very Large Two-Level SOM for Browsing of Newsgroups”. In Proc. of ICANN’96 International Conference on Artificial Neural Networks, 269-274. [4] Kohonen, T. 1982. Self-Organized formation of
topologically correct feature maps. Biological cybernetics, 43:59-69.
[5] Kumar, V. S., McCalla, G.I. and Greer, J. E. 1999. Helping the peer helper. In Proceedings of the International Conference on AI in Education, 325–332. [6] Landauer, T. K. and Dumais, S. T. 1997. A solution to
Plato’s problem: The Latent Semantic analysis theory of acquisition, induction and representation of knowledge. Psychological Review, 104:211-240.
[image:7.595.63.261.541.712.2][8] Del-Brio, M. B. and Serrano-Cinca, C. 1995. Self-Organizing Neural Networks: The Financial state of Spanish Companies. In A.Refenes, editor, Neural Networks in the Capital Markets. John Wiley and sons, New York
[9] Del-Brio, M. B. and Serrano-Cinca, C. 1993. Self-Organizing Neural Networks for the Analysis and Representation of Data: Some Financial Cases. Neural Computing and Applications, 1(3):193-206.
[10]M.N. Do, Vetterli, M. 2002. Wavelet based texture retrieval using Generalized Gaussian Density and Kullback-Leibler Distance, IEEE Transactions on Image Processing, Vol 11, No 2.
[11]Magnussen, R. and Misfeldt, M. 2004. Player transformation of educational multiplayer games. In Jonas Heide Smith and Miguel Sicart, editors. Proceedings of the Other Players Conference, Copenhagen, Denmark, IT University of Copenhagen. [12]Scholtes J. C. 1991. Unsupervised Learning and the
information retrieval problem. In Proc. of IJCNN’91, Int.Joint Conference on Neural Networks, Volume I, 95-100,.
[13]Ultsch A. 1992. Knowledge Acquisition with Self-Organizing Neural Networks. In I.Aleksander and J.Taylor, editors, Artificial Neural Networks, 2, Volume I, Amsterdam, Netherlands, North-Holland, 735-738. [14]Back, B., Toivonen, J., Vanharanta, H, Visa, A. 2001.
Comparing numerical data and text information from annual reports using self-organizing maps. International
Journal of Accounting Information Systems, Volume 2, Issue 4, 249–269
[15]Landauer, T. K., Laham, D., Render, R., and Schreiner, M. E. 1972. How well can Passage Meaning be derived without using word order? In A comparison of the 19th annual conference of the cognitive science society, Mahwah, NJ, 1997, Sparck Jones, 412–417.
[16]Marvin, S., and Scott, S. 1999. Feature engineering for text classification. In Proceedings of international conference on machine learning.
[17] Salton, G., A. Wong and C.S. Yang. 1975. A vector space model for automatic indexing. Communications of the ACM, 18 (11), 613–620
[18]Vapnik, V. 1995. The Nature of Statistical Learning Theory. New-York: Springer-Verlag.
[19]Scholkopf, B., K. Sung, Burges, C., Girosi, F., Niyogi, P., Poggio, T. and Vapnik, V. 1997. Comparing support vector machines with gaussian kernels to radial basis function classifiers. IEEE Trans. Sign. Processing, 45:2758 – 2765.
[20] Suykens, J. A. K. and Vandewalle, J. 1999. Least squares support vector machine classifiers. Neural Processing Letters, 9(3):293-300.