http://dx.doi.org/10.4236/aim.2014.414111
The Use of Macroarray as a Simple Tool
to Follow the Metabolic Profile of
Lactobacillus plantarum during
Fermentation
Minna Kahala
1, Virpi Ahola
2, Elina Mäkimattila
1, Lars Paulin
3, Vesa Joutsjoki
11
Biotechnology and Food Research, MTT Agrifood Research Finland, Jokioinen, Finland
2Department of Biosciences, University of Helsinki, Helsinki, Finland
3
Institute of Biotechnology, University of Helsinki, Helsinki, Finland
Email: [email protected]
Received 25 June 2014; revised 11 July 2014; accepted 16 August 2014
Copyright © 2014 by authors and Scientific Research Publishing Inc.
This work is licensed under the Creative Commons Attribution International License (CC BY).
http://creativecommons.org/licenses/by/4.0/
Abstract
This study focused on defining the differences in L. plantarum gene expression levels in different
media and in different growth phases using an easy and cost-efficient monitoring of gene expres-
sion. A macroarray based on a group of selected L. plantarum genes, 178 genes belonging to 18
main groups, printed onto a nitrocellulose filter was designed in this work. Using the macrofilters
designed, the expression of a selected set of L. plantarum genes was assayed in synthetic MRS me-
dium and in extracted carrot juice. To compare the potential differences of starter gene expres-
sion in hygienic and contaminated cultivation media, the L. plantarum strain was cultivated in
both sterile and contaminated (yeast and Escherichia coli) MRS and carrot juice. The number of
genes found to be regulated as a function of growth was clearly higher in MRS-based growth me-
dium than in carrot juice, In carrot juice, expression of the gene encoding malolactic enzyme
(MLE), which makes L. plantarum an advantageous microbe in e.g. wine making, was found to be
upregulated in logarithmic phase of growth. The current study demonstrated that macroarrays
printed on nitrocellulose filters with simple robotic systems can be analyzed by standard labora-
tory equipment and methods usually available in molecular laboratories. Using this technology,
rapid and cost-efficient analysis of genome function of L. plantarum can be carried out e.g. in
de-veloping regions, where lactic acid fermentation of food and feed matrices is a common practice.
Keywords
1. Introduction
Lactic acid bacteria (LAB) are widely used for the preservation of food and feed raw materials and to intensify
the flavour and texture of fermented products. Of the lactobacilli commonly used in food processes,
Lactobacil-
lus plantarum
is important in the production of many fermented foods of both plant (pickled vegetables, silage,
sourdough) and animal (dry ferment sausages, fermented fish, cheese) origin
[1]
. This versatility and ecological
flexibility is most likely associated with the genome size of
L. plantarum
, which is one of the largest known
among LAB
[2]
. Based on complete genome sequencing,
L. plantarum
has a capacity to use a large variety of
carbon sources and encompasses a relatively high number of regulatory functions concentrated within a defined
genomic region, which was designated the lifestyle adaptation region
[3]
. These genomic features exhibit an ef-
ficient adaptation capacity of
L. plantarum
to versatile environmental conditions.
Due to the ability to maintain pH homeostasis at low external pH,
L. plantarum
is tolerant to acidic environ-
ment and often becomes the dominant LAB at the end of spontaneous vegetable fermentation
[4]
. Therefore, this
species is common in vegetable and silage fermentations. Yet, spontaneous fermentation is generally poorly con-
trolled and unstable, and the quality of products varies depending on fermented material and inherent microbiota.
Spontaneously fermented vegetables may also contain among other things biogenic amines, which have been asso-
ciated with certain toxicological characteristics and outbreaks of food poisoning. The formation of biogenic amines
has been repressed by the use of a pure
L. plantarum
starter instead of spontaneous fermentation
[5]
. For the above
reasons, well-characterized starter cultures with desirable properties would be of particular importance.
Previously, the technological properties of potential starter LAB could be determined almost exclusively in
pilot- and full-scale food and feed production experiments. Today, the development of molecular techniques has
made possible the exploitation of genomic and proteomic data for the observation of potential genotypic and
phenotypic differences between individual strains in specific growth conditions. Studies based on
L. plantarum
DNA-microarrays
[6]
, proteomic patterns
[7]-[10]
and sequencing technologies, like metagenomic sequencing
and RNAseq
[11]-[13]
and transcriptional profiling
[14]-[17]
have been carried out to elucidate strain-specific
differences in genome composition and adaptation to various growth conditions.
Both microarray and proteomic studies require specific laboratory facilities and expertise, which may not be
available in all research laboratories. Yet,
L. plantarum
is used worldwide for food and feed fermentations and
there is a growing demand for the design of starter cultures with well-characterized technological properties. For
easy and cost-efficient monitoring of gene expression in
L. plantarum
, a macroarray based on a group of se-
lected
L. plantarum
genes printed onto a nitrocellulose filter was designed in this work. Using the macrofilters
designed, the expression of a selected set of
L. plantarum
genes was assayed in synthetic MRS medium and in
extracted carrot juice. To compare the potential differences of starter gene expression in hygienic and contami-
nated cultivation media, the studied
L. plantarum
strain was cultivated in both sterile and contaminated (yeast
and
Escherichia coli
) MRS and carrot juice.
2. Materials and Methods
2.1. Bacterial Strains and Growth Conditions
L. plantarum
strain MLBPL1 has been isolated from sauerkraut
[18] [19]
. The strain was routinely grown in mi-
croaerophilic conditions at 32˚C and maintained in MRS broth (Difco, BD, Franklin Lakes, NJ, USA). For plat-
ing, MRS was solidified with 1.5% agar.
E. coli
DH5
α
, carrying the plasmid vector pBluescript, was grown in
Luria Bertani broth supplemented with ampicillin (50 µg/ml) as a selective agent at 37˚C 200 rpm. For con-
tamination cultivations, a yeast and an
E. coli
strain originating from spoiled vegetables were propagated in
YGC broth
at 30˚C and in Luria Bertani broth at 37˚C, respectively.
For macroarray analyses,
L. plantarum
strain MLBPL1 was grown in synthetic medium MRS and carrot juice.
To simulate contaminated growth conditions, the spoiling
E. coli
and yeast strains were inoculated into MRS
and carrot juice.
Cultivations were performed using Spectra/Por Float-A-Lyzer dialysis tube (MWCO 100 kDa,
Spectrum Laboratories, Rancho Dominguez, CA, USA) in order to make it easier to separate the
L. plantarum
cells, the vegetable matrix and the spoiling strains of yeast and
E. coli
. By using the dialysis tube, no filtering of
plant material was needed and in addition, the cells of contaminating strains didn’t interfere with the extraction
of RNA. Carrot juice was prepared from fresh vegetables with a juice extractor. The extracted juice was centri-
fuged at 18,500 g for 40 min and pasteurized in a water bath at 95
˚C for 30 min.
carrot juice. For MRS cultivation, a 1% inoculumn was used. For carrot juice cultivation and contamination cul-
tivations, the inoculumn was centrifuged at 13,000 g for 3 min and the pellet was suspended into centrifuged
(18,500 g for 40 min) and filter-sterilized (0.8/0.2 µm pore sizes) carrot juice (carrot cultivations) or MRS broth
(MRS contamination cultivation), after which the suspension was transferred to a Spectra/Por Float-A-Lyzer dia-
lysis tube. The tube was then transferred to a bottle containing carrot juice, contaminated MRS broth or con-
taminated carrot juice. In contamination cultivations, MRS broth and carrot juice were contaminated by inocu-
lating them with 1%
E. coli
and yeast.
The cultivations were performed at 32˚C. The growth was determined by
plating onto MRS agar plates appropriate dilutions from the samples taken during the growth. The plates were
incubated at 32˚C for 48 h, until single bacterial colonies appeared.
2.2. Extraction and Labeling of RNA
Bacterial cells of the
L. plantarum
strain MLBPL1 grown in MRS broth and carrot juice were harvested at ex-
ponential (6 h) and stationary phase (14
h) of growth by centrifugation for 3 min at 4˚C at 11,000 g. The col-
lected cells were frozen immediately in liquid nitrogen and stored at
−70˚C. Extraction of total RNA was carried
out with SV total RNA isolation system (Promega, Madison, WI, USA) with some modifications to the protocol
on the disruption of the cells. Briefly, bacterial cells thawed slowly on ice were first washed with sterile water
treated with diethyl pyrocarbonate (DEPC) and collected by centrifugation. Next, the pellet was resuspended
into 225 µl of SV RNA lysis buffer of the Promega kit and transferred to an eppendorf tube containing 100 µl of
nitric acid-washed glass beads. The cells were disrupted with glass beads in a cell homogenizer as described be-
fore (Kahala,
et al.
, 2008). After that, the lysate was transferred to a new tube and 350 µl of SV RNA dilution
buffer of the Promega kit was added per 175 µl of lysate. From this step on, the extraction was carried on as
recommended by the manufacturer. Two technical duplicates from the RNA extraction on each culture medium
and harvesting point were made. mRNA was enriched from total RNA samples by removing the 16S and 23S
rRNAs with MICROB Express Bacterial mRNA Purification kit (Ambion, Austin, TX, USA) according to the
instructions of the manufacturer. The RNA concentration was determined spectrophotometrically at 260 nm.
The integrity of the isolated prokaryotic RNA was determined by total RNA gel electrophoresis and Northern
blot carried out as described by
[20]
. Total RNA samples, denatured with glyoxal and dimethylsulphoxide, were
separated by size in a 1.0% (w/v) agarose gel in 10 mM sodium phosphate buffer, pH 6.5 followed by a transfer
to a positively charged nylon membrane (Roche) and hybridization with a
ldhD
-specific 736 bp probe, amplified
with primer pair 5’-AAGTTAGCCGACGAAGGG-3’ and 5’-CCATGTTGTGAACGGCAG-3’ targeted to
L.
plantarum
strain D90339.1. The probe was labelled with digoxigenin-dUTP according to the instructions of the
manufacturer (Roche). Luminescent DIG detection kit (Roche) was used for hybrid detection. To detect the po-
tential residual chromosomal DNA in the isolated mRNA sample, primers 5’-AAGTTAGCCGACGAAGGG-3’
and 5’-GGGCGTATAATTCGTCCAAA-3’ designed to produce a 403 bp fragment from the target
ldhD
gene
of
L. plantarum
strain D90339.1 were used. PCR-procedure using Dynazyme II DNA polymerase (Finnzymes,
Espoo, Finland) was carried out in the reaction conditions recommended by the enzyme manufacturer.
cDNA was synthesized by RT from DNA-free mRNA and cDNA labelling was performed with an alkalilabile
digoxigenin-11-dUTP (DIG) (Roche, Basel, Switzerland) in a reverse transcription reaction with Im-Prom-II
Reverse Transcription System kit (Promega) as follows: 1 µg of mRNA was mixed with 0.5 µg of random
hexamer primers provided by the kit manufacturer. The mixture was heated at 70˚C for 5 min and chilled on ice
for 5 min. cDNA synthesis was carried out by combining RNA-primer mixture with 1 × ImProm-II reaction
buffer, 5 mM MgCl
2, 0.5 mM dATP, 0.5 mM dGTP, 0.5 mM dCTP, 0.325 mM dTTP, 0.175 mM DIG-11-
dUTP, 1 U/µl RNasin Ribonuclease Inhibitor, and 1 µl ImProm-II Reverse Transcriptase. Annealing was per-
formed at 25˚C for 5 min, followed by extension at 43˚C for 1h and enzyme inactivation at 70˚C for 15 min. The
labeled cDNA was purified with Microarray Target Purification kit (Roche) according to the instructions of the
manufacturer.
2.3. PCR and Labeling of the Positive Control for Macroarray
rial lysate of the
E. coli
strain DH5
α
, harbouring the recombinant pBluescript-HbGAM plasmid to be used as a
template for PCR, was obtained by disrupting the cells with glass beads. To amplify the HbGAM gene, the pri-
mer pair 5’-GTAAAACGACGGCCAG-3’ and 5’-CAGGAAACAGCTATGAC-3’ targeting the plasmid was
used. The amplified PCR product was purified with Wizard
®SV Gel and PCR Clean-Up System (Promega) and
labelled with DIG-11-dUTP using DIG-High Prime labeling kit (Roche).
2.4. Amplification of L. plantarum MLBPL1 Genes and Macroarray Printing
Primers were designed for the amplification of selected genes from the fully sequenced genome of
L. plantarum
WCFS1
[3]
. The gene list and designed primers are listed in
Supplement 1
. To enable an easy re-amplification
of the PCR-products, universal nucleotide sequences were added to the 5’ termini of the specific forward and
reverse primers. A nucleotide sequence 5’ CCGCTGCTAGGCGCGCCGTG was added to the forward primers
and, respectively, a nucleotide sequence 5’ GCAGGGATGCGGCCGCTGAC was added to the reverse primers.
Amplification of the selected genes was done as described for the positive control for macroarray. For the PCR
reaction, a 10 pmol primer concentration and 20 ng of corresponding genomic template DNA were used in a 100
µl reaction volume in a 96 well PCR plate. The success of the PCR amplification was checked by analyzing 5 µl
from the reactions on a 1% agarose gel. The obtained PCR products were purified using Montage PCR Purifica-
tion 96 Well Plates (Millipore).
PCR fragments in the 96 well plates were transferred to 384 plates for printing on the nitrocellulose macroar-
ray (
Supplement 2
). Purified PCR fragments were gridded in duplicate on nitrocellulose membranes with a
QPix automated colony picker (Genetix Ltd., UK) using a 384-pin gridding head as described in
[22]
.
2.5. Hybridization and Detection
Macroarrays were prehybridized for 2 h at 60˚C with 20 ml of DIG Easy Hyb buffer (Roche). Hybridizations
were performed overnight at 60˚C with 6 ml DIG Easy Hyb buffer (Roche) containing 5 µl of labeled cDNA
probe and HbGAM which was used as a positive control in hybridization reactions. After hybridization,
macroarrays were washed twice at room temperature for 5 min with washing solution containing 2 × SSC (1 ×
SSC is 0.15 M NaCl and 15 mM sodium citrate) and 0.1
% sodium dodecyl sulphate (SDS) and twice at 68˚C
for 15 min with washing solution (0.1 × SSC, 0.1% SDS). Hybridized spots were detected with chemilumi-
nesence-based DIG detection kit (Roche) using CDP-Star (Roche) as a substrate and chemiluminescence
produced was detected by FluorChem (Alpha Innotech Corp., San Leandro, CA) gel image system. For re-
probing, the DIG-labelled probe was removed with a following procedure. The membrane was rinsed thor-
oughly in sterile water, washed twice with 0.2 M NaOH containing 0.1
% SDS at 37˚C for 20 min and rinsed
with 2 × SSC for 5 min.
2.6. Statistical Methods
The DNA probes spotted on the macroarray were selected using results from the previous proteomics results us-
ing 2-DE and HPLC-ESI-MS/MS
[8]
. Additionally, computationally predicted expression values were used for
choosing the remaining probes. Codon usage differences (codon bias) were used for predicting gene expression
levels for all 3009 genes of
L. plantarum
(C)
[3]
, and the set of 63 genes encoding ribosomal proteins (RB).
Codon bias for a gene
g
with respect to gene set
G
was calculated by the formula
( )
( )
(
) (
)
( , ,)
, ,
, ,
a x y z a
B g G
pa g
f x y z
g x y z
=
=
−
∑
∑
(1)
where
f
(
x
,
y
,
z
) denotes a normalized frequency of the codon triplet (
x
,
y
,
z
) coding for an amino acid
a
in a gene
g
,
g
(
x
,
y
,
z
) denotes
the frequency of the codon triplet (
x
,
y
,
z
) in the gene set
G
,
and
p
a(
g
)
is the fraction of the amino
acid
a
in the gene
g
[23]
.
The gene
g
was predicted as highly expressed if the relative codon bias
( )
(
)
B g C
RCB
B g RB
=
(2)
tion to those identified by the HPLC-ESI-MS/MS.
After scanning of the macroarray images, the quantification of the hybridized signals and background sub-
traction were done by the TIGR Spotfinder image processing software
[24]
. After quantification and background
correction, the signals were normalized using median array intensities. Finally, the expression levels for each
gene and sample was obtained by taking median of the normalized intensity values across the two replicates of
each sample. Gene expression levels were compared between MRS, carrot juice and contaminated versions of
the growth media in exponential (6 h) and stationary (14 h) growth phases. The pair-wise comparisons were
made using fold changes, ratios of the mean expression levels. Fold changes greater than two are reported in the
results. All genes in the array were grouped into functional groups according to their main roles. Gene set
enrichment analysis was made for the gene sets with fold change greater than two in order to test whether any
functional group is overrepresented among the differentially expressed genes between two growth media. Ana-
lyses were made using SAS
®(SAS for Windows 9.1).
3. Results
Growth rate of
L. plantarum
MLBPL1 cells was similar in MRS and carrot juice (
Figure 1
).
Integrity and purity
of the isolated RNA were demonstrated by Northern blot and PCR of the
ldhD
gene (data not shown).
The macroarray included 178 genes belonging to 18 main groups. The largest groups were energy metabolism
(59 genes), protein synthesis (30 genes), protein fate (10 genes), regulatory functions (10 genes), cell envelope
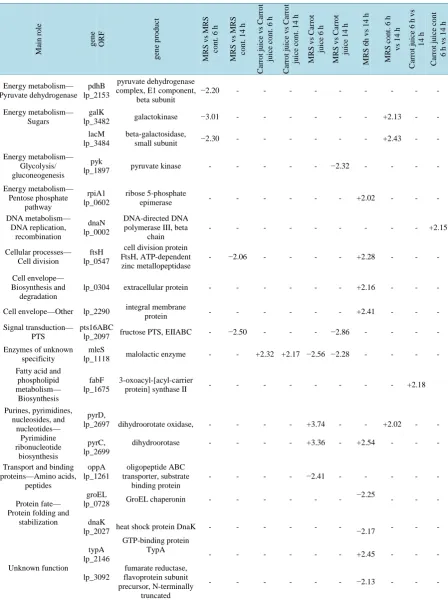
(9 genes) and DNA metabolism (9 genes). Of the 178 genes tested, 18 (10%) showed a mean fold change
greater than 2.0 in at least one of the ten comparisons between growth media or growth phases (
Table 1
). The
most frequent functions included were energy metabolism, cell envelope, protein fate and nucleotide meta-
bolism.
3.1. Expression Levels of the Genes as a Function of Growth
The majority of the genes studied on the membranes showed no significant change in levels of expression during
the growth or between the growth media.
The number of the genes found to be regulated as a function of growth
was clearly higher in MRS-based growth medium than in carrot juice, in which only genes involved in fatty acid
and phospholipid metabolism showed differential expression in different growth phases. The function of the
genes showing upregulation in logarithmic phase in MRS medium was mostly related to energy metabolism, but
also to cell division, cell envelope biosynthesis and pyrimidine ribonucleotide biosynthesis. Generation of suffi-
cient energy for growth in logarithmic phase is important and was evidenced in the MRS based medium.
[image:5.595.200.426.578.701.2]In MRS cultivation, when entering in the stationary phase of growth, transcription of genes involved in energy
metabolic pathways decreased and higher expression levels were found for genes involved in protein fate, pro-
tein folding and stabilization, like “folding” chaperones DnaK and GroEL. In contaminated MRS medium, es-
pecially the expression levels of genes involved in sugar metabolism pathways (
galK
,
lacM
) were found to be
higher in logarithmic phase. This reflects higher demand for energy in the logarithmic phase and probably
competition between the
Lactobacillus
and contaminating strains in the utilization of sugars that are needed
for growth.
Figure 1. Growth of L. plantarum MLBPL1 in two growth media.
1.0E+06 1.0E+07 1.0E+08 1.0E+09 1.0E+10
0 5 10 15 20 25
CF
U
/m
l
time/h
Table 1. Genes and their main roles showing mean fold change > 2.0 in ten comparisons among growth media and two growth phases. Minus and plus signs show which of the compared groups has higher expression: +: shows higher expression in the first; −: in the second group.
Ma in r o le g en e OR F g en e p ro d u ct M RS v s M RS co n t. 6 h M RS v s M RS co n t. 1 4 h C arro t j u ic e v s C arro t ju ic e c o n t. 6 h C arro t j u ic e v s C arro t ju ic e c o n t. 1 4 h M RS v s Ca rr o t ju ic e 6 h M RS v s Ca rr o t ju ic e 1 4 h M R S 6 h v s 1 4 h MR S c o n t. 6 h v s 1 4 h C ar rot j ui ce 6 h v s 1 4 h C arro t ju ic e co n t 6 h v s 1 4 h Energy metabolism— Pyruvate dehydrogenase pdhB lp_2153 pyruvate dehydrogenase complex, E1 component,
beta subunit
−2.20 - - - -
Energy metabolism— Sugars
galK
lp_3482 galactokinase −3.01 - - - +2.13 - -
lacM lp_3484
beta-galactosidase,
small subunit −2.30 - - - +2.43 - -
Energy metabolism— Glycolysis/ gluconeogenesis
pyk
lp_1897 pyruvate kinase - - - −2.32 - - - -
Energy metabolism— Pentose phosphate pathway rpiA1 lp_0602 ribose 5-phosphate
epimerase - - - +2.02 - - -
DNA metabolism— DNA replication, recombination dnaN lp_0002 DNA-directed DNA polymerase III, beta
chain
- - - +2.15
Cellular processes— Cell division
ftsH lp_0547
cell division protein FtsH, ATP-dependent zinc metallopeptidase
- −2.06 - - - - +2.28 - - -
Cell envelope— Biosynthesis and
degradation
lp_0304 extracellular protein - - - +2.16 - - -
Cell envelope—Other lp_2290 integral membrane
protein - - - +2.41 - - -
Signal transduction— PTS
pts16ABC
lp_2097 fructose PTS, EIIABC - −2.50 - - - −2.86 - - - -
Enzymes of unknown specificity
mleS
lp_1118 malolactic enzyme - - +2.32 +2.17 −2.56 −2.28 - - - - Fatty acid and
phospholipid metabolism— Biosynthesis fabF lp_1675 3-oxoacyl-[acyl-carrier
protein] synthase II - - - +2.18
Purines, pyrimidines, nucleosides, and nucleotides— Pyrimidine ribonucleotide biosynthesis pyrD, lp_2697 pyrC, lp_2699 dihydroorotate oxidase, dihydroorotase - - - - - - - - +3.74 +3.36 - - - +2.54 +2.02 - - - - -
Transport and binding proteins—Amino acids, peptides oppA lp_1261 oligopeptide ABC transporter, substrate binding protein
- - - - −2.41 - - - - -
Protein fate— Protein folding and
stabilization groEL lp_0728 dnaK lp_2027 GroEL chaperonin
3.2. Expression Levels of the Genes between Different Growth Media
The mRNA level of several genes was shown to be regulated in response to different growth media. At the ex-
ponential (6 h) phase of growth, the genes encoding dihydroorotate oxidase and dihydroorotase enzymes were
differentially expressed in MRS and carrot juice. They showed 3.7- and 3.4-fold higher expression in the MRS
compared to carrot juice growth medium, respectively (
Table 1
). Differential expression (p = 0.015) of these
genes encoding proteins involved in pyrimidine ribonucleotide biosynthesis is an indication of distinct gene reg-
ulation and, consequently, potentially different rate of pyrimidine biosynthesis in synthetic MRS compared to
vegetable-based carrot juice cultivation medium.
Expression of malolactic enzyme (mle) gene was clearly higher in logarithmic phase when grown in plant
based medium. Upregulation of cell division protein FtsH was observed in contaminated MRS 14 h compared to
MRS 14 h, probably indicating higher stress response in contaminated MRS.
4. Discussion
This study focused on defining the differences in
L. plantarum
gene expression levels in different media and in
different growth phases by the use of a simple and low-cost macroarray technique. Previously described DNA
macroarray technique
[22]
has been further developed for studying gene expression profile of the industrially
important lactic acid bacterium.
Fermentation conditions may dramatically affect functional characteristics of LAB
[13]
. Marked changes in
expression levels upon entry in the stationary phase have been found out
[25] [26]
. Highly expressed genes are
turned off or markedly repressed and genes, mostly inactive in the growing cells, begin to be expressed in the
stationary phase
[25] [26]
. In this study, transcription of genes involved in energy metabolic pathways decreased
in stationary phase and higher expression levels were found for genes like “folding” chaperones
DnaK
and
GroEL
.
GroEL
basal expression is enhanced by environmental stress, including elevated temperature, oxygen
limitation, and nutrient deprivation
[27] [28]
. DnaK plays a central role in protein folding, refolding, transloca-
tion and in the stress conditions. The elevated expression of these genes is probably a response to the diminish-
ing nutrients and high concentration of lactic acid in the medium which is known to cause stress especially in the
late-stationary phase
[29]
.
Proteomic studies by
[10]
has revealed significant changes on fermentation profiles of
L. plantarum
strains
previously grown under food-like conditions compared to cultivation in MRS broth. In our study, expression of
a malolactic enzyme (mle) gene in plant-based medium was found to be upregulated in logarithmic phase of
growth. Mle enzymes, involved in decarboxylation of L-malic acid to L-lactic acid and CO
2[30]
, have been pu-
rified from several lactic acid bacteria, including
Leuconostoc
mesenteroides
,
L. plantarum
, and
Leuconostoc
oenos [31]
. In several studies,
L. plantarum
has been shown to have malolactic activity and therefore is of inter-
est in wine production
[32]
. The significance of malolactic activity of LAB in sauerkraut fermentation has also
been reported. Conversion of malic acid into lactic acid before significant sugar metabolism may play some role
in early fermentation
[30] [33]
.
Higher expression of cell division protein FtsH in contaminated MRS compared to MRS probably indicated
higher stress response in contaminated MRS. Functional studies have revealed an important role for FtsH in the
bacterial stress response. In several bacteria, including
E. coli
,
B. subtilis
,
Lactococcus lactis
,
O. oeni
,
Helico-
bacter pylori
, and
L. plantarum
,
ftsH
expression is induced in response to heat and other stress factors controlled
by additional regulators
[34]
.
Macroarray was found to be an applicable method for studying expression of defined genes of
L. plantarum
during fermentation. Macroarray technology has been successfully applied also e.g. for the detection of patho-
gens in chicken samples
[35]
and studies on environmental samples for the presence of specific antibiotic resis-
tance genes
[36]
communities of diazotrophs
[37]
, and expression of 375 genes in
L. lactis
subsp.
lactis
IL1403
during stress conditions
[38]
.
nomic techniques have made
L. plantarum
one of the most studies food microbes. Modern DNA microarray
[6]
,
next-generation sequencing technologies
[39]
and especially transcriptomic studies are accurate and sensitive
and have enabled the detailed examination of
L. plantarum
genome structure and function. The most advanced
technologies, however, require specific instrumentation and have often high running costs, which may rule out
their use in many cases. The current study demonstrated that macroarrays printed on nitrocellulose filters with
simple robotic systems can be analyzed by standard laboratory equipment and methods usually available in mo-
lecular laboratories. Using this technology, rapid and cost-efficient analysis of genome function of
L. plantarum
can be carried out e.g. in developing regions, where lactic acid fermentation of food an feed matrices is a com-
mon practice, but research and analysis laboratories often lack the most expensive specific laboratory instru-
mentation.
Acknowledgements
Tekes, the Finnish Funding Agency for Technology and Innovation, is gratefully acknowledged for the financial
support of this work. The authors wish to thank Anneli Paloposki for the skilful technical assistance, Ari-Matti
Sarén for designing the primers, Markku Ala-Pantti and Hannu Väänänen for printing the membranes.
References
[1] Rose, A. (1982) History and Scientific Basis of Microbial Activity in Fermented Foods. In: Rose, A., Ed., Fermented Foods, Academic Press, New York, 1-13.
[2] Chevallier, B., Hubert, J.C. and Kammerer, B. (1994) Determination of Chromosome Size and Number of rrn Loci in Lactobacillus plantarum by Pulsed-Field Gel Electrophoresis. FEMS Microbiology Letters, 120, 51-56.
http://dx.doi.org/doi:10.1111/j.1574-6968.1994.tb07006.x
[3] Kleerebezem, M., Boekhorst, J., van Kranenburg, R., Molenaar, D., Kuipers, O.P., Leer, R., Tarchini, R., Peters, S.A., Sandbrink H.M., Fiers, M., Stiekema, W., Lankhorst, R., Bron, P., Hoffer, S., Groot, M., Kerkhoven, R., de Vries, M., Ursing, B., de Vos, W.M. and Siezen, R.J. (2003) Complete Genome Sequence of Lactobacillus plantarum WCFS1. Proceedings of the National Academy of Sciences of the United States of America, 100, 1990-1995.
http://dx.doi.org/10.1073/pnas.0337704100
[4] McDonald, L.C., Fleming, H.P. and Hassan, H.M. (1990) Acid Tolerance of Leuconostoc mesenteroides and Lactoba-cillus plantarum. Applied and Environmental Microbiology, 56, 2120-2124.
[5] Mäki, M. (2004) Lactic Acid Bacteria in Vegetable Fermentations. In: Salminen, S., von Wright, A. and Ouwehand, A., Eds., Lactic Acid Bacteria: Microbiological and Functional Aspects, 2nd Edition, Marcel Dekker, Inc., New York, 419-430. http://dx.doi.org/10.1201/9780824752033.ch14
[6] Molenaar, D., Bringel, F., Schuren, F.H., De Vos, W.M., Siezen, R.J. and Kleerebezem, M. (2005) Exploring Lactoba-cillus plantarum Genome Diversity by Using Microarrays. Journal of Bacteriology, 187, 6119-6127.
[7] Koistinen, K.M., Plumed-Ferrer, C., Lehesranta, S.J., Kärenlampi, S.O. and von Wright, A. (2007) Comparison of Growth-Phase-Dependent Cytosolic Proteomes of Two Lactobacillus plantarum Strains Used in Food and Feed Fer-mentations. FEMS Microbiology Letters, 273, 12-21. http://dx.doi.org/10.1111/j.1574-6968.2007.00775.x
[8] Plumed-Ferrer, C., Koistinen, K.M., Tolonen, T.L., Lehesranta, S.J., Kärenlampi, S.O., Mäkimattila, E., Joutsjoki, V., Virtanen, V. and von Wright, A. (2008) Comparative Study of Sugar Fermentation and Protein Expression Patterns of Two Lactobacillus plantarum Strains Grown in Three Different Media. Applied and Environmental Microbiology, 74, 5349-5358. http://dx.doi.org/10.1128/AEM.00324-08
[9] Di Cagno, R., Surico, R.F., Siragusa, S., De Angelis, M., Paradiso, A., Minervini, F., De Gara, L. and Gobbetti, M. (2008) Selection and Use of Autochthonous Mixed Starter for Lactic Acid Fermentation of Carrots, French Beans or Marrows. International Journal of Food Microbiology, 127, 220-228.
http://dx.doi.org/10.1016/j.ijfoodmicro.2008.07.010
[10] Siragusa, S., De Angelis, M., Calasso, M., Campanella, D., Minervini, F., Di Cagno, R. and Gobbetti, M. (2013) Fer-mentation and Proteome Profiles of Lactobacillus plantarum Strains during Growth under Food-Like Conditions. Jour- nal of Proteomics, 96, 366-380. http://dx.doi.org/10.1016/j.jprot.2013.11.003
[11] Stevens, M.J.A., Wiersma, A., de Vos, W.M., Kuipers, O.P., Smid, E.J., Molenaar, D. and Kleerebezem, M. (2008) Im- provement of Lactobacillus plantarum Aerobic Growth as Directed by Comprehensive Transcriptome Analysis. Ap-plied and Environmental Microbiology, 74, 4776-4778. http://dx.doi.org/10.1128/AEM.00136-08
Microbial Biotechnology, 4, 333-344. http://dx.doi.org/10.1111/j.1751-7915.2010.00217.x
[13] Bron, P.A., Wels, M., Bongers, R.S., de Veen, H., Wiersma, A., Overmars, L., Marco, M.L. and Kleerebezem, M. (2012) Transcriptomes Reveal Genetic Signatures Underlying Physiological Variations Imposed by Different Fermen-tation Conditions in Lactobacillus plantarum. PloS ONE, 7, e38720. http://dx.doi.org/10.1371/journal.pone.0038720
[14] Reverón, I., Rivas, B., Muñoz, R. and de Felipe, F.L. (2012) Genome-Wide Transcriptomic Responses of a Human Iso- late of Lactobacillus plantarum Exposed to p-Coumaric Acid Stress. Molecular Nutrition & Food Research, 56, 1848- 1859. http://dx.doi.org/10.1002/mnfr.201200384
[15] Todt, T.J., Wels, M., Bongers, R.S., Siezen, R.S., van Hijum, S.A.F.T. and Kleerebezem, M. (2012) Genome-Wide Prediction and Validation of Sigma70 Promoters in Lactobacillus plantarum WCFS1. PloS ONE, 7, e45097.
http://dx.doi.org/10.1371/journal.pone.0045097
[16] de Veen, H., Abee, T., Tempelaars, M., Bron, P.A., Kleerebezem, M. and Marco, M.L. (2011) Short- and Long-Term Adaptation to Ethanol Stress and Its Cross-Protective Consequences in Lactobacillus plantarum. Applied and Environ- mental Microbiology, 77, 5247-5256. http://dx.doi.org/10.1128/AEM.00515-11
[17] Wegkamp, A., Mars, A.E., Faijes, M., Molenaar, D., de Vos, R.C.H., Klaus, S.M.J., Hanson, A.D., de Vos, W.M. and Smid, E.J. (2010) Physiological Responses to Folate Overproduction in Lactobacillus plantarum WCFS1. Microbial Cell Factories, 9, 100. http://dx.doi.org/10.1186/1475-2859-9-100
[18] Tamminen, M., Mäki, M. and Joutsjoki, T. (2003) Differentiation of Lactobacilli Related to Lactobacillus plantarum from Naturally Fermented Cucumbers and White Cabbage. Applied Biotechnology, Food Science and Policy, 1, 125- 128.
[19] Tamminen, M., Joutsjoki, T., Sjöblom, M., Joutsen, M., Palva, A., Ryhänen, E.L. and Joutsjoki, V. (2004) Screening of Lactic Acid Bacteria from Fermented Vegetables by Carbohydrate Profiling and PCR-ELISA. Letters in Applied Mi-crobiology, 39, 439-444. http://dx.doi.org/10.1111/j.1472-765X.2004.01607.x
[20] Hames, B. and Higgins, S. (1985) Nucleic Acid Hybridization: A Practical Approach. IRL Press, Oxford.
[21] Raulo, E., Chernousov, M.A., Carey, D.J., Nolo, R. and Rauvala, H. (1994) Isolation of a Neuronal Cell Surface Re-ceptor of Heparin Binding Growth-Associated Molecule (HB-GAM). Identification as N-Syndecan (Syndecan-3). The Journal of Biological Chemistry, 269, 12999-13004.
[22] Hultman, J., Pitkäranta, M., Romantschuk, M., Auvinen, P. and Paulin, L. (2008) Probe-Based Negative Selection for Underrepresented Phylotypes in Large Environmental Clone Libraries. Journal of Microbiological Methods, 75, 457- 463. http://dx.doi.org/10.1016/j.mimet.2008.07.016
[23] Karlin, S. and Mrázek, J. (2000) Predicted Highly Expressed Genes of Diverse Prokaryotic Genomes. Journal of Bac-teriology, 182, 5238-5250. http://dx.doi.org/10.1128/JB.182.18.5238-5250.2000
[24] Saeed, A.I., Sharov, V., White, J., Li, J., Liang, W., Bhagabati, N., Braisted, J., Klapa, M., Currier, T., Thiagarajan, M., Sturn, A., Snuffin, M., Rezantsev, A., Popov, D., Ryltsov, A., Kostukovich, E., Borisovsky, I., Liu, Z., Vinsavich, A., Trush, V. and Quackenbush, J. (2003) TM4: A Free, Open-Source System for Microarray Data Management and Ana- lysis. BioTechniques, 34, 374-378. http://dx.doi.rg/12613259
[25] Ishihama, A. (1997) Adaptation of Gene Expression in Stationary Phase Bacteria. Current Opinion in Genetics and Development, 7, 582-588. http://dx.doi.org/10.1016/S0959-437X(97)80003-2
[26] Ishihama, A. (1999) Modulation of the Nucleoid, the Transcription Apparatus, and the Translation Machinery in Bac-teria for Stationary Phase Survival. Genes to Cells, 4, 135-143. http://dx.doi.org/10.1046/j.1365-2443.1999.00247.x
[27] Bergonzelli, G.E., Granato, D., Pridmore, R.D., Marvin-Guy, L.F., Donnicola, D. and Corthésy-Theulaz, I.E. (2006) GroEL of Lactobacillus johnsonii La1 (NCC 533) Is Cell Surface Associated: Potential Role in Interactions with the Host and the Gastric Pathogen Helicobacter pylori. Infection and Immunity, 74, 425-434.
http://dx.doi.org/10.1128/IAI.74.1.425-434.2006
[28] Lamberti, C., Mangiapane, E., Pessione, A., Mazzoli, R., Giunta, C. and Pessione, E. (2011) Proteomic Characteriza-tion of a Selenium-Metabolizing Probiotic Lactobacillus reuteri Lb2 BM for Nutraceutical Applications. Proteomics,
11, 2212-2221. http://dx.doi.org/10.1002/pmic.201000747
[29] Cohen, D.P.A., Renes, J., Bouwman, F.G., Zoetendal, E.G., Mariman, E., de Vos, W.M. and Vaughan, E.E. (2006) Proteomic Analysis of Log to Stationary Growth Phase Lactobacillus plantarum Cells and a 2-DE Database. Proteo-mics, 6, 6485-6493. http://dx.doi.org/10.1002/pmic.200600361
[30] Johanningsmeier, S.D., Fleming, H.P. and Breidt Jr., F. (2004) Malolactic Activity of Lactic Acid Bacteria during Sauerkraut Fermentation. Journal of Food Science, 69, M222-M227.
http://dx.doi.org/10.1111/j.1365-2621.2004.tb09891.x
[32] G-Alegrı́a, E., López, I., Ruiz, J.I., Sáenz, J., Fernández, E., Zarazaga, M., Dizy, M., Torres, C. and Ruiz-Larrea, F. (2004) High Tolerance of Wild Lactobacillus plantarum and Oenococcus oeni Strains to Lyophilisation and Stress En-vironmental Conditions of Acid pH and Ethanol. FEMS Microbiology Letters, 230, 53-61.
http://dx.doi.org/10.1016/S0378-1097(03)00854-1
[33] Johanningsmeier, S.D. and McFeeters, R.F. (2013) Metabolism of Lactic Acid in Fermented Cucumbers by Lactobaci- llus buchneri and Related Species, Potential Spoilage Organisms in Reduced Salt Fermentations. Food Microbiology,
35, 129-135. http://dx.doi.org/10.1016/j.fm.2013.03.004
[34] Fiocco, D., Crisetti, E., Capozzi, V. and Spano, G. (2007) Validation of an Internal Control Gene to Apply Reverse Transcription Quantitative PCR to Study Heat, Cold and Ethanol Stresses in Lactobacillus plantarum. World Journal of Microbiology and Biotechnology, 24, 899-902. http://dx.doi.org/10.1007/s11274-007-9556-7
[35] Kupradit, C., Rodtong, S. and Ketudat-Cairns, M. (2013) Development of a DNA Macroarray for Simultaneous Detec-tion of Multiple Foodborne Pathogenic Bacteria in Fresh Chicken Meat. World Journal of Microbiology & Biotechno- logy, 29, 2281-2291. http://dx.doi.org/10.1007/s11274-013-1394-1
[36] Patterson, A.J., Colangeli, R., Spigaglia, P. and Scott, K.P. (2007) Distribution of Specific Tetracycline and Erythro-mycin Resistance Genes in Environmental Samples Assessed by Macroarray Detection. Environmental Microbiology,
9, 703-715. http://dx.doi.org/10.1111/j.1462-2920.2006.01190.x
[37] Jenkins, B.D., Steward, G.F., Short, S.M., Ward, B.B. and Zehr, J.P. (2004) Fingerprinting Diazotroph Communities in the Chesapeake Bay by Using a DNA Macroarray. Applied and Environmental Microbiology, 70, 1767-1776. http://dx.doi.org/10.1128/AEM.70.3.1767-1776.2004
[38] Xie, Y., Chou, L., Cutler, A. and Weimer, B. (2004) DNA Macroarray Profiling of Lactococcus lactis subsp. lactis IL1403 Gene Expression during Environmental Stresses. Applied and Environmental Microbiology, 70, 6738-6747. http://dx.doi.org/10.1128/AEM.70.11.6738
Supplement 1. Primers designed for PCR amplification of the selected genes. OR F S ta rt E nd O R F L en g th S tr an d Ge n e P ro d u ct FP 5 ' FP Se q u en ce R P 5 ' R P S eq u en ce PC R Fr ag m en t L en g th
lp_0175 151222 152475 1254 + malE
maltose/maltodextrin ABC transporter, substrate binding protein
35 TAGCCACTGGTT
TAGCACTC 428
TCAGATTCGATCG
TTACAGG 393
lp_0230 208913 210751 1839 + pts2CB mannitol PTS, EIICB 51 AAAGAAACTGGG
CGTTAAGG 456
AATCTTATCGGAA
ATGGCGT 366
lp_0233 213329 214486 1158 + mtlD mannitol-1-phosphate 5-dehydrogenase 324
GCAAGCTAACAA
CAATACGA 698
TTGTAGCCTTTCA
TGTTACC 374
lp_0257 232292 233083 792 - pepM methionyl aminopeptidase 333 TGTTGCTGGTAC
ACCATCAC 729
GTCATCGGTAACG
ACAAGGG 396
lp_0302 278235 279038 804 - extracellular protein 123 CCAAGCTCACAA
CACTTCAG 507
AGCACTTGATGA
AGCTTGAC 384
lp_0304 280089 280727 639 - extracellular protein 44 CTAGTCTCTTTGCCATTGGT 586 AACGTGAAGCAACATAACTG 542
lp_0330 301990 302853 864 + fba fructose-bisphosphate
aldolase 30
ACAAGACGCATA
CAAGAACC 514
CGGCTAAGATGTC
GATACCA 484
lp_0447 401588 402862 1275 + mvaA hydroxymethylglutaryl- CoA reductase 212
TTGTTCCAATGG
TTACTGAG 612
AATACTCAGTAA
AGCGTCCT 400
lp_0480 428432 429031 600 + rpoE DNA-directed RNA polymerase, delta subunit 196
GGTAGTTTCATTT
CGCTCGG 491
TCGTCTGTGTCAT
CAACACC 295
lp_0537 485467 486429 963 - ldhL1 L-lactate dehydrogenase 143 ACGCCCTTGATC
TTGAAGAC 523
TGTAAGCATCAAC
GGAACGA 380
lp_0539 487338 490865 3528 + mfd transcription-repair coupling factor 314
TAAACGCCTTAT
TGCGTGAC 798
TTGTGCTAAATTA
TCGGCCA 484
lp_0547 496382 498619 2238 + ftsH
cell division protein FtsH, ATP-dependent zinc
metallopeptidase
327 CCAAGTTTCTAA
GTTGGCGG 750
TGAGAAGAATGG
GACACCAG 423
lp_0576 534155 534961 807 + pts9C mannose PTS, EIIC 112 CTGATCGGATTA
GTTACTGG 561
ACCGATTGATAA
ACCATCAG 449
lp_0577 534979 535896 918 + pts9D mannose PTS, EIID 49 TGGATGCGTTCT
AACTTCCT 506
TTAGAACCAGCTT
TGTACCC 457
lp_0601 572690 574021 1332 - pepC1 cysteine aminopeptidase 71 AAGTCATCGAAC
GTAGTGTC 394
TCAACCAAGCAA
CTTTACGG 323
lp_0609 579545 581035 1491 + gltX glutamate--tRNA ligase 185 ACAATTTGACGT
GGTTAGGG 612
AAAGTTGTACGTT
GGCATCC 427
lp_0619 587629 588054 426 + rplK ribosomal protein L11 161 TCCCTGTTGTGAT
TACGGTG 418
CGACGGTGAATC
CCATACTC 257
lp_0620 588155 588844 690 + rplA ribosomal protein L1 365 CCCAAGTTGGTC
GTTTAGGT 678
TAAATCAACACGT
ACCGCTG 313
lp_0621 589043 589546 504 + rplJ ribosomal protein L10 197 ATAAGGCCGGAT
TTGAAGAC 441
AGGTGCTTGTAAC
AAGTTGG 244
lp_0690 634153 636711 2559 + integral membrane protein (putative) 123
GTGGCATCTGTT
AAGCATGG 581
CCACTCAATAACC
GAACGAC 458
lp_0692 637543 638553 1011 - nrdF
ribonucleoside- diphosphate reductase,
beta chain
54 GGCAATTAACTG
GGATCGAG 489
TTGCTTCAATGGA
TCTTCGT 435
lp_0715 656135 657187 1053 - phnD
phosphonates ABC transporter, substrate binding protein (putative)
27 AGGTCTTTCATTC
ATTTCGG 399
ATAAGTAGCGTCT
TTCAAGG 372
lp_0728 665344 666969 1626 + groEL GroEL chaperonin 15 AAAGTTCTCTGA
AGATGCAC 397
TAGCGTGTAATGA
GTCAACC 382
lp_0757 691787 692707 921 + galU UTP--glucose-1-phosphate uridylyltransferase 153
AGACATTGTTAT
CGTCACGG 615
ACCAATGATAGC
AAGATCAC 462
lp_0786 720764 721354 591 - clpP endopeptidase Clp, proteolytic subunit 22
ATTGAACAGTCA
TCACGTGG 338
AAACGCTTGCCCT
TAGTACC 316
lp_0789 724979 726001 1023 + gapB
glyceraldehyde 3-phosphate dehydrogenase
161 CTCATGGTACTTT
GAACGCT 603
GAAGTTACCACC
ACGTACAG 442
lp_0790 726122 727324 1203 + pgk phosphoglycerate kinase 439 GGTGATGTCTAC
GTCAACGA 872
GAACCTTCAACA
Continued
lp_0791 727351 728109 759 + tpiA triosephosphate isomerase 389 CATTAGAACAAC
GTGAAGCC 736
GTTCCAAGAATG
AATCAGGT 347
lp_0792 728191 729519 1329 + enoA1 phosphopyruvate hydratase 239 TTGGTTACGATG
TAACTGAC 724
CAAAGGCAATGG
CAATATCC 485
lp_0800 736645 743064 6420 + cell surface protein precursor 203
CTACGACTAGTA
CAACAGGG 660
ATCTTTCGAGTCT
GAGTCAC 457
lp_0923 854229 856649 2421 + cell surface protein precursor 261
AACACAAACTAA
AGTGGCGA 706
TAGCTTGATTTGC
TTGGGTG 445
lp_0938 868001 870874 2874 + hsdR
type I site-specific deoxyribonuclease,
HsdR subunit
670 TTTACGACCACT TTCTTGAG 1109
ACCGCATTATTCA
TCTTCTG 439
lp_0959 890255 891661 1407 - pepD3 dipeptidase 15 TAAAGGTTCATGTACCACGA 388 GTAATACTAGGGTGCAAAGG 373
lp_1012 933125 934402 1278 + serS2 serine-tRNA ligase 251 AGACGTTGGATG
AAGAACGG 736
CGGGAATAACTTC
ATCACGA 485
lp_1021 939961 943575 3615 + rpoB DNA-directed RNA polymerase, beta subunit 223
TTAGAACCAAAG
TACACCGT 673
CCAACGTCAACAT
CAAACTG 450
lp_1022 943593 947234 3642 + rpoC DNA-directed RNA polymerase, beta’ subunit 168
GGATTGGGAATG
TGCTTGTG 602
TGACCAGAAGCA
TCCTTCAG 434
lp_1025 948830 949243 414 + rpsL ribosomal protein S12 16 CAATTAATTCGC
AAAGGCCG 364
CTTCGACACCAGC
AGTATCC 348
lp_1026 949260 949730 471 + rpsG ribosomal protein S7 91 ATGTTAGATGGTAAGCGCGG 432 CATCCGGTGAGTATCTTCAC 341
lp_1027 949872 951968 2097 + fusA2 elongation factor G 318 CGTATTGGATGC
CCAATCAG 678
GTCATCGATGTCA
GCTAAGG 360
lp_1033 953265 953894 630 + rplC ribosomal protein L3 34 GGAATGACGCAA
GTCTTCAC 423
ATGGTAACGAGA
ACCGTGAG 389
lp_1034 953913 954536 624 + rplD ribosomal protein L4 43 GGTGACGTTACT
TTGAACGA 377
ACTGCAACTAAG
CTGTTGTC 334
lp_1036 954853 955692 840 + rplB ribosomal protein L2 125 GTCGTAACAGTT
ATGGTCAC 605
AATTCGTGTTGTT
CATTGCC 480
lp_1040 956391 957044 654 + rpsC ribosomal protein S3 220 TGGTTCTGAAGT
TGAAGCTC 296
CCATGAATAGTCG
ATGTCAG 318
lp_1041 957047 957481 435 + rplP ribosomal protein L16 15 ACGGGTTAAGTA
TCGTCGTG 422
GATTCGCCACCTA
CTTCCTC 407
lp_1047 958742 959284 543 + rplE ribosomal protein L5 38 TCGTTCCAGCAT
TAGTTGAC 469
TTACAATGTCTAA
ACCGCGA 431
lp_1051 959949 960485 537 + rplF ribosomal protein L6 150 TAAATTCACTCG
TCCATCTG 501
TTCATCGACGTAA
CGAATCC 351
lp_1053 960906 961406 501 + rpsE ribosomal protein S5 101 CTGCATTAGTAA
TCGTTGGG 442
TTAAGCTCTTTAA
GCCTTCG 341
lp_1055 961635 962066 432 + rplO ribosomal protein L15 70 TCAAGTGGCCAAGGTAAGAC 375 GAACTTGCTTGCCTTAACTG 305
lp_1058 963427 964077 651 + adk adenylate kinase 90 GACCGGAGATAT
CTTCCGTG 418
ACTTATGGTAAGT
TGCACCG 328
lp_1062 965520 966464 945 + rpoA DNA-directed RNA polymerase, alpha subunit 99
TTTAGGGAATTC
ACTTCGTC 533
TAGTTGACACGTT
CGATTGG 434
lp_1070 973064 973990 927 + lipoprotein precursor 52 CTTTGATGATTC
AGTCGCAC 468
CTTTGATGATTCA
GTCGCAC 416
lp_1077 978985 979428 444 + rplM ribosomal protein L13 47 GGTATGTAGTTG
ATGCAACC 349
GGCCTAAAGAGT
TGTGAGGA 302
lp_1118 1015132 1016775 1644 + mleS malolactic enzyme 117 AACAATTGATGA
ACAGGCGA 547
CTGGCAGTACTTG
TGATGGG 430
lp_1261 1146477 1148120 1644 + oppA
oligopeptide ABC transporter, substrate binding protein
1305 AAACGGGAACTT CGATACGG 1624
TGAAGTTGTAGTT
TGAGCCC 319
lp_1274 1157416 1159146 1731 + ptsI phosphoenolpyruvate- protein phosphatase 102
AGTTTCCGATAC
GGATGCTG 411
CGTTACGTCGCGA
ATATCAC 309
lp_1316 1210182 1212608 2427 + leuS leucine-tRNA ligase 33 ATGGCAACATTA
TTGGAAGG 495
CGTTCCACCCATC
ATATCAG 462
lp_1329 1224048 1224695 648 - dgk2 deoxyguanosine kinase 213 CGATAACAACGT
CCTCGACC 509
CATTTCCGATAAG
CGGTCCA 296
lp_1468 1345128 1345925 798 + ATP-binding protein ABC transporter, 251 CACGTAAGGGACTCTTCCTC 728 TCAAGGGTCTTTGCTAAGTC 477
lp_1508 1378501 1381149 2649 + polA DNA-directed DNA polymerase I 289
CAGCTATTAGAC
GCGTATGG 719
TGTTCGCGATCCT
Continued
lp_1514 1385839 1387803 1965 + thrS threonine-tRNA ligase 1 1060
CGCTCATACCGT GAATTACC 1516
CGTTCTGGTAACA
AGAAGTC 451
lp_1615 1467824 1470241 2418 + priA primosomal protein N' 62
GTTATCGAATTC
CAACCGCC 506
ACTTGGTAGTACA
CATCGAC 444
lp_1632 1485226 1488783 3558 + smc cell division protein
Smc 166
TTACGCGGCACT
AAGATGAC 586
CAATGATATCGTT
CACGCGG 420
lp_1643 1496310 1502969 6660 + cell surface protein precursor 122
TTAGCCAAGTTG
AACAAGTG 491
AATTTACTGGTGA
CACTTGG 369
lp_1767 1601959 1603302 1344 + lysin 643 ACATACCACCCG
TTAAGCTG 1096
CCGTGATATAACC
ACCACTC 453
lp_1882 1699597 1700886 1290 - rpsA ribosomal protein S1 241 GTTGTCATTTCTC
GAATTGG 692
TGAACCAAACCA
TCAATTCC 451
lp_1897 1711809 1713569 1761 - pyk pyruvate kinase 243 ATCTGAATACAA
GATCGGTG 676
CTTGTGATTCGAT
CTTAGGG 433
lp_1899 1714731 1718081 3351 - dnaE
DNA-directed DNA polymerase III, alpha
chain
321 TGCAGGATTGTC
GCTAACAG 736
CCAGTTGCTCATA
GTCAGCC 415
lp_1941 1759378 1760784 1407 - nox4 NADH oxidase 9 AATGATCATCGG
TAGTACCC 382
CTTTCTCATGATC
GATACCC 373
lp_2027 1826580 1828448 1869 - dnaK heat shock protein
DnaK 14
AAATTATCGGGA
TTGACCTC 474
CAAACCATAGGC
TAAAGCTG 460
lp_2054 1857090 1857968 879 - tsf elongation factor TS 405 GATCAGTCTTCG TCGTTTCC 805
AACGAATGAATG
AGCTAACC 400
lp_2055 1858071 1858874 804 - rpsB ribosomal protein S2 298 ACTTTGACTAAC
TGGAACAC 597
AATAACGTCGAT
GTCATCTG 299
lp_2057 1860110 1861108 999 - ldhD D-lactate
dehydrogenase 181
GTATTGAACAAG
TTAGCCGA 610
ACGTGATAACATC
AGCTTGG 429
lp_2097 1889787 1891754 1968 + pts16ABC fructose PTS, EIIABC 229 ACCGTGATGTTT
GCTAAGAG 676
GCTTAACACCTTC
AGAACCA 447
lp_2118 1911390 1912712 1323 - tig trigger factor 851 CGCATGATGCAA TTGAAGAC 1261
CAATCAAGTCAA
CGGCTTGG 410
lp_2119 1912916 1914103 1188 - tuf elongation factor Tu 497 ACGATATTCCTG TTATCCGT 919
TGAACTTCTTGTG
GGTTTGG 422
lp_2146 1938778 1940616 1839 - typA GTP-binding protein
TypA 356
TGGAACAACACC
TAACACCA 798
ACGTTGAAGACC
AAAGAACC 442
lp_2193 1979094 1980377 1284 - ftsZ cell division protein
FtsZ 218
GTTCTAATCCTG
ATGTTGGT 635
AAGTCCAAGTTA
ACGTACCC 417
lp_2290 2066643 2069711 3069 - integral membrane
protein 99
GACATTGATTTG
GGAAGTGG 572
ATTACAACGGCG
GTAATCAG 473
lp_2324 2101355 2102593 1239 - gshA glutamate-cysteine ligase (putative) 175
ACACAGTTGGAG
TTAGTCAC 577
AGCAGCCATAAA
GATACGTC 402
lp_2331 2108055 2108663 609 + rpsD ribosomal protein S4 42 TTTGGGAATGTC
CCTTTCAG 430
CACGAACTGAGA
CAACTTGG 388
lp_2486 2222028 2224781 2754 - cell surface protein precursor, GY family 581
CATTGACGAGTG
CTACTCAG 984
GGTAGTCCCTGTA
AATTCCA 403
lp_2502 2233585 2234937 1353 - pgi glucose-6-phosphate isomerase 62
GCGAAATGCAAG
CTATGGTC 496
ACTTCGCGATTAA
ACGTTCC 434
lp_2659 2362936 2365302 2367 - xpk1 phosphoketolase 1069 ATGGCTGCTAAC CCAATCAC 1445
GCAAATAACCCA
TGACGTCC 376
lp_2694 2393220 2396825 3606 - rexB ATP-dependent nuclease, subunit B 497
TGGCGATCGTTT
ACAAAGAC 941
ACATTCGTATTCG
GCTCCTC 444
lp_3001 2669470 2672694 3225 - cell surface protein precursor (putative) 552
GACGGCTAGCTT
GTATTTGG 869
TTAAGGCCATAA
GTGTGCCC 317
lp_3075 2735786 2738533 2748 - cell surface protein (putative) 66
ATATCGTGGATC
ACGGACAG 457
CTAGCGATGCACC
AAATGAC 391
lp_3114 2772613 2778711 6099 - cell surface protein precursor 205
ACATTGGCTAGT
AAGTCGGT 587
TTCGTAGCTACTG
TAGCCGT 382
lp_3170 2827652 2828344 693 - pmg9 phosphoglycerate
mutase 208
GAAGAATCCGAC
CAACTCTG 582
TTCGATGTACTTG
CTTAAGG 374
lp_3174 2832356 2833549 1194 + cfa2
cyclopropane- fatty-acyl- phospholipid synthase
137 TTCCAATGCGTG
AAATTACC 595
GTTCTTGTGATAA
CGTGACC 458
lp_3204 2854090 2855373 1284 - nupC nucleoside transport
protein 49
GCCATTGCCTAC TTATTCTC 482
TGCTTCAATTGTA
ACTGCGA 433
Continued
lp_3421 3037010 3038122 1113 -
extracellular protein, gamma-D-glutamate- meso-diaminopimelate muropeptidase (putative)
442 GCTGCTCAATCA
AGTAGCAC 855
AGAGCAGTCCATT
TGTTCGT 413
lp_3485 3094698 3096914 2217 - melA alpha-galactosidase 42 AGAACAACTTGT CTTTCACC 401
TCTTCGACATAAG
TTTGTGG 359
lp_3551 3169067 3171478 2412 + xpk2 phosphoketolase 1172 TCGATGATTATG CTTTGGAC 1467
ATTGTAAGCTTCC
AACATCC 295
lp_3662 3282611 3285214 2604 - adhE
bifunctional protein: alcohol dehydrogenase,
acetaldehyde dehydrogenase
483 GGAAGCGATTAA
AGCTGCTG 924
TTTACCAGCAACT
GGACCAC 441
lp_3665 3286816 3287352 537 + pdc p-coumaric acid decarboxylase 53
ACACTTATGATA
ACGGCTGG 472
CTTTGTAAGGTGC
TTCACTG 419
lp_0002 1546 2685 380 + dnaN DNA-directed DNA polymerase III, beta chain 712
CCTTCTATTCTCG CTTACTC 1129
CGAACTGGTGTA
ATCAACTG 417
lp_0006 4565 6511 649 + gyrB DNA gyrase, B subunit 1451 GTTTACGGCAAT GGGAACTG 1875
CCATCAACATCGA
GAAGACC 424
lp_0061 60505 61350 282 + acetoacetate decarboxylase (putative) 368
GAATGACAACAG
TGCGACAG 802
TCATACCGACCCG
TTAAGAG 434
lp_0129 114984 115406 141 + hsp1 small heat shock protein 36 ATGTTGGATCCG
TTTGAACG 368
AATCGTTAAGAC
ACCGTCAG 332
lp_0184 164479 165345 289 - sacK1 fructokinase 196 CCGATGATCCGA
AATATGGT 587
AATATCTTTCCCA
GCTTTCC 391
lp_0210 193763 194950 396 + ack1 acetate kinase 693 TTAACGGGTGTC ACAATGGG 1099
CTGATGAGTCCTT
CTTGACC 406
lp_0233 213329 214486 386 + mtlD mannitol-1-phosphate 5-dehydrogenase 636
CTCTTCTCCGTTA
ATACTGG 1067
TTGTTCGATTGGT
TCATCCT 431
lp_0244 220124 220672 183 + oxidoreductase (putative) 134 TAACCAAGACTA
CGATGCGG 498
CTAAGAATGATTG
GGTGCCT 364
lp_0301 277394 278113 240 - membrane-bound protease, CAAX family 160
TAAATCGTGACT
GGCTACGG 561
GCCATAGTAGCG
ATGTTGTC 401
lp_0313 288937 290139 401 + ndh1 NADH dehydrogenase 778 CACACGTCATTG CTGATTCC 1179
CTTTACTGAAGAC
CGTTCCT 401
lp_0329 300197 301564 456 - acdH acetaldehyde
dehydrogenase 861
GAAGCAACTGTC ATGAACCT 1265
GAGTGTTAAGGA
TGGTGCGA 404
lp_0466 417214 418050 279 + purR purine biosynthesis operon repressor 388
AAATCGACGCTG
TTATGACC 785
AATCGCCTTGTCA
CTATCAC 397
lp_0481 429204 430817 538 + pyrG CTP synthase 771 GACCAAATCGTC CTTGACCA 1214
TTCAGCAGAGTTA
GCATCCT 443
lp_0566 522053 522880 276 + nadE NAD synthase 368 GGAAGCTAACCAATTGACGA 777 CAGTCTTTAAGTACCACGCC 409
lp_0575 533143 534117 325 + pts9AB mannose PTS, EIIAB 456 CCAGGGAAGTTG
GAATATGG 811
TGAACTTTACCAA
CTGAGTG 355
lp_0585 558254 561127 958 + transcription regulator 2308 TGGTCGAAATGA AGACACGG 2732
AATGTCTGGCATC
TCTTCGG 424
lp_0597 570711 571388 226 + pgm2 phosphoglycerate mutase 228 CTGCCTGAGTAT
AAGACGTG 635
GTGATAACAAATT
GGCACTC 407
lp_0602 574097 574780 228 - rpiA1 ribose 5-phosphate
epimerase 198
GGTATCCCGATG
AAATCCGT 623
CATGTCTAAGAAC
AGGCCGT 425
lp_0725 663325 664002 226 + hypothetical protein 198 GGTATCCCGATG
AAATCCGT 623
CATGTCTAAGAAC
AGGCCGT 425
lp_0737 674619 675185 189 + ribosomal protein S30EA 163 AAGTCACCATTC
CACTTCCC 547
TCAATCAAACCGT
AACGACC 384
lp_0754 688895 689842 316 + hprK
bifunctional protein: HPr kinase, P-ser-HPr
phosphatase
373 TGACGAATTACT
TGGAAGGT 762
ATTTCCGGTTCTG
TTCTCCA 389
lp_0807 748192 749169 326 + pta phosphate
acetyltransferase 449
CTCGGGTGCATT
TATCATGC 930
CTTCTTCACTGCA
TCCACGT 481
lp_0852 790676 792439 588 + pox2 pyruvate oxidase 1360 GCTTGCCCGTTA TTAACGTG 1738
AGTAAGGCGCCT
AATGATGG 378
lp_0853 792561 793469 303 - pepR1 prolyl aminopeptidase 425 TGTCAACGTTAA
CAAGTGTC 860
CAAATGGTCAAA
GTAGACGG 435
lp_1005 927175 928857 561 + als acetolactate synthase 1155 AGTGATGACATG ACAGTGAC 1562
ATCAGCAGGTTG
GTTTACCC 407
lp_1090 992601 993524 308 - ttdA L(+)-tartrate dehydratase, subunit A 537
TTCGTGATGGAT
CGCATGAC 914
TTCGACTCCTTTG
Continued
lp_1101 999592 1000521 310 + ldhL2 L-lactate dehydrogenase 283 ACCGCAATACGA
AGATTCTG 657
TTTGACCACCTTT
ACCACGA 374
lp_1108 1005719 1006633 305 + citE citrate lyase, beta chain 483 TATACGACGGAC
ATGAAGAC 869
TTTGGCTAAGCTC
ATCACAC 386
lp_1148 1044413 1045876 488 + gatA
glutamyl-tRNA amidotransferase,
subunit A
1015 ATGTCTATGTCC GTAGTCGT 1424
TTGCGTTGCTTGT
TCAAAGG 409
lp_1149 1045876 1047300 475 + gatB
glutamyl-tRNA amidotransferase,
subunit B
945 GTGTTGACCCAA ACTAAGGA 1352
CATGATTTGACCC
ACGAGGA 407
lp_1200 1093199 1094146 316 + galE2 UDP-glucose 4-epimerase 347 CCTATTTACGTCT
TCGGCAG 788
CAATGACGTTTCT
GCAACCT 441
lp_1250 1134493 1136007 505 - gntK gluconokinase 1015 CCCACGGACTCT TATTTCAC 1433
ATATAACTGGTGG
TTGGCGG 418
lp_1273 1157150 1157416 89 + hpr phosphocarrier protein Hpr 11 AGAATTTCACGT
TATCGCAG 242
CATCGTTTCAGTT
AAAGCTG 231
lp_1301 1189935 1191122 396 + metK adenosyltransferase methionine 726 GTTATTGGTGGTCCTCAAGG 1140 ATGGCAAATCAATATCGGTC 414
lp_1500 1373935 1374624 230 + narI nitrate reductase, gamma
chain 260
GTACCATATGTT
CGGTTCCT 671
CCGATAAACGAT
GTAACGCC 411
lp_1521 1391554 1392585 344 - oxidoreductase 633 AGTGAAGTACAT GCTTTAGG 1026
CCCATCCTTCAAT
AACTACC 393
lp_1541 1407210 1408646 479 + gnd2
phosphogluconate dehydrogenase (decarboxylating)
987 CGTCAAGCCCTC TACTTCAG 1407
ATAACCCTTCACG
GTCAGTC 420
lp_1563 1428800 1429282 161 + greA2 transcription elongation factor GreA 54
AAAGAGCTTGAA
GACCTTCG 458
TTTAACCGTCATG
GTACCGG 404
lp_1665 1518459 1519502 348 + adh1 alcohol dehydrogenase 590 AATCGTCTTGAT GAGTCGCC 1003
TGCATGTCTTGAT
AAGCCTG 413
lp_1675 1526214 1527446 411 + fabF 3-oxoacyl-[acyl-carrier protein] synthase II 750
CAGATTCTTGGT GAAGTCGT 1170
TACTCAAAGCATA
GGTTGCG 420
lp_1779 1610466 1612121 552 + fhs formate-tetrahydrofolate
ligase 1159
CCGTCAAAGACT ATTGTGCC 1561
GTCAAAGCGACA
ATGAAACC 402
lp_1783 1614564 1615646 361 + py-rAA2
carbamoyl-phosphate synthase (glutamine-hydrolysing),
small chain
469 CAACACCGAAAC CATTTCCT 843
TTTGGTTCGTAAT
CACTTCG 374
lp_1817 1643232 1644257 342 + ribitol-5-phosphate 2-dehydrogenase (putative) 421
CATTCATTGAGA
TGGTCTCG 830
TCGTAACGTCAAT
CCTTCTG 409
lp_1898 1713655 1714617 321 - pfk 6-phosphofructokinase 325 CATTGCGCTTAA
CGGAACAC 746
ATGAGCAATGGT
ATTCCCAC 421
lp_1981 1793507 1794787 427 - hisS histidine-tRNA ligase 842 CTACACGACGAT CTGTGCTG 1256
ATCTTGATAGATG
TCCGCCA 414
lp_2030 1830545 1831255 237 - aldB alpha-acetolactate decarboxylase 173
TGAGGATGGTCA
AATTCGTG 587
CGCTTGTTCGACT
TCAAACC 414
lp_2052 1855602 1856165 188 - frr ribosome recycling factor 125 TTCTGCAGATTA
TTACGGTG 473
TAACTGATGTAAC
TGGTCGT 348
lp_2086 1880695 1881213 173 - apt adenine
phosphoribosyltransferase 71
TATTTCACCACT
GATGGCTG 466
TGCAACTCTTTGA
GTTCGAC 395
lp_2094 1886553 1887848 432 - GTP-binding protein 865 CCGAAGCTAATC TGGAAGAC 1256
CGTATCATCATTC
TTGGCAC 391
lp_2096 1888848 1889765 306 + fruK 1-phosphofructokinase 457 CTGCTGGTGCTA ACTTTGTC 857
CGCAATGTCTTCT
GAGAAGG 400
lp_2123 1917039 1917911 291 - dapA1 dihydrodipicolinate
synthase 321
GTTCCCTACTAC
AACAAGCC 730
CTCATCTTGGGTG
TTAAGTC 409
lp_2153 1945980 1946957 326 - pdhB
pyruvate dehydrogenase complex, E1 component,
beta subunit
568 CCGTTCCGTTAG
ATAAAGCA 950
TGCCTCAATTTCA
TCTTCAG 382
lp_2154 1946959 1948071 371 - pdhA
pyruvate dehydrogenase complex, E1 component,
alpha subunit
511 CTTATACTGGTG
ATGGTGGG 906
TACGGTAACGAA
TCAATGGA 395
lp_2189 1976850 1977548 233 - divIVA cell division initiation protein DivIVA 201 AATCAATCTATCTTGGTGGC 585 TTGCTTCTGAGTTTACGCTC 384
lp_2231c 2022077 2022661 195 - ppiB peptidylprolyl isomerase 290 GGCATTATCAAT
GGCCAACG 566
TGTTTCGATCACA
Continued
lp_2256 2039314 2040324 337 - ccpA catabolite control protein A 625 AGGCTAAGATT CCGTTTGAC 1008
AATCAGCAGACTT
GGTTGAG 383
lp_2301 2078957 2080099 381 - recA recombinase A 678 GCAGAACAGAT CAAGGAAGG 1077
TACTTTGACCTTT
ACTGCCA 399
lp_2323 2100621 2101115 165 - tpx thiol peroxidase 150 ATGCCAGATAT TGATACGCG 463
GCAACGTAATTTG
GCTCGTG 313
lp_2345 2120498 2121610 371 - ddl D-alanine-D-alanine
ligase 616
CCGATGCGTTC AAATATGAC 1021
GCCGTATAACTAA
TGCCCGA 405
lp_2349 2123935 2124852 306 - hicD3 L-2-hydroxyisocaproate dehydrogenase 467
AAAGTATGTCG GACAAGCAG 863
TAACGACGCTCGT
TCATCAG 396
lp_2359 2130199 2131200 334 - mreB2 cell shape determining protein MreB 467
GACTAGTGATA TCGCTGTCC 853
CCACCAGTCAACG
TAATTCC 386
lp_2366 2137118 2138632 505 - atpA H(+)-transporting two-sector ATPase, alpha subunit 950
AATTATCGAAA CGCAAGCTG 1364
ACGGGCAATATCA
TCAACTG 414
lp_2544 2269594 2270949 452 + npr2 NADH peroxidase 848 GACCTTAGTCC CATTTGCCC 1264
GCTAAGTCAGCAA
CAGTCAG 416
lp_2596 2313948 2314751 268 - pflA1 formate acetyltransferase activating enzyme 374
TGAGACAACTG GTTACGCAC 793
TTCACCCGTACTT
TAACACC 419
lp_2598 2315865 2318309 815 + pflB1 formate C-acetyltransferase 1991 AACCTCTTCTAT TTCGGCCA 2404
GTTTCTTTGGATA
GGCCCAC 413
lp_2681 2380421 2381905 495 + gpd glucose-6-phosphate
1-dehydrogenase 937
CTTTCGTCGCTG GTAAAGTC 1355
AACGAATTTCCAC
GAATCGG 418
lp_2690 2398345 2398983 213 - pyrE orotate
phosphoribosyltransferase 97
GTATTCGCCAA CCAGAACAG 490
GTACCGGCATCAT
TGATCAG 393
lp_2697 2398345 2398983 213 - pyrE phosphoribosyltransferase orotate 97 GTATTCGCCAACCAGAACAG 490 GTACCGGCATCATTGATCAG 393
lp_2699 2399695 2400612 306 - pyrD dihydroorotate oxidase 124 TGACGATTTCTT
ATCCGGCG 527
GTTGGACAAACTG
AACAGCG 403
lp_2702 2404915 2406207 431 - pyrC dihydroorotase 422 ATTTGGAACTG ATCCAGCGA 838
ATGTCTGTACAAG
CAGTCGG 416
lp_2703 2406211 2407146 312 - pyrB carbamoyltransferase aspartate 869 GTTAGTTGCGGGATTGTTGG 1284 GCGTTTCCTTTCCATATGCC 415
lp_2704 2407293 2407835 181 - pyrR1 pyrimidine operon
regulator 554
CAAAGAATGGT ATGGCCGTG 932
AACCTCCACTTGA
GTTGCTG 378
lp_2728 2428365 2429495 377 - purK1
phosphoribosylaminoimidazole carboxylase, ATPase subunit
11 AGTCGTTGATG CAATGACCA 411
GTCCACGATCGAC
TAAGACC 400
lp_2766 2457282 2458373 364 + hypothetical protein 680 AGCTAATGTTCAGCCCAGTG 1073 TAATACGGTGACATGACCCA 393
lp_2807 2504803 2506059 419 - tyrS tyrosine-tRNA ligase 540 TCAAATGATGC GACTTATGG 950
GTATTGCCCAAAC
TCATCGT 410
lp_2873 2558269 2559309 347 - adh2 alcohol dehydrogenase 760 TCAACCAGGAT GATCGAGAC 1144
CCATTGATTCGAA
TCGCACC 384
lp_3051 2712741 2713913 391 + dhaT 1,3-propanediol
dehydrogenase 440
AGCCTTAGCTG ACGTAATGG 856
CGTAAGCCAATGT
TCTTCCA 416
lp_3092 2751334 2752746 471 + gabD succinate-semialdehyde dehydrogenase (NAD(P)+) 682
AAACATCATTA CGCGAAGCC 1092
CGTCTTTAAGCGC
ATTAGTC 410
lp_3125 2791021 2792502 494 +
fumarate reductase, flavoprotein subunit precursor, N-terminally
truncated
864 AAATTAGTCCC TGGCGATCC 1270
AGTTCTGGTAAGG
AGCTGAG 406
lp_3265 2904444 2905385 314 +
cell surface hydrolase, membrane-bound
(putative)
960 GGGAACTTCAT GGGCTTAGG 1371
ACGTATCACCAGT
TAGTCCA 411
lp_3270 2910392 2911681 430 + purA adenylosuccinate synthase 474 CGTCACACGGA TATCATCCT 896
TTGATACTCGGCA
GGATCGA 422
lp_3314 2951354 2952175 274 + pflA2 formate acetyltransferase activating enzyme 850
AAGTCGGTGAT TTCATTCGT 1266
TAACGTTAGTTTG
TTGGCGA 416
lp_3352 2981556 2981999 148 - hsp3 small heat shock protein 398 GTTCGAACGTC TAATGAAGG 794
CTTGTACCCGTTG
TAATCAG 396
lp_3403 3017894 3018754 287 - oxidoreductase 64 TGGACGATTTG
GTTAATGGA 431
AATATGATGGGTA
TCCGCAG 367
lp_3480 3089259 3090263 335 - UTP-galactose-1-P
uridylyltransferase 321
GTTGACCTCTAC TTGATCCA 711
AGAAACCGTGTTG
TAATGAC 390
lp_3484 3093639 3094598 320 + lacM beta-galactosidase, small
subunit 486
GGTCTGCGGTTT ATCATACC 882
AACTATCAATGCC