Munich Personal RePEc Archive
Macroeconomic Dynamics of Egypt: An
Integrated Approach to Trade and
Exchange Rate Policy Reforms
Lord, Montague
September 2000
Online at
https://mpra.ub.uni-muenchen.de/50642/
Development Economic Policy Reform Analysis Project (DEPRA)
The Economic Analysis of Tariff
Reform in Egypt
Annex IV:
Macroeconomic Dynamics of Egypt
An Integrated Approach to Trade and
Exchange Rate Policy Reforms
Prepared for
Ministry of Economy and
Foreign Trade
and
Ministry of Finance
Submitted to
USAID
Economic Growth/Sector
Policy
Cairo, Egypt
Submitted by
Nathan Associates Inc.
Table of Contents
Contents ... ii
List of Tables ... iv
List of Figures ... iv
Acronyms ... v
Executive Summary ... vi
1.0 Introduction ...1
1.1 Transformation of the Economy ... 1
1.2 Modeling Trade and Exchange Rate Policies ... 4
1.3 Scope of the Study ... 6
2.0 Characterization of the Egyptian Economy ... 8
2.1 National Income Accounts and the Balance of Payments ... 8
2.2 Structure of Trade ... 9
2.3 Capital Movements and the Monetary Sector ... 10
2.4 Characteristics of the Time Series Data ... 12
2.5 Dynamic Specification ... 17
3.0 Modeling the Output Market ... 20
3.1 Overview ... 20
3.2 Output Determination ... 20
3.3 Aggregate Demand and the IS-Curve ... 26
3.4 Aggregate Supply... 28
4.0 Modeling the Monetary and Fiscal Sectors ... 29
4.1 The Supply and Demand for Money ... 29
4.2 Derivation of the LM Curve ... 31
4.3 Government Revenue and Expenditures ... 32
4.4 Monetarization of the Fiscal Deficit ... 33
5.0 Modeling the External Sector ... 34
5.1 Balance of Payments Components... 34
5.2 Demand for Imports ... 37
5.3 Demand for Exports ... 47
5.4 Capital Flows ... 56
6.0 Modeling Economic Policies... 58
6.1 Overview ... 58
iii
6.3 Monetary Policy ... 61
6.4 Fiscal Policy ... 63
6.5 Exchange Rate Policy ... 64
6.6 Structure of the Model ... 65
6.7 Specification of the Model ... 67
7.0 Policy Impact Assessments ... 71
7.1 Overview ... 71
7.2 Baseline Forecasts ... 71
7.3 Fiscal Implications of Trade Liberalization ... 74
7.4 Implications of Exchange Rate Policy Reforms ... 78
8.0 Summary and Conclusions ... 82
Annex: Model Listing in Eviews ... 84
Statistical Appendix ... 112
List of Tables
Table ES1 Baseline Projections of Key Macroeconomic Variables ... xi
Table ES2 Multiplier Analysis of Alternative Tariff Structures1997 ... xiii
Table ES3 Impact Indicators of Alternative Tariff Structures1997 ... xiv
Table ES4 Effect of 10% Devaluation on Egypt's Economy1997 ... xvi
Table 2.1 Contribution of Trade by Selected Products, 1997 ... 10
Table 2.2 Egypt’s Balance of Payments, 1980-98 ... 11
Table 2.3 Capital Inflows by Type, 1990-98 ... 12
Table 2.4 Descriptive Statistics of Key Macroeconomic Variables ... 14
Table 3.1 Egypt: Value Added by Sector ... 28
Table 5.1 Regression Results of Import Demand Equation ... 41
Table 5.2 Price, Income and Exchange Rate Elasticities of Import Demand ... 43
Table 5.3 Income and Exchange Rate Elasticities of Demand for Service Imports ... 46
Table 5.4 Regression Results of Export Demand Equation ... 50
Table 5.5 Price, Income and Exchange Rate Elasticities of Export Demand ... 53
Table 5.6 Income and Exchange Rate Elasticities of Demand for Service Exports ... 55
Table 5.7 Income and Exchange Rate Elasticities of FDI Inflows ... 56
Table 7.1 Major Baseline Assumptions, 2000-2010 ... 71
Table 7.2 Projections of Key Macroeconomic Variables ... 73
Table 7.3 Multiplier Analysis of Alternative Tariff Structures on Key Macroeconomic Variables ... 76
Table 7.4 Impact of Alternative Tariff Structures on Key Macroeconomic Variables ... 77
Table 7.5 Effect of 10% Devaluation of Egypt’s Economy ... 80
List of Figures Figure 1.1 Fiscal Deficit/GDP ... 1
Figure 1.2 Current Account Deficit Percent of GDP ... 2
Figure 1.3 Egypt’s Global Export Market Share ... 3
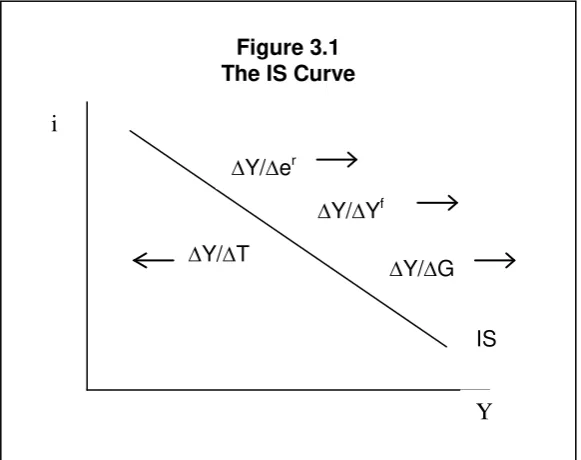
Figure 3.1 The IS Curve ... 23
Figure 4.1 The Velocity of M2 in Egypt ... 30
Figure 5.1 The FE Curve ... 36
Figure 6.1 Aggregate Demand and Output Equilibrium ... 60
Figure 6.2 Aggregate Output, Prices and the Exchange Rate ... 62
Acronyms
v
CES Constant elasticity of substitution
DEPRA Development Economic Policy Reform Analysis Project DF Dickey-Fuller (test)
DW Durbin-Watson (test) ECM Error-correction mechanism ERP Effective rate of protection EU European Union
FDI Foreign direct investment FE Foreign exchange
FEER Fundamental equilibrium exchange rate GDP Gross domestic product
GOE Government of Egypt
GRG Generalized reduced gradient HS Harmonized system
IMF International Monetary Fund IS Investment-Savings (curve) LE Egyptian pounds
MPI Marginal propensity to invest MPM Marginal propensity to import NRP Nominal rate of protection NTBs Non-tariff barriers
REER Real effective exchange rate
SITC Standard International Trade Classification (system) UN United Nations
USAID United States Agency for International Development VAR Vector autoregressive
Executive Summary
Introduction
Since the beginning of the last decade, the Government of Egypt’s macroeconomic stabilization efforts have been supported by policies aimed at establishing the fundamental conditions needed for internal and external balance, anchoring the nominal exchange rate, and removing price distortions through economic reforms encompassing trade liberalization, fiscal reform, privatization and deregulation. Fiscal stabilization has been one of the key ingredients for the establishment of the fundamental conditions needed for macroeconomic stability, while the nominal exchange rate anchor has been used to facilitate disinflation. Since taxes on international trade represent one-fifth of the Government’s total tax revenue, any discussion about trade liberalization must weigh the fiscal revenue implications against efforts to further integrate the Egyptian economy into the global economy. Moreover, a new round of trade liberalization under the current nominal exchange rate anchor could aggravate the trade deficit and thereby undermine the external balance. It is in the context of the need to coordinate this broad set of macroeconomic stabilization and economic reform policies that the present macroeconomic model has been developed.
The model is designed to support the formulation and sequencing of a new round of trade policy reforms in a manner that is economically and technically viable, acceptable to the Government, and responsive to private sector needs. By its very nature, however, it also provides a broad analytical framework for the Government of Egypt to examine the macroeconomic stabilization and economic reform policies needed to move the country into a higher growth trajectory. By offering both real and financial sector forecasting and policy simulation capabilities for quantifying the effects of trade reforms under alternative exchange rate system, it provides a means to analyze the inter-relationships and feedback effects of policy-determined economic variables.
The present study forms part of a large-scale study entitled The Economic Analysis of Tariff Reform in Egypt undertaken by the Development Policy Reform Analysis Project (DEPRA) for the Ministry of Economy and Trade and the Ministry of Finance. The macro-model design and estimation, as well as its documentation in the present study, has been undertaken by Dr. Montague Lord, Nathan Associates Inc. consultant, under the direction of Dr. James Walker, DEPRA/Trade Liberalization Advisor, Dr. John Suomela, DEPRA/Senior Trade Policy Advisor, and Dr. Hafiz Shaltout, USAID/COTR. Greta Boye, Nathan Associates Inc. consultant, applied of the model to alternative tariff reforms and the results of that analysis are presented in a separate annex entitled Quantifying Trade Liberalization: Direct versus Macroeconomic Consequences, which also forms part of the aforementioned study entitled The Economic Analysis of Tariff Reform in Egypt. The present study benefited greatly from extensive data and economic information provided by Dr. Suzanne Messiha and the Comp Team of DEPRA.
vii
The Egyptian economy has undergone large and fundamental reforms during the last decade. Macroeconomic stability and the liberalization of markets have supported the economy’s favorable growth rates and the population’s improved living standards by attracting domestic and foreign private investment and encouraging greater trade. The Government of Egypt’s (GOE) strategy for stabilization has been rooted in policies aimed at (a) establishing the fundamental conditions needed for internal and external balance, (b) pegging the exchange rate, and (c) removing price distortions through economic reforms encompassing trade liberalization, fiscal reform, privatization and deregulation.
Internal balance in output and inflation has been achieved through fiscal stabilization and monetary restraints. The successful reduction in the fiscal deficit from 20 percent of GDP in 1990/91 to around 1 percent in 1998/99 reflected both revenue increases and expenditure cutbacks. The earlier fiscal deficits and large liquidity expansion needed to finance those deficits had helped to maintain annual inflation rates of around 20 percent in the 1980s, but with fiscal austerity, inflation eventually decelerated to around 4 percent after 1997. The Government has opted to use the exchange rate as a nominal anchor, and that disinflation strategy has been supplemented by strict monetary and credit controls. Since the unification of the exchange rate in 1991 and liberalization of interest rates in 1993, the Egyptian pound has moved in a narrow range vis-à-vis the dollar and any upward or downward pressure on the exchange rate has been absorbed through passive intervention.
External balance was initially achieved through a series of nominal depreciations between 1989 and 1991 that helped to reverse the large current account deficits during the first part of the 1990s. Adjustments of the trade balance did not, however, contribute as much to the improvement as did those of the services balance. Merchandise exports contracted in the early part of the decade and remained sluggish until the middle of the decade. Although those exports grew by 11 percent annually in that period, they fell sharply in 1998 as a result of the Asian crisis-induced global trade recession. Under these conditions, the value of goods exported at the end of the 1990s only reached about two-thirds of its existing value at the beginning of the decade and, consequently, Egypt’s share of world trade fell from 0.14 to 0.06 percent during the decade. In contrast, merchandise imports expanded by nearly 50 percent during the decade, notwithstanding sharp cutbacks in 1991-92. The effect of these developments on the economy have been large since the combined value of exports and imports of goods and non-factor services currently represents 40 percent of gross domestic product (GDP).
external debt obligations through capital inflows during this period led to exceptional financing, including accumulation of arrears on external debt service.
Notwithstanding these difficulties, there is no doubt that Egypt has prospered under its macroeconomic policies. The benefits of the Government’s strategy have included low inflation, disciplined financial policy, and a stable external environment. Capital inflows have bolstered the country’s long-term growth prospects by increasing investment and confidence. Trade conditions have also improved from a decade ago. The GOE has successfully moved from import substitution policies to an export-led strategy based on a series of trade policy reforms instituted that have aimed at liberalizing trade through three types of measures. First, import tariffs have been reduced; second, quantitative import measures have been replaced with tariffs and non-tariff barriers (NTBs) to trade have been greatly reduced; and third, exports have been promoted through the easing of administrative procedures. While these measures have gradually opened trading activities to the private sector, the Government recognizes that high levels of import restrictions remain that, despite offering domestic industries substantial protection from foreign competition, give rise to inefficiencies in the economy and reduce the international competitiveness of firms.
Fiscal Revenue Context of Trade and Exchange Rate Reforms
The efficiency gains from further trade liberalization need to be weighed against the Government’s strategy for achieving internal balance, largely through fiscal austerity and the maintenance of fiscal revenues. While total tax revenue since the start of the reforms has remained fairly stable relative to GDP, non-tax revenue has contracted from 14 to less than 9 percent of GDP between the start and end of the last decade. Tax revenue has therefore had to support an increasingly larger portion of fiscal expenditures, and since taxes on international trade currently represent about one-fifth of the Government’s total tax revenue, the fiscal revenue implications of such an initiative are especially important to the GOE.
ix
Measuring the Macroeconomic Impact of Economic Policy Reforms
An earlier study by DEPRA (Lord, 1999) examined the conditions needed to determine the fundamental equilibrium exchange rate (FEER) for Egypt’s balance of payments. Based on the elasticities approach to the balance of payments, the study developed a partial equilibrium model to address the effects of changes in the exchange rate on the current and capital accounts. By focusing on the direct linkages between exchange rates and the balance of payments, however, the elasticities approach disregards the effect of the exchange rate adjustment process on the GOE’s simultaneous pursuit of internal and external balances in the economy. Nevertheless, the approach provides a useful means of calculating the optimal real effective exchange rate needed to achieve overall equilibrium in the balance of payments.
The present study extends the earlier elasticities-absorption approach to the balance of payments to the analysis of the consequences of tariff reforms on the Egyptian macro-economy, particularly as it relates to fiscal revenue implications. From an analytical perspective, we use the Mundell-Fleming model to examine the effects of trade liberalization and exchange rate changes in an open macro-economy. The model is of an open economy in the familiar IS-LM framework that includes the determination of the trade and capital accounts of the balance of payments.
Since capital movements and the extent of their mobility play a critical role in the analysis of economic policies, we also consider alternative assumptions about policies impacting on their mobility. These extensions permits us to move from a partial equilibrium perspective to one that examines trade and exchange rate policies in the context of Egypt’s macroeconomic fundamentals. Furthermore, while trade liberalization by itself is likely to improve the efficiency of the economy and therefore impact on output and employment, it may also aggravate the current account imbalance. We therefore include in the analysis complementary exchange rate adjustments that would help to produce a sustainable balance of payments and move the Egyptian economy closer to overall equilibrium.
The modeling procedure has sought to account for the structure of the Egyptian economy, the availability of data, and the degree of stability of time-series estimates of parameters during the country's transition process. The resulting model allows for considerable flexibility in the selection of the policy mix and instruments for the targets of a program. In its present form, it provides a framework for making rational and consistent predictions about Egypt's overall economic activity, and the standard components of the production and expenditure concepts of the national accounts. It also offers a means to quantitatively evaluate the impact of trade liberalization and other economic policy reforms on the country, and assess the feedback effects that changes in key macroeconomic variables of the economy produce in other sectors.
model therefore makes it tractable from an operational point of view, and it provides the basis for subsequent extensions of the real and financial sectors in both the domestic and external sectors of the economy.
Policy Impact Assessment
The macroeconomic model incorporates key assumptions about exogenous and policy-related variables. The principal policy variables for the Egyptian economy are the tariff structure, the exchange rate, and a change in the net domestic assets component of the money supply that can be used to influence the interest rate. The principal exogenous variables are the economic growth rates, inflation and exchange rates of Egypt's foreign markets and investors.
Three sets of simulations have been performed with the model. The first provides the benchmark against which policy impact assessments are measured. The second set assesses the impact of alternative trade liberalization policies that include free trade, concertina, two-tier, a uniform, and a combination of two-tier and uniform rate tariffs. The final set evaluates the impact of a real effective exchange rate devaluation to neutralize the initial effects of trade policy reforms on the balance of payments, the national income accounts on the expenditure-side, and the money supply, prices and real exchange rate. Such a realignment in the exchange rate often accompanies trade liberalization to bring the exchange rate more in line with a level that is consistent with a sustainable medium-term external position under a situation in which there are lower trade barriers.
The forecasts generated by the model are indicative of the direction of the economy and should be interpreted with caution since the model results depend on key assumptions and are demand-driven, insofar as they exclude details about the production-side of the economy. Nevertheless, the results provide a parsimonious representation of the Egyptian economy that yield an internally consistent set of estimates about the likely outcome of events over the next few years. For the baseline forecast, they therefore point to important issues about the near-term prospects of the economy.
Baseline Forecasts
The baseline assumptions for Egypt's major export markets and foreign investors are that the global economy will continue its recovery and maintain a trend growth rate of 4 percent in 2000-2020. The assumptions underlying our baseline projections represent a fairly benign scenario of moderate and sustainable growth. The risk to this assumption is predominantly on the downside and a significantly worse outcome is clearly possible in the important North American and Western European markets for Egypt. The potential for a broad and deep economic downturn in the US and EU markets would severely impact on Egypt's exports and its overall economic growth.
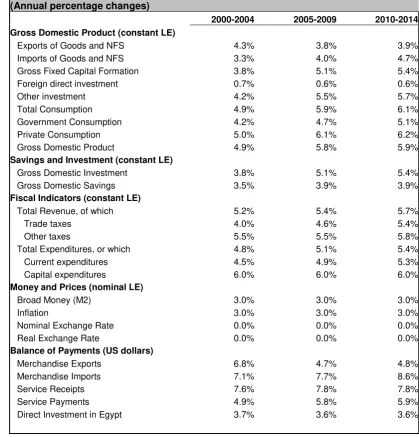
xi
[image:12.595.87.507.123.561.2]Exports of goods and non-factor services are expected to outpace imports of goods and non-factor at the beginning of the decade, but lag behind those imports in 2005-2015. As is to be expected, the forecast is for the growth of private consumption to exceed that of government consumption, and as in other countries, that private consumption is projected to grow faster than investment. Growth of the service sector is expected to outpace that of industry, and that of industry is expected to outpace that of agriculture. The unconstrained model projects an inflation rate of 3 percent as a direct result of a similar growth rate for broad money.
Table ES1
Baseline Projections of Key Macroeconomic Variables
(Annual percentage changes)
2000-2004 2005-2009 2010-2014
Gross Domestic Product (constant LE)
Exports of Goods and NFS 4.3% 3.8% 3.9%
Imports of Goods and NFS 3.3% 4.0% 4.7%
Gross Fixed Capital Formation 3.8% 5.1% 5.4%
Foreign direct investment 0.7% 0.6% 0.6%
Other investment 4.2% 5.5% 5.7%
Total Consumption 4.9% 5.9% 6.1%
Government Consumption 4.2% 4.7% 5.1%
Private Consumption 5.0% 6.1% 6.2%
Gross Domestic Product 4.9% 5.8% 5.9%
Savings and Investment (constant LE)
Gross Domestic Investment 3.8% 5.1% 5.4%
Gross Domestic Savings 3.5% 3.9% 3.9%
Fiscal Indicators (constant LE)
Total Revenue, of which 5.2% 5.4% 5.7%
Trade taxes 4.0% 4.6% 5.4%
Other taxes 5.5% 5.5% 5.8%
Total Expenditures, or which 4.8% 5.1% 5.4%
Current expenditures 4.5% 4.9% 5.3%
Capital expenditures 6.0% 6.0% 6.0%
Money and Prices (nominal LE)
Broad Money (M2) 3.0% 3.0% 3.0%
Inflation 3.0% 3.0% 3.0%
Nominal Exchange Rate 0.0% 0.0% 0.0%
Real Exchange Rate 0.0% 0.0% 0.0%
Balance of Payments (US dollars)
Merchandise Exports 6.8% 4.7% 4.8%
Merchandise Imports 7.1% 7.7% 8.6%
Service Receipts 7.6% 7.8% 7.8%
Service Payments 4.9% 5.8% 5.9%
Direct Investment in Egypt 3.7% 3.6% 3.6%
Fiscal Impact of Trade Liberalization
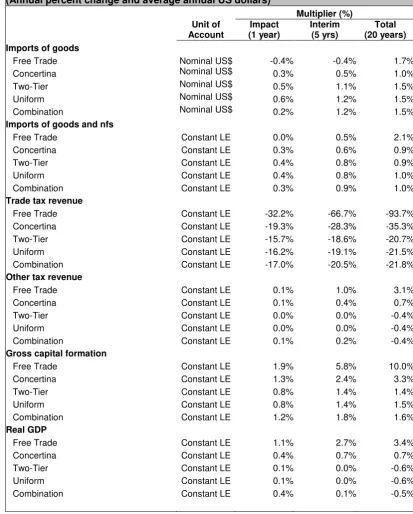
The magnitude of the influence of trade policy reform on fiscal revenue, real economic activity (GDP, consumption, investment, imports and exports) and price-related variables (interest rates and the prices) are calculated through multiplier analysis. The first-period effect is the impact multiplier; the interim multiplier measures the effect after 5 years, when full implementation of the new tariff structure takes place, and the cumulative multiplier is measured at year 20, a period of time that is sufficient for all dynamic adjustments to the new tariff structure to occur.
Table ES2 illustrates the effect of alternative tariff strategies on imports, fiscal revenue, investment, and the overall economy activity of Egypt. The strategies cover those of concertina, two-tier, uniform and a combination of two-tier and uniform methods. A free trade strategy is also included. In general, the results are consistent with expectations about the operation and effect on the Egyptian economy from trade liberalization. In all cases, the tariff cuts have an immediate impact on the overall import value, fiscal revenue and investment activity. The interim response after 5 years is about two-thirds that of the total long-run response, suggesting a fairly quick response to the tariff changes. In all but the free-trade strategy, the reduction in tariffs leads to an increase in the value of imports. In the case of free trade, the high degree of restrictiveness of the trade regime for important products having little, if any price responsiveness associated with tariff cuts. Since there are a number of important imported products having high tariffs and a price-inelastic demand schedule, their effect tends to dominate the overall results.
xiii
Table ES2
Multiplier Analysis of Alternative Tariff Structures on Key Macroeconomic Variables (Annual percent change and average annual US dollars)
Unit of Account
Multiplier (%) Impact
(1 year)
Interim (5 yrs)
Total (20 years)
Imports of goods
Free Trade Nominal US$ -0.4% -0.4% 1.7%
Concertina Nominal US$ 0.3% 0.5% 1.0%
Two-Tier Nominal US$ 0.5% 1.1% 1.5%
Uniform Nominal US$ 0.6% 1.2% 1.5%
Combination Nominal US$ 0.2% 1.2% 1.5%
Imports of goods and nfs
Free Trade Constant LE 0.0% 0.5% 2.1%
Concertina Constant LE 0.3% 0.6% 0.9%
Two-Tier Constant LE 0.4% 0.8% 0.9%
Uniform Constant LE 0.4% 0.8% 1.0%
Combination Constant LE 0.3% 0.9% 1.0%
Trade tax revenue
Free Trade Constant LE -32.2% -66.7% -93.7%
Concertina Constant LE -19.3% -28.3% -35.3%
Two-Tier Constant LE -15.7% -18.6% -20.7%
Uniform Constant LE -16.2% -19.1% -21.5%
Combination Constant LE -17.0% -20.5% -21.8%
Other tax revenue
Free Trade Constant LE 0.1% 1.0% 3.1%
Concertina Constant LE 0.1% 0.4% 0.7%
Two-Tier Constant LE 0.0% 0.0% -0.4%
Uniform Constant LE 0.0% 0.0% -0.4%
Combination Constant LE 0.1% 0.2% -0.4%
Gross capital formation
Free Trade Constant LE 1.9% 5.8% 10.0%
Concertina Constant LE 1.3% 2.4% 3.3%
Two-Tier Constant LE 0.8% 1.4% 1.4%
Uniform Constant LE 0.8% 1.4% 1.5%
Combination Constant LE 1.2% 1.8% 1.6%
Real GDP
Free Trade Constant LE 1.1% 2.7% 3.4%
Concertina Constant LE 0.4% 0.7% 0.7%
Two-Tier Constant LE 0.1% 0.0% -0.6%
Uniform Constant LE 0.1% 0.0% -0.6%
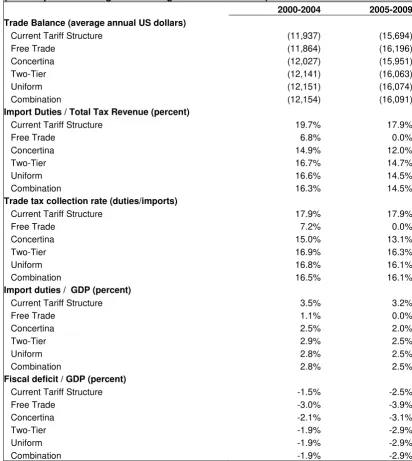
Table ES3 provides some additional indicators of the alternative tariff strategies. As expected, the smaller expansion of imports under the concertina method generates a lower trade deficit than under the other strategies. The concertina’s lower average tariff rate, however, has a less favorable impact on the Government’s overall tax
Table ES3
Impact of Alternative Tariff Structures on Key Macroeconomic Variables (Annual percent change and average annual US dollars)
2000-2004 2005-2009
Trade Balance (average annual US dollars)
Current Tariff Structure (11,937) (15,694)
Free Trade (11,864) (16,196)
Concertina (12,027) (15,951)
Two-Tier (12,141) (16,063)
Uniform (12,151) (16,074)
Combination (12,154) (16,091)
Import Duties / Total Tax Revenue (percent)
Current Tariff Structure 19.7% 17.9%
Free Trade 6.8% 0.0%
Concertina 14.9% 12.0%
Two-Tier 16.7% 14.7%
Uniform 16.6% 14.5%
Combination 16.3% 14.5%
Trade tax collection rate (duties/imports)
Current Tariff Structure 17.9% 17.9%
Free Trade 7.2% 0.0%
Concertina 15.0% 13.1%
Two-Tier 16.9% 16.3%
Uniform 16.8% 16.1%
Combination 16.5% 16.1%
Import duties / GDP (percent)
Current Tariff Structure 3.5% 3.2%
Free Trade 1.1% 0.0%
Concertina 2.5% 2.0%
Two-Tier 2.9% 2.5%
Uniform 2.8% 2.5%
Combination 2.8% 2.5%
Fiscal deficit / GDP (percent)
Current Tariff Structure -1.5% -2.5%
Free Trade -3.0% -3.9%
Concertina -2.1% -3.1%
Two-Tier -1.9% -2.9%
Uniform -1.9% -2.9%
xv
revenue and, as a consequence, it generates a larger fiscal deficit during the forecast period. Given the similarity in the average tariff rates between the two-tier and uniform tariff strategies, these two strategies and their combined form produce little, if any, differences in their fiscal impact.
Exchange Rate Adjustments during Trade Liberalization
A devaluation is often needed to counter the trade balance effect of trade liberalization. In the present model, the overall results of the estimated import and export demand functions, as well as foreign direct investment, support generalizations to the effect that the exchange rate significantly impacts on Egypt’s balance of payments. For the Government’s fiscal position, the devaluation increases the domestic currency value of imports and the associated trade tax revenue. On the expenditure side, the fall in the relative price of tradables and rise in that of wages and non-tradables produces a less than proportional response of the exchange rate devaluation to that of trade liberalization because of the substitution in production or consumption of tradables and non-tradables. Trade liberalization will cause the private sector price of non-tradables to rise. Since the Government is either exempt from tariffs or pays the tariff to itself, the liberalization of trade does not impact on the pubic sector’s cost of tradables. But in the case of a devaluation, the relative cost of tradables to the public sector rises, thereby worsening the fiscal deficit and requiring overall expenditure cutbacks. The experience of other countries suggests that these fiscal deficit effects need to be corrected early in the trade and exchange rate reform processes.
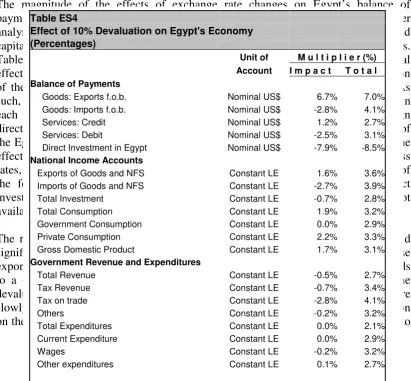
[image:16.595.94.506.430.811.2]The magnitude of the effects of exchange rate changes on Egypt’s balance of payments and the economy in general can be readily calculated through multiplier analysis. The results indicate how exchange rate changes influence the current and capital accounts, the overall balance of payments, and the national income accounts. Table ES4 illustrates the effect of a one-time 10 percent devaluation in Egypt’s real effective exchange rate. The devaluation is based on an across-the-board devaluation of the Egyptian pound relative to each of the country’s major trading partners. As such, it considers the effect of a real cross-rate devaluation of the Egyptian pound in each of its major export products and geographic markets. For imports and foreign direct investment, the devaluation is at the world market level, since a devaluation of the Egyptian pound would not influence the source of Egypt’s imports. Although the effect of exchange rate changes on foreign direct investment does not consider cross rates, it is likely that Egypt’s exchange rate changes relative to the home country of the foreign investors would significantly impact on the level of foreign direct investment. However, data on investment inflows by country of origin were not available for that type of analysis in this study.
The results show that a 10 percent real effective exchange rate devaluation would significantly impact on Egypt’s economy. In the balance of payments, merchandise exports adjust almost entirely within the first period. A 10 percent devaluation leads to a 6.7 percent expansion in the US dollar value of exports in the year of the devaluation and a 7 percent expansion in the medium term. Imports adjust more slowly, but their response to the feedback effect between the effect of the devaluation on the balance of payments and the national income account eventually leads them to
Table ES4
Effect of 10% Devaluation on Egypt's Economy
(Percentages)
Unit of M u l t i p l i e r (%)
Account I m p a c t T o t a l
Balance of Payments
Goods: Exports f.o.b. Nominal US$ 6.7% 7.0%
Goods: Imports f.o.b. Nominal US$ -2.8% 4.1%
Services: Credit Nominal US$ 1.2% 2.7%
Services: Debit Nominal US$ -2.5% 3.1%
Direct Investment in Egypt Nominal US$ -7.9% -8.5%
National Income Accounts
Exports of Goods and NFS Constant LE 1.6% 3.6%
Imports of Goods and NFS Constant LE -2.7% 3.9%
Total Investment Constant LE -0.7% 2.8%
Total Consumption Constant LE 1.9% 3.2%
Government Consumption Constant LE 0.0% 2.9%
Private Consumption Constant LE 2.2% 3.3%
Gross Domestic Product Constant LE 1.7% 3.1%
Government Revenue and Expenditures
Total Revenue Constant LE -0.5% 2.7%
Tax Revenue Constant LE -0.7% 3.4%
Tax on trade Constant LE -2.8% 4.1%
Others Constant LE -0.2% 3.2%
Total Expenditures Constant LE 0.0% 2.1%
Current Expenditure Constant LE 0.0% 2.9%
Wages Constant LE -0.2% 3.2%
Other expenditures Constant LE 0.1% 2.7%
expand by more than their level under a constant exchange rate. Initially, the value of imports would decline, but the expansion in real GDP associated with the improved balance of trade on goods and non-factor services eventually leads to an increase in imports, albeit by a substantially smaller growth rate than that of exports. A similar situation to that of merchandise trade occurs with trade in services. In the capital account, the devaluation leads to a substantial contraction in foreign direct investment. The reason is that the real effective exchange rate devaluation increases the cost of imported material inputs and thereby lowers the incentive to expand cross-border production facilities in Egypt. It is likely, however, that with lower costs of imported material inputs under reduced trade barriers and an unprotected market, foreign direct investment will shift from inward-oriented production to outward-oriented production. These structural shifts are not considered in the present model, but could be introduced were more details FDI information available for industries.
With the 10 percent devaluation, the fiscal situation improves in the medium run, notwithstanding an initial contraction in trade taxes of 2.8 percent below the equivalent revenue with a constant exchange rate. However, trade taxes expand by over 4 percent above the constant exchange rate solution in the medium term because of the economic growth induced expansion in imports. Real GDP grows by nearly 2 percent more than without a change in the real exchange rate, and it expands by over 3 percent in the medium term. In the short run, the expansion is driven by private consumption, and in the medium term it is private consumption, gross capital investment and exports that generate the economic expansion.
These results point to the effectiveness of exchange rate changes in Egypt as an equilibrating instrument for the current account and one that can be used to replace trade restrictions as an instrument with which to achieve a sustainable medium-term external position. For fiscal revenue the results show that the elimination of the overvaluation of the Egyptian pound expands the share of trade taxes following the initial contraction and, because of the positive tax revenue effect, the devaluation leads to a medium-term improvement in the fiscal balance. Moreover, the elimination of the overvalued currency substantially expands the real value of imports measured in domestic prices. As a result, there are positive medium-term effects on the fiscal balance from the larger domestically priced tax base and the larger tax revenue generated from increased investment and consumption by the private sector.
xvii
1.0 Introduction
II. 1.1 Transformation of the Economy
The Egyptian economy has undergone large and fundamental reforms during the last decade. Macroeconomic stability and the liberalization of markets have supported the economy’s favorable growth rates and the population’s improved living standards by attracting domestic and foreign private investment and encouraging greater trade. The Government of Egypt’s (GOE) strategy for stabilization has been rooted in policies aimed at (a) establishing the fundamental conditions needed for internal and external balance, (b) pegging the exchange rate, and (c) removing price distortions through economic reforms encompassing trade liberalization, fiscal reform, privatization and deregulation.
Internal balance in output and inflation has been achieved through fiscal stabilization and monetary restraints. The successful reduction in the fiscal deficit from 20 percent of gross domestic product (GDP) in 1990/91 to around 1 percent in 1998/99 reflected both revenue increases and expenditure cutbacks. The earlier fiscal deficits and large liquidity expansion need to finance those deficits had helped to maintain annual
inflation rates of around 20 percent in the 1980s. With fiscal austerity, inflation decelerated to 7 percent by 1996, eventually averaging 4 percent after 1997. The Government opted to use the exchange rate as a nominal anchor, and that disinflation strategy was supplemented by strict monetary and credit controls. As Subramanian (1997) points out, “exchange rate stability was a consummation devoutly to be pursued and not just a means to achieving broader price stability. Moreover, contemporaneous movements in the nominal rate in the late 1980s and inflation meant that the pass-through effect to domestic prices was perceived as important and an exchange rate anchor was seen as having merit in containing this source of inflationary pressure.” The exchange rate was unified in 1991, and in 1993 interest rates were liberalized and lending limits to the public and private sector eliminated. During this period of stabilization, the Egyptian pound moved in a narrow range vis-à-vis the dollar and any upward or downward pressure on the exchange rate was absorbed through passive intervention.
The Central Bank of Egypt’s (CBE) monetary controls were effective under a stable exchange rate system with limited capital mobility. However, as we shall see in later chapters, those monetary controls became more difficult to implement under an open capital market and pegged exchange rate. Nevertheless, the Government succeeded in reversing the earlier dollarization of the economy in response to expectations of an exchange rate depreciation occasioned by weak external balances and inflationary pressures. Initially, the reversal occurred because of real interest rate differentials of
0 5 10 15 20
1988/89 1990/91 1992/93 1994/95 1996/97 1998/99
around 6 percentage points between Egyptian and dollar-denominated assets starting in 1992 and, except for a brief period in 1995, continuing through 1998. Once capital inflows and foreign exchange reserves began to expand in response to the stable exchange rate and control over inflation, investor confidence returned and demand for foreign currency holdings abated.1
External balance was initially achieved through a series of nominal depreciations between 1989 and 1991 that helped to reverse the large current account deficits during 1991-93. Adjustments of the trade balance did not, however, contribute as much to the improvement as did those of the services balance. Merchandise exports contracted in the early part of the decade and remained sluggish until 1995. Although those exports grew by 11 percent annually in 1995-97, they fell sharply in 1998 as a result of the Asian crisis-induced global trade recession.
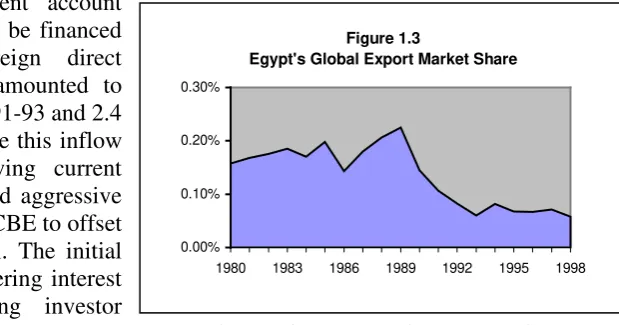
Under these conditions, the value of goods exported at the end of the 1990s only reached about two-thirds of its existing value at the beginning of the decade and, consequently, Egypt’s share of world trade fell from 0.14 to 0.06 percent during the decade (Figure 1.3). In contrast, merchandise imports expanded by nearly 50 percent during the decade, notwithstanding cutbacks in 1991-92. The trade deficit has been only partly compensated by income from invisible transactions in the form of tourism receipts, Suez Canal dues and, to a lesser extent, workers’ remittances, and these revenue sources tend to be unstable. Tourism revenue was affected by the Gulf War in the early part of the decade and subsequent acts of domestic terrorism. Oil revenue tends to vary with world petroleum prices, remittances depend largely on petroleum prices movements since most workers are in oil-producing countries, and canal dues have stagnated (Licari, 1997).
[image:19.595.93.284.156.332.2]Much of the growing current account deficit has increasingly had to be financed from capital inflows. Foreign direct investment (FDI) in Egypt amounted to nearly 1 percent of GDP in 1991-93 and 2.4 percent of GDP in 1994. While this inflow helped to finance the growing current account deficit, it also required aggressive sterilization on the part of the CBE to offset the increase in foreign capital. The initial impact of sterilization on lowering interest rates lent support to rising investor
confidence in the pegged exchange rate system (Subramanian, 1997), but FDI and other net capital inflows fell short of the current account deficit and, as a result, the
1 For an analysis of the Egyptian stabilization experience in the 1990s, see Subramanian (1997).
-4% 0% 4% 8%
[image:19.595.240.550.547.709.2]1988 1990 1992 1994 1996 1998
Figure 1.2
Current Accout Balance as a Percent of GDP
Figure 1.3
Egypt's Global Export Market Share
0.00% 0.10% 0.20% 0.30%
xix
deficit averaged $1.3 billion annually between 1994 and 1998. The inability to service external debt obligations through capital inflows during this period led to exceptional financing, including accumulation of arrears on external debt service, totaling over $10 billion in 1994-98.
Notwithstanding these difficulties, there is no doubt that Egypt has prospered under its macroeconomic policies. The benefits of the Government’s strategy have included low inflation, disciplined financial policy, and a stable external environment. Capital inflows have bolstered the country’s long-term growth prospects by increasing investment and confidence. Trade conditions have also improved from a decade ago. The GOE has successfully moved from import substitution policies to an export-led strategy based on a series of trade policy reforms instituted since 1993 that have aimed at liberalizing trade through three types of measures. First, import tariffs have been reduced; second, quantitative import measures have been replaced with replacement with tariffs and non-tariff barriers (NTBs) to trade have been greatly reduced; and third, exports have been promoted through the easing of administrative or ‘red tape’ procedures. While these measures have gradually opened trading activities to the private sector, the Government recognizes high levels of import restrictions remain that, despite offering domestic industries substantial protection from foreign competition, give rise to inefficiencies in the economy and reduce Egypt’s international competitiveness. The effect of these external sector developments on the economy are large since the combined value of exports and imports of goods and nonfactor services represents 40 percent of GDP.
The efficiency gains from further trade liberalization, however, have to be weighed against the Government’s strategy for achieving internal balance, largely through fiscal austerity and the maintenance of fiscal revenues. While total tax revenue since the start of the reforms has remained fairly stable relative to GDP, non-tax revenue has contracted from 14 percent of GDP in 1990/91 to less than 9 percent in 1998/99. Tax revenue has therefore had to support an increasingly larger portion of fiscal expenditures, and since taxes on international trade currently represent about one-fifth of the Government’s total tax revenue, the fiscal revenue implications of such an initiative are especially important to the GOE.
Moreover, a new round of trade liberalization under the current nominal exchange rate anchor could aggravate the trade deficit and further undermine the external imbalance. Although the pegged exchange rate system was successfully used as part of the Government’s disinflation strategy and the stability that it provided helped to attract foreign investment throughout the last decade, it also resulted in large and pervasive deterioration in Egypt’s international competitiveness. Between 1991 and 1998 Egypt’s real effective exchange rate (REER) appreciated by 66 percent, partly as a result of the nominal exchange rate appreciation, but mainly as a consequence of its substantial inflation differentials with partner countries. A reversal in that trend would ideally come about through an equilibrium exchange rate that not only would yield a current account balance that were consistent with capital inflows, but one that would also generate an internal balance in terms of output, inflation and employment.
equilibrium model to address the effects of changes in the exchange rate on the current and capital accounts. By focusing on the direct linkages between exchange rates and the balance of payments, the elasticities approach disregards the effect of the exchange rate adjustment process on the GOE’s simultaneous pursuit of internal and external balances in the economy. Nevertheless, we were able to solve the model for the optimal real effective exchange rate (and associated nominal exchange rate that yielded the desired solution) needed to achieve overall equilibrium in the balance of payments.
The present study extends the earlier elasticities-absorption approach to the balance of payments to the analysis of the consequences of tariff reforms on the Egyptian macro-economy, particularly as it relates to the fiscal revenue and balance of payments implications. From an analytical perspective, we use the Mundell-Fleming model to examine the effects of trade liberalization and exchange rate changes in an open macro-economy. The model is of an open economy in the familiar IS-LM framework that includes the determination of the trade and capital accounts of the balance of payments. Since capital movements and the extent of their mobility play a critical role in the analysis of economic policies, we also consider alternative assumptions about policies impacting on their mobility. These extensions permits us to move from a partial equilibrium perspective to one that examines trade and exchange rate policies in the context of Egypt’s macroeconomic fundamentals. Furthermore, while trade liberalization by itself is likely to improve the efficiency of the economy and therefore impact on output and employment, it may also aggravate the current account imbalance. We therefore include in the analysis complementary exchange rate adjustments that would help to produce a sustainable balance of payments and move the Egyptian economy closer to overall equilibrium.
III. 1.2 Modeling Trade and Exchange Rate Policies
The major characteristics that need to be considered in the design and implementation of a macroeconomic model for Egypt concern the transmission of economic changes in the economy. The transition process accompanying Egypt’s transformation from a centrally planned to market economy to the introduction of fundamental reforms in the socio-economic system that altered the role of prices in the economy, changed institutional structures, developed the private sector, restructured industries, created an autonomous banking system, and liberalized financial markets. Modeling these processes requires the explicit recognition of how the transmission mechanism affects development in the real and financial sectors of the economy. One approach is to incorporate uncertainty in the model and measure its effects on consumption and investment patterns. Another way is to include the propagation mechanism for the adjustment process on the cost side of the model, and use it to determine possible effects of incomes policies on price level increases and the rate of inflation. The inclusion of these transmission mechanisms is particularly important since there is general consensus that macroeconomic stabilization needs to be addressed early on in the reform process.
xxi
systems. In contrast, the industrial countries are more likely to have adopted a floating exchange rate system without restrictions on capital movements. While macroeconomic systems often avoid modeling capital controls, the explicit introduction of those controls in the present model changes the mechanism through which interest rate variations affect the economy. Modeling the mechanism through which economic policies affect consumption, investment, and the trade balance can help to ensure that policy instruments are correctly combined to achieve stability and growth targets for the Egyptian economy.
The movement towards more flexible market-determined prices has also brought about fundamental changes in the way businesses and households respond to economic conditions. In modeling economic behavior, these changes imply a greater responsiveness of economic agents to changes in relative prices, and therefore possible parameter changes in the system of equations.2 If parameter changes occur, then the use of time-invariant parameters can make the system of equations unstable. The alternative approach consists of the introduction of time-varying parameters that capture the transition process in the structure of the economic system. These types of parameters can introduce an element of subjectivity in the operation of the model, and a decision to adopt time-varying parameters therefore should be approached with caution.
Another manifestation of the transition process that needs to be considered in the model for Egypt concerns household and business adjustments to fundamental changes in operating procedures. The introduction of tariff reforms, for example, can create assimilation difficulties for many enterprises, particularly in terms of product and service pricing. These adjustment difficulties reflect the decades of operation under import-substitution policies. It is therefore important that the analytical framework be developed in such a way as to reflect changes in trade policy measures associated with adjustment programs, including those associated with further tariff reforms.
The opening up of the economy and the ability to attract capital inflows, especially in the form of foreign direct investment, have been critical to Egypt's economy. Modeling the reform process in Egypt therefore requires that explicit consideration be given to ongoing changes in foreign markets and domestic institutions affecting trade. Consequently, the balance of payments component of the model needs be sufficiently disaggregated to permit the consideration of trade and exchange rate policies at a fairly detailed level. Moreover, as trade policy reforms take hold, cost and price competitiveness are becoming more strongly related to trade and investment flows, and the ability to measure the transmission effects of relative price changes on the domestic and external sectors is becoming increasingly important.
2
Initial developments of macroeconomic modeling of transition economies were often based on the use of a vector autoregressive (VAR) system. More recently, the use of theory-consistent structural models, particularly those based on dynamic time-series equations systems, has been found to forecast better for long horizons, especially when the equations take the form of the error-correction mechanism (ECM).3 Following this methodology, the present macroeconomic model aims to provide a theory-consistent representation of the general structure of the Egypt economy and, as such, it offers real and financial sector forecasting and policy simulation capabilities targeted to the needs of the GOE. The model serves a dual purpose. First, it provides a framework for making rational and consistent predictions about Egypt's overall economic activity, the standard components of the balance of payments, and the production and expenditure concepts of the national accounts. Secondly, it offers a means to quantitatively evaluate the impact of trade and exchange rate policies and other initiatives on the Egyptian economy, and assess the feedback effects that changes in key macroeconomic variables of the economy produce in other sectors. These two objectives are, of course, closely related since the capacity to make successful predictions depends on the model's ability to capture the interrelationships between the real and financial sectors of the economy.
The modeling procedure has sought to account for the structure of the Egyptian economy, the availability of data, and the degree of stability of time-series estimates of parameters during the country's transition process.4 The nature of the transition process of the Egyptian economy during the last decade has motivated the design of a model that can grow and evolve with the economy. The present model therefore aims to provide a mechanism to link policies and targets while, at the same time, providing an easy and adaptable means of both forecasting key macroeconomic variables and simulating the interrelationships between economic policy initiatives. As such, the model provides a relatively parsimonious representation of the Egyptian economy that allows for considerable flexibility in its usage for forecasting, selection of the policy mix and instruments for the targets of a program, and determination of the appropriate sequencing of policy changes.
IV. 1.3 Scope of the Study
This report is organized as follows:
♦ Chapter 1 provides a general introduction to the macroeconomic framework of the Egyptian economy during the last decade and the motivation for the construction of the model.
♦ Chapter 2 examines key time series of the Egyptian economy and dynamic specification used to characterize economic relationships.
♦ Chapter 3 describes the modeling framework for the real sectors of the economy.
3
See, for example, Banerjee, Dolado, Galbraith, and Hendry (1993), Chapter 11, and references therein.
4
xxiii
♦ Chapter 4 presents the modeling framework for the money market and fiscal sector.
♦ Chapter 5 sets forth the modeling framework for the balance of payments and the foreign exchange market.
♦ Chapter 6 examines the effectiveness of trade policy reforms and macroeconomic policy instruments under alternative exchange rate regimes, and it describes the major blocks of the model and explains the system of equations as a whole.
♦ Chapter 7 describes the solution of the system of equations as a whole, and charts the fiscal revenue implications of trade liberalization and exchange rate reforms.
♦ Chapter 8 provides a summary and sets forth some of the major conclusions.
♦ The Annex lists the model specification in the Eviews econometric software program used to estimate and simulate the macroeconomic model.
♦ The Statistical Appendix contains the data used in the construction of the model.
2.0 Characterization of the Egyptian Economy
The present modeling procedure has sought to account for the structure of the Egyptian economy, the availability of data, and the degree of stability of time-series estimates of parameters during the country's transition process. The nature of the transition process over the last decade has motivated the design of a model that can grow and evolve with the economy. The present form of the model therefore provides a relatively parsimonious representation of the economy’s principal relationships, which are highlighted in this and subsequent chapters.
V. 2.1 National Income Accounts and the Balance of Payments
The present model is based on data classified according to the United Nations (UN) national accounts system. The main aggregate, GDP, is calculated by sector of production origin and use, or by type of expenditures, utilizing the following accounting identity:
Production = Expenditures
Value added in: Investment
Primary sector + Private consumption + Secondary sector + Government consumption + Tertiary sector + Balance of goods
and non-factor services
= GDP = GDP
To arrive at overall GDP, the model derives solutions for expenditure concepts and uses those results to solve for production levels. In that sense, the model is demand-driven. There are four major blocs: the national income accounts bloc, the monetary sector bloc, the fiscal sector bloc, and the balance of payments bloc. The national income accounts bloc contains a considerable amount of information about interrelationships between the endogenous variables in the system in order to capture feedback effects in the economy. The monetary sector bloc provides information about the financial links to the real and financial sectors. It also incorporates information about the relationship between changes in foreign exchange assets in the balance of payments and changes in the supply of money. The fiscal sector contains details of revenue, especially that based on international trade taxes, and it shows how the monetarization of the fiscal deficit affects both the real and financial sectors. The balance of payments bloc generates information about the major balance of payments components, especially trade of different commodity classifications and foreign direct investment, and it yields solutions for the balance of goods and non-factor services and foreign investment that are used in the national income accounts. Changes in net foreign assets are used in the monetary sector bloc, and changes in international trade taxes are linked to the fiscal sector bloc.
VI. 2.2 Structure of Trade
xxv
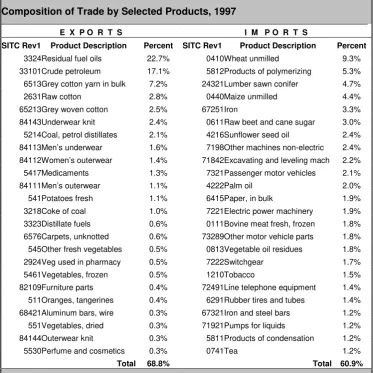
based on detailed information at the product level to permit both volume and value information to be obtained for all of Egypt's exports and imports. Data based on the 5-digit level of the Standard International Trade Classification (SITC), Revision 1, nomenclature were extracted for all of Egypt's trade in the period 1970-98. The results provided information on Egypt's exports by country of destination and its imports by country of origin.
For imports, the selection of the products to be modeled has been based on the contribution of the most important products imported to the total value of imports in 1997. There is a high degree of concentration in imports: the top 10 products together account for nearly 40 percent of Egypt’s total expenditures on imports. Those products consist of unmilled wheat, products of polymerizing, sawn lumber, unmilled maize, iron and steel, raw beet and cane sugar, sunflower seed oil, excavating and leveling machines, other non-electric machines, and passenger motor vehicles. The next ten products contribute another 15 percentage points, and the top 24 imports account for over 60 percent of the total value of imports.
For exports, the selection of the products to be modeled has been based on the contribution of the most important products exported in 1997. Table 2.1 shows the contribution of the top 24 products to total exports. The top two products (residual fuel oils and crude oil) together account for 40 percent of export earnings. Cotton and textile-related products account for another 20 percentage points, and fruits and vegetables contribute little over 3 percentage points.
These export data are disaggregated by country of destination to measure the effect of bilateral real effective exchange rate changes on Egypt's balance of payments. Based on Egypt’s dominant geographic distribution, exports are aggregated into the three major regional markets:
North America (composed of Canada and United States)
European Union (composed of Austria, Belgium, Denmark, Finland, France, Germany, Greece, Ireland, Italy, Luxembourg, Netherlands, Portugal, Spain, Sweden, United Kingdom)
Middle East (composed of Israel, Kuwait, Lebanon, Qatar, Saudi Arabia, and the United Arab Emirates)
VII. 2.3 Capital Movements and the Monetary Sector
[image:27.595.145.519.127.501.2]The interrelations between the current account and the capital account in developing and emerging market economies such as Egypt have changed dramatically since the beginning of the rapid globalization of capital markets in the late 1980s. Wong and Carranza (1998) have provided a concise analysis of these changes. According to the authors, domestic macroeconomic and external sector policies before globalization generally focused on the stabilization of the current account. Capital movements were regarded as a means of financing current account deficits and therefore reflected the country’s current account position. Since the early 1990s, however, capital movements have increasingly become the cause of current account instability, so that stabilization of the balance of payments has come to include both the current and capital accounts.
Table 2.1
Composition of Trade by Selected Products, 1997
E X P O R T S I M P O R T S
SITC Rev1 Product Description Percent SITC Rev1 Product Description Percent
3324 Residual fuel oils 22.7% 0410 Wheat unmilled 9.3%
33101 Crude petroleum 17.1% 5812 Products of polymerizing 5.3%
6513 Grey cotton yarn in bulk 7.2% 24321 Lumber sawn conifer 4.7%
2631 Raw cotton 2.8% 0440 Maize unmilled 4.4%
65213 Grey woven cotton 2.5% 67251 Iron 3.3%
84143 Underwear knit 2.4% 0611 Raw beet and cane sugar 3.0%
5214 Coal, petrol distillates 2.1% 4216 Sunflower seed oil 2.4% 84113 Men’s underwear 1.6% 7198 Other machines non-electric 2.4% 84112 Women’s outerwear 1.4% 71842 Excavating and leveling mach 2.2%
5417 Medicaments 1.3% 7321 Passenger motor vehicles 2.1%
84111 Men’s outerwear 1.1% 4222 Palm oil 2.0%
541 Potatoes fresh 1.1% 6415 Paper, in bulk 1.9%
3218 Coke of coal 1.0% 7221 Electric power machinery 1.9%
3323 Distillate fuels 0.6% 0111 Bovine meat fresh, frozen 1.8%
6576 Carpets, unknotted 0.6% 73289 Other motor vehicle parts 1.8% 545 Other fresh vegetables 0.5% 0813 Vegetable oil residues 1.8%
2924 Veg used in pharmacy 0.5% 7222 Switchgear 1.7%
5461 Vegetables, frozen 0.5% 1210 Tobacco 1.5%
82109 Furniture parts 0.4% 72491 Line telephone equipment 1.4%
511 Oranges, tangerines 0.4% 6291 Rubber tires and tubes 1.4%
68421 Aluminum bars, wire 0.3% 67321 Iron and steel bars 1.2%
551 Vegetables, dried 0.3% 71921 Pumps for liquids 1.2%
84144 Outerwear knit 0.3% 5811 Products of condensation 1.2%
5530 Perfume and cosmetics 0.3% 0741 Tea 1.2%
Total 68.8% Total 60.9%
xxvii
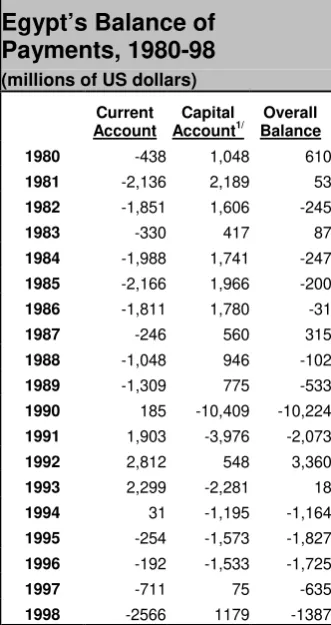
[image:28.595.101.267.105.418.2]In Egypt foreign capital movements have shifted from a net annual average inflow of $1.1 billion in the 1980s to a net annual average outflow of –$2 billion in 1990-98. This reversal has not only prevented the financing of the recent current account deficits, but also brought about significant decreases in the level of international reserves (Table 2.2). As a result, Egypt’s ability to channel external resources to supplement domestic savings in the financing of investment and to reduce or eliminate the external gap has been severely limited. If residents were to anticipate a devaluation in view of the worsening reserve position, they could start to have an increasingly positive financial position with the rest of the world, in which case deficits in the current account could create future deficits in the capital account. Eventually, if net capital outflows were not reversed, then overall equilibrium would need to be established through a reduction in domestic absorption.
Recent capital inflows into Egypt and other developing and emerging countries have generally helped economic growth, but they have also caused serious problems in macroeconomic management. Sterilization efforts to offset the monetary effects of balance of payments surpluses or deficits on the domestic money supply have often resulted in a combination of real exchange rates and real interest rates that are inconsistent with the external environment. In this situation, countries have often opted for nominal appreciation to reduce the pressure of capital inflows on the monetary base, despite high current account deficits.
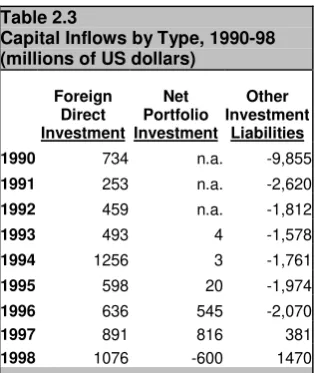
Feedback between the current and capital accounts depend on the composition of capital inflows. In the case of Egypt, recent capital inflows have been about evenly divided between portfolio investment and FDI (Table 2.3). For portfolio investment or other short-term inflows, the equilibrium real exchange rate will probably depreciate if these capital flows are used to finance consumption or unproductive activities, and it will probably appreciate if these capital inflows are channeled into productive capital formation. With FDI the effects on the current account are less clear. If cross-border production activities are directed towards exports and they rely on domestic inputs, then increased FDI inflows will improve the current account. In contrast, if cross-border production activities are oriented to the domestic market and they use foreign inputs, then the current account balance will be negatively related to FDI inflows.
Table 2.2
Egypt’s Balance of Payments, 1980-98 (millions of US dollars)
Current Account Capital Account1/ Overall Balance 1980 -438 1,048 610
1981 -2,136 2,189 53
1982 -1,851 1,606 -245
1983 -330 417 87
1984 -1,988 1,741 -247
1985 -2,166 1,966 -200
1986 -1,811 1,780 -31
1987 -246 560 315
1988 -1,048 946 -102
1989 -1,309 775 -533
1990 185 -10,409 -10,224
1991 1,903 -3,976 -2,073
1992 2,812 548 3,360
1993 2,299 -2,281 18
1994 31 -1,195 -1,164
1995 -254 -1,573 -1,827
1996 -192 -1,533 -1,725
1997 -711 75 -635
1998 -2566 1179 -1387
1/
Includes errors and omissions.
On the monetary policy side, the CBE has consistently aimed to stabilize prices and the exchange rate. Monetary control has been facilitated with the introduction of bank-by-bank credit ceilings, improvements in the required reserve arrangements, and a reduction in the role of central bank refinancing credit. Domestic bank financing of the fiscal budget has been avoided and the rate of growth of credit to state enterprises has been somewhat curbed. Real interest rates on household deposits have been positive since the early 1990s.
The major monetary instruments are credit ceilings, reserve requirements, and refinancing facilities. The GOE uses instruments to achieve targets for the growth of monetary aggregates and credit. Ceilings initially were imposed only on state-owned commercial banks, but later were extended to other banks. The required
reserve ratio has been unified across institutions and types of deposit, and the refinancing rate has been unified. Treasury bills are auctioned and mostly bought by the commercial banks.
VIII. 2.4 Characteristics of the Time Series Data
The first step in modeling the Egypt economy is to study the data-generating processes of the key variables in the economy. There exist two possible approaches to estimating the behavioral relationships underlying the data-generating process. The first approach consists of the utilization of annual data since the reforms introduced in the early 1990s; the second involves the utilization of quarterly data in the recent past to account for the structural changes in trade and those in the domestic economy. The selection criterion should be based on purely statistical grounds, independent of subjective preferences. As such, the use of descriptive statistics and tests can help to determine whether one data set is preferable to that of another.
Annual data are consistent with the level of periodicity of the national income and balance of payments accounts. In principle, one would expect that the long-term relationships between consumption and income, between investment and output, between imports of primary and intermediate products and output, between imports of final products and income would be cointegrated. Variables are said to be cointegrated if individually each is nonstationary but there exists a linear combination of the variables that is stationary. An error correction mechanism (ECM) can show how adjustments occur between variables to correct for short-term disequilibrium associated with the long-term equilibrium growth path of the variables.
In the market-oriented system of the Egyptian economy, changes in prices, interest rates and exchange rates are generally not expected to impact on the long-run equilibrium growth path of the economy. Instead, the economy has a transient response to changes in these variables, and it is appropriate to constrain their
long-Table 2.3
Capital Inflows by Type, 1990-98 (millions of US dollars)
Foreign Direct Investment Net Portfolio Investment Other Investment Liabilities 1990 734 n.a. -9,855
1991 253 n.a. -2,620
1992 459 n.a. -1,812
1993 493 4 -1,578
1994 1256 3 -1,761
1995 598 20 -1,974
1996 636 545 -2,070
1997 891 816 381
xxix
term effects to zero.5 As such, it is important to differentiate between long-term equilibrium relationships of cointegrated variables, and the transient effects of changes in prices, interest rates, and exchange rates on the key macro variables in the present market-oriented economy.
Quarterly data can provide consistent information for the recent structure of the Egyptian economy, but the quality of the estimates for the national income and balance of payments accounts are poor since they are often derived from data of annual periodicity. Since data need to be invented in their conversion to higher frequencies, there exist few, if any, relationships between that data and actual observations for prices, interest rates, and exchange rates. Movements in these variables are often policy-related, however, and it is therefore important to capture the effects of their changes on the real and financial sectors of the economy.
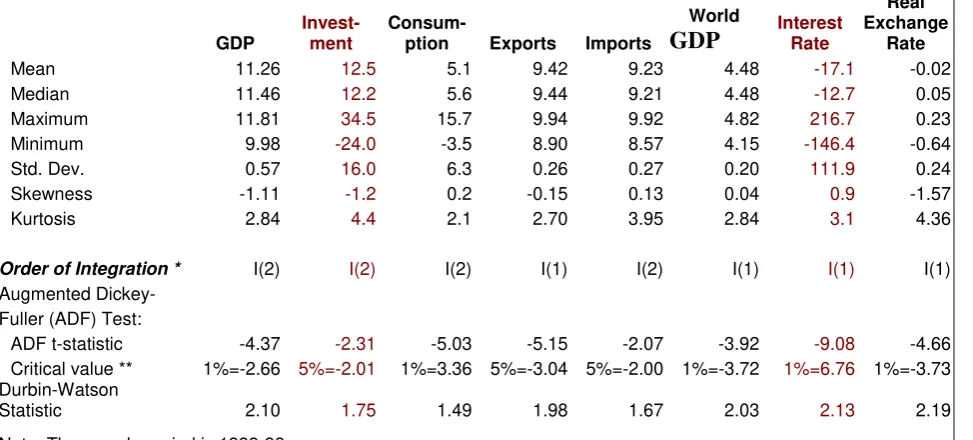
Table 2.4 presents some descriptive statistics of data series. The statistics on the first four moments (mean, standard deviation, skewness, excess kurtosis) refer to the change in the log of each variable since, if the variables are nonstationary, the statistics themselves will be nonstationary; moreover, the log change is an approximation of the percentage change, so that the minimum and maximums are the minimum and maximum percentage change of each variable, and the standard deviation is expressed as a percentage.
The statistics generally follow the pattern of similar ones for developing and transition economies (see for example, Engel and Meller, 1993). For the national income account components, the standard deviations range from a low of 6.3 percent for consumption to a high of 19.6 percent for imports. For the interest rate and the exchange rate, the standard deviations are much larger. All the variables have excess kurtosis, indicating that the distributions have fat tails, and implying that there is a large probability of wide fluctuations, compared with those that would be expected from changes in series having a normal distribution. The tests reject normality for these variables.
5