Munich Personal RePEc Archive
Deregulation of Domestic Aviation - the
First Year
Lawrence, Craig and Grimm, Curt and Jennings, Brad and
Wuest, Norm and Street, John
Bureau of Transport and Communications Economics
November 1991
B T E P u b l i c a t i o n S u m m a r y
Date
Search
Results
Subject
Series
A to Z
Exit
Deregulation of Domestic Aviation - The First
Year
Report
The Commonwealthís regulation of interstate aviation, in place for over thirty
years, came to an end at midnight on 30 October 1990. This study reviews the
developments in the last few months of regulation and in the first year of
Bureau of Transport and Communications Economics
0
CommonwealthzyxwvutsrqponmlkjihgfedcbaZYXWVUTSRQPONMLKJIHGFEDCBA
of Australia 1991 ISSN 1034-41 52ISBN 0 644 24078 4
This work is copyright. Apart from any use as permitted under the
zyxwvutsrqponmlkjihgfedcbaZYXWVUTSRQPONMLKJIHGFEDCBA
Copyright
ActzyxwvutsrqponmlkjihgfedcbaZYXWVUTSRQPONMLKJIHGFEDCBA
zyxwvutsrqponmlkjihgfedcbaZYXWVUTSRQPONMLKJIHGFEDCBA
1968, no part may be reproduced by any process without written permission from the Australian Government Publishing Service. Requests and inquiries
concerning reproduction and rights should be addressed to the Manager, AGPS
zyxwvutsrqponmlkjihgfedcbaZYXWVUTSRQPONMLKJIHGFEDCBA
Press, Australian Government Publishing Service, GPO Box 84,
zyxwvutsrqponmlkjihgfedcbaZYXWVUTSRQPONMLKJIHGFEDCBA
Canberra, ACT2601.
FOREWORD
zyxwvutsrqponmlkjihgfedcbaZYXWVUTSRQPONMLKJIHGFEDCBA
Although all transport industries have bleen included in the micro-economic reform program, it is perhaps the domestic aviation industry which has changed the most quickly and the most dramatically.
The process of change started as soon as tlie deregulation decision was taken in October
1987.
zyxwvutsrqponmlkjihgfedcbaZYXWVUTSRQPONMLKJIHGFEDCBA
From then on the major airlines began to compete with each other much more sothan in the past. The rivalry in the industry increased as the formal start of deregulation approached and has intensified since then with the entry of Compass and the pressures imposed on all carriers by the economic downturn.
The Bureau has taken this unique opportunity to observe an industry in transition and to analyse the extent to which the policy objectives are being met. In April 1989 the Bureau held a seminar to discuss the preparations being made for deregulation. In May 1991,
the developments in the first six months of deregulation were reviewed at a Bureau conference, ‘A New Era in Australian Aviation’. More recently, a draft of this paper was discussed at a workshop attended by representatives from the major airlines, academia, financial consultancies and portfolio agencies.
We are continuing to monitor deregulation to gain further insights into its effects. Further work is also underway to examine in more detail the welfare gainsfrom deregulation and
to look more closely at the impacts on remote areas and the touirsm and other industries closely linked to domestic aviation. The results of these analyses will be published
separately.
In
the preparation of this paper, Bureau staff paid a number of visits to the airlines and other organisations involved in the day it0 day operations of the industry. Usefuldiscussions were also held with a number of government agencies and industry analysts. The insights provided by the individuals concerned are gratefully acknowledged.
The study team was led by Professor Curt Grimm, Visiting Fellow in the Bureau from the School of Business and Management at the IUniversity of Maryland. He was ably assisted by Brad Jennings, Craig Lawrence and Norm Wuest. They were all able to build
on
the foundations laid by John Street.Hugh Milloy Research Manager Bureau of Transport and Communications Economics
CONTENTS
FOREWORD
ABSTRACT
SUMMARY
CHAPTER 1
CHAPTER 2
CHAPTER 3
CHAPTER 4
CHAPTER 5
INTRODUCTION
AUSTRALIA’S TWO
zyxwvutsrqponmlkjihgfedcbaZYXWVUTSRQPONMLKJIHGFEDCBA
AIRLINES POLICYHistorical overview Statistical overview
IMPACT OF DEREGULATION ON INDUSTRY STRUCTURE
Structural determinants of rivalry
Changes in industry structure since deregulation Barriers to entry
Natural barriers to entry
Firm-created barriers 10
zyxwvutsrqponmlkjihgfedcbaZYXWVUTSRQPONMLKJIHGFEDCBA
entryInstitutional barriers to entry
AIRLINE COMPETlTllON UNDER DEREGULATION
Price competition
Longitudinal analysis of fare discounting since deregulation
Cross-sectional analysis
zyxwvutsrqponmlkjihgfedcbaZYXWVUTSRQPONMLKJIHGFEDCBA
of
winter ’91 fare discountsThe trade-off between price and service quality in the business market
THE CONSUMERS’ PERSPECTIVE
-
FARESAverage revenue data
Fare changes on the Sydney-Melbourne route Passenger growth and discounting
Page iii
xi
xiii
1
3
zyxwvutsrqponmlkjihgfedcbaZYXWVUTSRQPONMLKJIHGFEDCBA
3
5
9 9 10 18 19 22 29
31
31
zyxwvutsrqponmlkjihgfedcbaZYXWVUTSRQPONMLKJIHGFEDCBA
31 35
37
39
39 41
CHAPTER 6
CHAPTER 7
CHAPTER 8
APPENDIX
zyxwvutsrqponmlkjihgfedcbaZYXWVUTSRQPONMLKJIHGFEDCBA
IAPPENDIX II
APPENDIX 111
REFERENCES
IMPACT OF DEREGULATION ON SERVICE
QUALITY
zyxwvutsrqponmlkjihgfedcbaZYXWVUTSRQPONMLKJIHGFEDCBA
Frequency
of service
zyxwvutsrqponmlkjihgfedcbaZYXWVUTSRQPONMLKJIHGFEDCBA
Load factors Non-stop services On-time performance
Accessibility to regular public transport services Choice of operator
Quality of in-cabin and on-ground services Safety
Discussion
Page
47 48 52 52 54 56 57 57 58 59
EFFECT OF DEREGULATION ON OTHER MODES OF
TRANSPORT 61
Determinants of
zyxwvutsrqponmlkjihgfedcbaZYXWVUTSRQPONMLKJIHGFEDCBA
modal choice 61Pre-deregulation 61
Deregulation
of
zyxwvutsrqponmlkjihgfedcbaZYXWVUTSRQPONMLKJIHGFEDCBA
the domestic aviation market 63CONCLUDING REMARKS
Developments so far Looking to the future
67 67 69
CHRONOLOGY OF DEVELOPMENTS IN
COMPETITION 71
FREQUENCY
OF
zyxwvutsrqponmlkjihgfedcbaZYXWVUTSRQPONMLKJIHGFEDCBA
SERVICE PROVIDED BYDOMESTIC AIRLINES 81
WELFARE CHANGES 91
93
FIG
zyxwvutsrqponmlkjihgfedcbaZYXWVUTSRQPONMLKJIHGFEDCBA
U
RES
zyxwvutsrqponmlkjihgfedcbaZYXWVUTSRQPONMLKJIHGFEDCBA
zyxwvutsrqponmlkjihgfedcbaZYXWVUTSRQPONMLKJIHGFEDCBA
2.1
2.2
3.1
3.2
3.3
3.4
3.5
3.6
3.7
3.8
3.9
5.1
5.2
5.3
5.4
5.5
6.1
111.1
Aggregate available seat kilometres and revenue passenger kilometres for Australian domestic aviation, 1976 to 1991
Australian air and rail passengers, 1976 to 1991
Distribution of passengers by ranked city pairs in 1990
Cumulative per cent of passengers ranked by city pairs in 1990
Compass routes as at 1 Septernber 1991
Airline market shares
-
revenue passenger kilometres, September quarters 1988 and 1991Airline market shares
-
passengers, September quarters 1988 and 1991Number
of
zyxwvutsrqponmlkjihgfedcbaZYXWVUTSRQPONMLKJIHGFEDCBA
domestic airlines on eachof
the top 20 routes in 1988Number of domestic airlines on each
of
the top 20 routes in 1991 Benefitsof
a hub-and-spoke neitworkOwnership structure
of
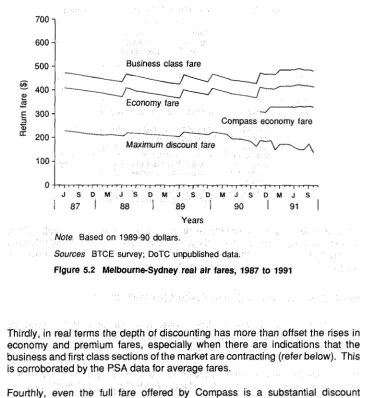
Australian domestic passenger airlines Real average revenue per passenger kilometre, 1981 to 1990Melbourne-Sydney real air fares, 1987 to 1991
Domestic airline revenue passelnger kilometres since deregulation
Domestic airline available seat kilometres since deregulation
Patronage on domestic airlines since deregulation
Percentage of flights arriving and departing within 15 minutes of the scheduled time
Page
6
6
12
13
14
16
16
17
18
21
27
40
42
43
44
44
55
TABLES
zyxwvutsrqponmlkjihgfedcbaZYXWVUTSRQPONMLKJIHGFEDCBA
Page
zyxwvutsrqponmlkjihgfedcbaZYXWVUTSRQPONMLKJIHGFEDCBA
3.1 3.2 4.1 5.1 6.1
6.2
6.3 7.1 7.2
7.3
11.1
11.2
11.3
Estimates of direct operating costs for Compass and the main incumbent airlines
Domestic passenger movements at major airports
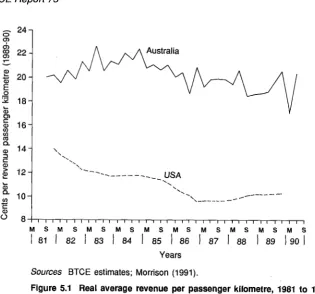
Regression results
-
discount faresTrunk route characteristics, August 1991
Comparison of regular public transport frequencies on the top 40 routes between the June quarter 1990 and the June quarter 1991
Comparison
of
domestic airline frequencies on the top 40 routes between the June quarter I990 and the June quarter 1991Comparison of domestic airline average load factors on the top 40 routes between the June quarter 1990 and the June quarter 1991
Change in air travel, 1987 to 1990
lntermodal comparison: January and May 1991
Comparison of standard Greyhound/Pioneer coach fares with discounted air fares, winter 1991
Service frequency on top 40 routes served by domestic airlines, March quarter 1990 to June quarter 1991
Average aircraft seating capaciity on top 40 routes served by domestic airlines, June quarters 1990 and 1991
Weekly service frequency on main routes served by
zyxwvutsrqponmlkjihgfedcbaZYXWVUTSRQPONMLKJIHGFEDCBA
domesticairlines, mid 1990 and mid 1991
1 3 23 36 41
49
51
zyxwvutsrqponmlkjihgfedcbaZYXWVUTSRQPONMLKJIHGFEDCBA
53
62
62
64 82
88
ABSTRACT
zyxwvutsrqponmlkjihgfedcbaZYXWVUTSRQPONMLKJIHGFEDCBA
The Commonwealth’s regulation of interstate aviation, in place for over thirty years, came to an end at midnight on 30 October 1990. This study reviews the developments in the last few months of regulation and in the first year of deregulation.
Based on the first year’s evidence, deregulation of domestic aviation in Australia has, from the consumers’ perspective, been very successful. Reliance on market forces and competition, as opposed to regulation, has so far provided clear benefits to consumers in terms of lower fares and improved service quality.
In particular, discount airfares have been much deeper and more readily available under deregulation. Between the September 1990 and June 1991 quarters, real average fares over a large sample of the top 20 routes fell by 12 per cent.
Service quaiity on a number of dimensions has also improved with deregulation. Most notably, an analysis of the servic:es provided by domestic and commuter operators on the top 40 routes indicated that there was a 21 per cent increase in the number of flights between the June quarters of 1990 and 1991.
The airlines have been able to reduce costs, but their financial performance has
been adversely affected by the recession and the increased level
of
zyxwvutsrqponmlkjihgfedcbaZYXWVUTSRQPONMLKJIHGFEDCBA
competitionin the industry.
SUMMARY
BACKGROUND
zyxwvutsrqponmlkjihgfedcbaZYXWVUTSRQPONMLKJIHGFEDCBA
The Commonwealth’s regulation of interstate aviation was in place for over thirty years. However, over time the two airlines policy began to be increasingly criticised.
In October 1987 the Government gave notice that it would terminate the Airlines Agreement in October 1990 and allow the market to operate within the constraints of the established competition policy controls applicable to industry generally. In announcing its decision, the Government indicated that its objective was to create an environment which would foster:
.
increased responsiveness by airlines to consumer needs;a wider range of fares and types
zyxwvutsrqponmlkjihgfedcbaZYXWVUTSRQPONMLKJIHGFEDCBA
of
services to provide enhanced travelm increased competition and pricing flexibility, leading to greater economic
opportunities;
efficiency in the industry; and
a continuation of Australia’s world-renowned aviation safety record.
The two airlines policy came to an end at midnight on 30 October 1990. This paper reviews the developments in the last few months of regulation and in the first year of deregulation. The work follows the industrial organisation paradigm that industrial structure influences firm conduct, which in turn shapes market performance.
DEVELOPMENTS SINCE DEREGULATION
Competition within the industry
An important goal of deregulation was increased competition, which appears to have been achieved. Industry concentration has been significantly reduced, due largely to the entry of Compass. Only one month after the formal start
of
BTCE Report
zyxwvutsrqponmlkjihgfedcbaZYXWVUTSRQPONMLKJIHGFEDCBA
zyxwvutsrqponmlkjihgfedcbaZYXWVUTSRQPONMLKJIHGFEDCBA
73zyxwvutsrqponmlkjihgfedcbaZYXWVUTSRQPONMLKJIHGFEDCBA
The emergence of Compass, with a national market share of more than 10 per cent in its first year of operation, illustrates that although some barriers to entry may be present in the industry, such barriers are not impregnable. For example, the terminal facilities available to new entrants, although limited, have allowed Compass to enter the market and there is further room for another entrant onto the busiest trunk routes. The availability of terminal access has greatly facilitated the establishment of structural conditions to achieve adequate competition under deregulation.
A regression analysis
of
zyxwvutsrqponmlkjihgfedcbaZYXWVUTSRQPONMLKJIHGFEDCBA
discount fares across the top 100 markets confirms thatthe presence of Compass in a particular market has been a significant stimulus to competition. In addition, the analysis reveals that the two incumbents are now competing with each other to a great degree, much more so now than under
regulation.
zyxwvutsrqponmlkjihgfedcbaZYXWVUTSRQPONMLKJIHGFEDCBA
Changes
to fareszyxwvutsrqponmlkjihgfedcbaZYXWVUTSRQPONMLKJIHGFEDCBA
In the months before deregulation the incumbent airlines adopted a much more flexible and innovative approach to the introduction of discount fares. This trend has intensified in the more competitive environment since deregulation. In particular, discounts have become deeper, given that highly restricted 45 percent discounts on full economy fares were generally the best available in the years before deregulation, while less restricted discounts of 60 to 70 percent have been available during 1991.
The principal source of data on the use of discount fares is the Prices Surveillance Authority (PSA), which was directed by the Government in February 1991 to monitor movements in average fares on interstate routes. The PSA has so far collected quarterly data on average fares and passenger numbers from the airlines for each of the top 20 routes and has aggregated these to provide industry average fare indices. The analysis was then focused on the seventeen top 20 routes which are either interstate or have a minimum of three operators.
The PSA has reported that, on these seventeen routes, aggregate average revenue has fallen by 9.9 per cent in nominal terms between the September 1990 and June 1991 quarters. Adjusted for inflation this means that the average fare on these routes fell by 12.2 per cent in real terms.
Moreover, since over 80 per cent of passengers fly on the top 20 routes, there has clearly been a significant reduction of fares system-wide. Even under the very conservative assumption that average fares did not change on the other routes, the fall in the real average fare across the entire domestic aviation network was about 10 percent by the end of June 1991. Since then, it is likely that average fares have fallen even further as the airlines have been engaged in the most intense fare war to date.
Summary
zyxwvutsrqponmlkjihgfedcbaZYXWVUTSRQPONMLKJIHGFEDCBA
63 per cent
zyxwvutsrqponmlkjihgfedcbaZYXWVUTSRQPONMLKJIHGFEDCBA
off
the incumbents' standard economy fares, while on a sample of 21other routes in the top 40, the maximum discount was 58 per cent less than the
standard economy fare on average.
zyxwvutsrqponmlkjihgfedcbaZYXWVUTSRQPONMLKJIHGFEDCBA
Changes to service
quality
Overall, service quality on a number of dimensions has improved since deregulation. Among the indicators
of
'service quality assessed in the report are the following:Flight frequency. An analysis of the services provided by domestic and commuter operators on the top 40 routes indicated that there was a 21 per cent increase in the number of flights between the June quarters of 1990 and 1991. As in the case of fare decreases, the benefits were distributed widely across routes and not restricted to the routes on which Compass operates. The largest increases have occurred on the BrisbaneGairns and Brisbane-Mackay routes, with increases
of
1 15 and 107 per cent respectively.Non-stop services. One
of
the main disadvantages to consumers from deregulation in the United States was a decrease in nonstop services between many locations due largely to the establishment of hub-and-spoke networks. So far there has been no evidence of hub-and-spoke networks forming in Australia, and in fact there is some evidence thlat there has been a slight increase in non-stop services since deregulation. The passengers who are able to take advantage of this trend benefit from shorter transit times and avoid the inconvenienceof
changing aircraft.On-time performance. Over the past year there have been improvements in on-time performance for aircraft arrivals and departures at the main capital city airports. This is in contrast to the situatiom in the United States after deregulation where flight delays occurred at many airports because infrastructure capacity did not keep pace with the increase in demand.
In-cabin and on-ground services. Improvements to in-cabin services have also been significant. Compass and Eastwest, with their one class cabins, have chosen to provide generous space for passengers, while Australian and Ansett now provide more space and upgraded service in the battle for market share for premium class passengers.
On the ground, business passengers ,have benefited from improvements to lounges and a range
of
services such as; valet parking.Network capacity and patronage
BTCE Report
zyxwvutsrqponmlkjihgfedcbaZYXWVUTSRQPONMLKJIHGFEDCBA
zyxwvutsrqponmlkjihgfedcbaZYXWVUTSRQPONMLKJIHGFEDCBA
73zyxwvutsrqponmlkjihgfedcbaZYXWVUTSRQPONMLKJIHGFEDCBA
year ended September 1990. The large increase in capacity between the year ended September 1990 and the year ended September 1991 may be explained in part as recovery from the airline pilots’ dispute. However, given that capacity this year has exceeded the previous all time high of 1988, which was achieved under more favourable economic circumstances, a significant component of industry growth should be attributed to stimulation of the market by incentives made possible under deregulation.
Patronage has also climbed to record levels since deregulation, despite the economic recession. The domesticairlines performed a record total of 16.1 billion revenue passenger kilometres (RPK) for the year to September 1991 and the RPK figure for the September 1991 quarter was
45
per cent higher than the corresponding figure for last year.Although data on patronage of competing modes is limited, it is clear that low discount fares have drawn significant numbers of passengers from intercity rail
and bus operators.
zyxwvutsrqponmlkjihgfedcbaZYXWVUTSRQPONMLKJIHGFEDCBA
OVERVIEW OF DEVELOPMENTS SO FAR
Based on the first year’s evidence, deregulation of domestic aviation in Australia has, from the consumers’ perspective, been very successful. Reliance on market forces and competition, as opposed to regulation, has so far provided clear benefits to consumers.
The benefits from deregulation have extended to a broad range of markets. In particular, reduced fares and improved service frequency have extended well beyond the Adelaide-Melbourne-Sydney-Brisbane corridor. Destinations such as Perth and Cairns have been among the greatest beneficiaries; indeed, the Northern Queensland tourism industry has enjoyed a dramatic turnaround, largely as a result of discount fares. While consumer benefits from discounted fares and improved frequencies have often been greatest in the markets where Compass has entered, significant benefits have extended to a broad range of markets. For example, travellers in cities such as Darwin and Hobart have also been clear beneficiaries from deregulation.
Although it is not yet possible to quantify the change in consumer surplus from deregulation, it is clear that consumer surplus has increased. Studies of the impact of deregulation on consumer surplus in other countries have shown that consumer surplus depends primarily on the level of fares, the average time
between flights (flight frequency), and the average duration
of
zyxwvutsrqponmlkjihgfedcbaZYXWVUTSRQPONMLKJIHGFEDCBA
flights. Australia’sSummary
zyxwvutsrqponmlkjihgfedcbaZYXWVUTSRQPONMLKJIHGFEDCBA
There have been bright spots as well from the carriers’ perspective. There is clearly improved production efficiency in the industry with, on average, lower cost of providing service. This is partly due to Compass’s low cost entry and partly due to the efforts by the incumbent domestic airlines to cut costs.
On the other side, the airlines have experienced the effects of a large increase
in overall capacity and greater price colmpetition during a recession.
zyxwvutsrqponmlkjihgfedcbaZYXWVUTSRQPONMLKJIHGFEDCBA
As a resultthe profitability of the airlines has been1 adversely affected. However, data are unavailable for detailed study of airline financial performance.
Although a quantification of economic effects
of
zyxwvutsrqponmlkjihgfedcbaZYXWVUTSRQPONMLKJIHGFEDCBA
domestic deregulation involvingcounterfactual estimates of both consumer and producer surplus has yet to be tackled, the evidence strongly su’ggests that economic welfare has unambiguously improved so far. The evidence is convincing that deregulation has brought about lower prices and reduced costs.
LOOKING TO
zyxwvutsrqponmlkjihgfedcbaZYXWVUTSRQPONMLKJIHGFEDCBA
THE FUTUREWhat does the future hold for the Australian domestic aviation industry? It
is
predicted that the benefits enjoyed by consumers in the first yearwill be sustained over time, although perhaps not to the same level. This prediction is in contrast to a number of recent media reports which have argued that fare discounting has caused the airlines to lose money. Thus, the argument goes, it is inevitable that discounting and fares return to pre-deregulation levels. This is a specious argument as it neglects two important flactors, namely the recessionary impact on business travel and the potential for airlines to further rationalise costs.
It is quite clear that the recession has had a dramatic impact on business travel. This loss of high yield patronage has had serious adverse financial consequences for the airlines. Both the recession and the fare discounting under deregulation have contributed to the weak financial pesformance of the airlines in the past year.
As discussed above, airlines have lproceeded with a modicum of cost rationalisation. However, the analysis inldicates that there is considerable scope for further cost rationalisation in Australian domestic aviation. Continued competition under deregulation, in co’njunction with disappointing financial performance, will be an incentive for airlines to proceed with efforts to cut costs. Thus, the most likely scenario is that as the economy improves and airlines continue with their efforts to cut costs, industry profits will improve while fare discounting will persist.
BTCE Report
73
zyxwvutsrqponmlkjihgfedcbaZYXWVUTSRQPONMLKJIHGFEDCBA
zyxwvutsrqponmlkjihgfedcbaZYXWVUTSRQPONMLKJIHGFEDCBA
will resemble more closely the experience in the first year of deregulation than the pre-deregulation experience. Indeed, competition could be enhanced by the introduction of services by more new entrants.
The competitive environment which has existed since deregulation has resulted
in significant changes to the structure of the industry.
zyxwvutsrqponmlkjihgfedcbaZYXWVUTSRQPONMLKJIHGFEDCBA
A new entrant has shownthat, although some barriers to entry exist, these can be overcome. Moreover, the presence of a new operator, with adifferent cost structure, operating practices and marketing techniques, has greatly increased the rivalry between all domestic carriers.
It is likely that these structural and behavioural changes are here to stay. In
the
zyxwvutsrqponmlkjihgfedcbaZYXWVUTSRQPONMLKJIHGFEDCBA
coming years the ownership
of
zyxwvutsrqponmlkjihgfedcbaZYXWVUTSRQPONMLKJIHGFEDCBA
the airlines may change, and the aircraft may haveCHAPTER
1
INTRODUCTION
zyxwvutsrqponmlkjihgfedcbaZYXWVUTSRQPONMLKJIHGFEDCBA
At midnight on 30 October 1990 the ‘two airlines policy’ came to an end.
zyxwvutsrqponmlkjihgfedcbaZYXWVUTSRQPONMLKJIHGFEDCBA
For thefirst time in 38 years, Australia’s interstate air services were open to free competition. This paper reviews the developments in the last few months of regulation and in the first year of deregulation. It focuses on the impact of deregulation, both on the airline industry and on the travelling public. More generally, it addresses the question: hlave the objectives of deregulation been met so far?
The structure of the paper is as follows. Chapter 2 provides an historical overview of the two airlines policy and the statistical trends during the last years of regulation. Chapter 3 lays out the theoretical basis for the work, drawing from the industrial organisation paradigm that industrial structure influences firm conduct, which in turn shapes market performance. Chapter 3 also details the salient structural features of the airline lmarket and describes how the structure has changed since deregulation. Chaptier 4 examines firm pricing conduct under deregulation and includes both longitudinal and cross-sectional assessments of pricing behaviour. A primary finding oif the chapter is that changes in market structure predict quite accurately thle pricing behaviour
of
firms under deregulation.CHAPTER
2
AUSTRALIA’S TWO AIRLINES POLICY
HISTORICAL OVERVIEW’
zyxwvutsrqponmlkjihgfedcbaZYXWVUTSRQPONMLKJIHGFEDCBA
In the early 1950s the two main airlines in Australia were the government-owned Trans-Australia Airlines (TAA) and the privately owned Australian National Airways (ANA). However, the future of ANA looked bleak in the face of strong government support for TAA. In an attempt to ensure ANA’s ongoing financial viability, and so to guarantee competitive services on the major domestic routes, the Menzies Government developed the 1952 Civil Aviation Agreement between the Commonwealth and ANA. This agreement did not exclude other carriers from operating interstate trunk route services or from importing new aircraft, nor did it attempt to restrict route access.
Despite the assistance to ANA under the 1952 agreement, the airline’s financial position continued to deteriorate and it’ was taken over by Ansett Transport Industries (ATI) in 1957.
This led to the development of the 1957 Civil Aviation Agreement, which allowed only TAA and Ansett Airways, as parties to the agreement, to operate trunk route
services. Under this version
of
zyxwvutsrqponmlkjihgfedcbaZYXWVUTSRQPONMLKJIHGFEDCBA
the two airlines policy, the industry stabilised anddeveloped in the 1960s and early 1970s. ‘This stability, combined with the viability of the main operators, helped to justify the extensive public investment in infrastructure required to introduce sophilsticated jet aircraft.
However, domestic aviation policy began to be increasingly criticised on the grounds that effective competition had not been achieved and both airlines were operating the same equipment on the same routes with the same schedules for the same fares. In response to these criticisms some changes were made to the agreement in 1972.
1. Much of the material in this historical overview is based on the paper ‘Competition policy in
domestic aviation -or the rise and fall of the! two airlines pol~cy’, prepared by
zyxwvutsrqponmlkjihgfedcbaZYXWVUTSRQPONMLKJIHGFEDCBA
D. CampbellzyxwvutsrqponmlkjihgfedcbaZYXWVUTSRQPONMLKJIHGFEDCBA
BTCE
zyxwvutsrqponmlkjihgfedcbaZYXWVUTSRQPONMLKJIHGFEDCBA
ReportzyxwvutsrqponmlkjihgfedcbaZYXWVUTSRQPONMLKJIHGFEDCBA
73
zyxwvutsrqponmlkjihgfedcbaZYXWVUTSRQPONMLKJIHGFEDCBA
The policy debate, partly stimulated by dramatic decreases in price and increases in availability of international air travel, continued through the 1970s. The end result was the introduction in 1981 of a package of legislation which remained largely unchanged until its repeal with deregulation in October 1990. The 1981 Airlines Agreement was designed to increase the level of competition within the industry, but it maintained the basic thrust of the two airlines policy as it applied to the trunk route network.
The fundamental question of the Commonwealth's role in the economic regulation of interstate aviation was addressed by the Independent Review of Economic Regulation of Domestic Aviation (May Review), commissioned by the Hawke Government in 1985.
The May Review, which
zyxwvutsrqponmlkjihgfedcbaZYXWVUTSRQPONMLKJIHGFEDCBA
took
place over about two years, was critical of theexisting arrangements and drew attention to significant public dissatisfaction with the current policy, including the widespread view that it worked to the disadvantage of consumers and encouraged the airlines to serve the high yield (business) market to the detriment of the leisure market. It found that, in comparison with its overseas counterparts, Australian aviation was characterised by relatively low labour productivity and relatively high and stable profit levels.
In October 1987 the Government gave notice that it would terminate the Airlines Agreement'in October 1990 and allow the market to operate within the constraints of the established competition policy controls applicable to industry generally (Evans 1987). In announcing its decision, the Government indicated that its objective was to create an environment which would foster:
.
a wider range of fares and types of services to provide enhanced travel.
increased competition and pricing flexibility, leading to greater economic.
a continuation of Australia's world-renowned aviation safety record. increased responsiveness by airlines to consumer needs;opportunities;
efficiency in the industry; and
In practice, the deregulation decision meant that from 31 October 1990 the Government withdrew from economic regulation of the following four matters.
Firstly, controls over the importation of aircraft were removed. These controls provided the basis for the legislative and contractual arrangements which regulated the industry.
Secondly, the detailed determination of the passenger capacity that could be provided by each trunk airline ceased. Under the two airlines policy, Ansett and Australian had equal capacity over competitive routes.2
2. In
zyxwvutsrqponmlkjihgfedcbaZYXWVUTSRQPONMLKJIHGFEDCBA
1986 the Australian National Airlines Corporation changed its trading name fromChapter 2
Thirdly, the Independent Air Fares Committee (IAFC), which set all fares for scheduled passenger services, was abolished and the Commonwealth withdrew from the determination of air fares. During the nine years in which the IAFC set fares, the revenue per passenger kilometre, averaged over Ansett, Australian and Eastwest services, decreased slightly im real terms.
Fourthly, the constraints on the entry o'f new domestic operators to trunk routes were removed.
In strict terms, the two airlines policy did not apply to interstate routes, but rather to the provision of scheduled passenger 'services over trunk routes (which
included both interstate and intrastate routes). Under the Airlines AgreementAct
zyxwvutsrqponmlkjihgfedcbaZYXWVUTSRQPONMLKJIHGFEDCBA
7987, a trunk route was defined as any route linking the following 18 trunk route centres: Adelaide, Alice Springs, Brisbane, Cairns, Canberra, Coolangatta, Darwin, Gove, Hobart, Launceston, IMackay, Melbourne, Mount Isa, Perth, Proserpine, Rockhampton, Sydney ancl Townsville.
Much of the analysis in the following (chapters focuses on the changes since deregulation on the trunk route network. However, some of the impact of deregulation has been, and will continue to be felt, on non-trunk routes serviced
by the main domestic airlines and the commuter airlines affiliated with them.
zyxwvutsrqponmlkjihgfedcbaZYXWVUTSRQPONMLKJIHGFEDCBA
STATISTICAL OVERVIEW
The airlines which supply scheduled passenger services within Australia are usually categorised in terms of domestiic or commuter operators. By definition, a domestic carrier operates scheduled regular public transport (RPT) services with aircraft with 38 seats or more or with a payload of more than 4200 kilograms; a commutercarrier operates scheduled RPT services with aircraft less than 38 seats (DoTC 1991a). At present the domestic carriers are Ansett Australia, Ansett Express, Ansett WA, Australian Airlines, Australian Airlink, Compass Airlines, Eastern Australia Airlines and Eastwest.
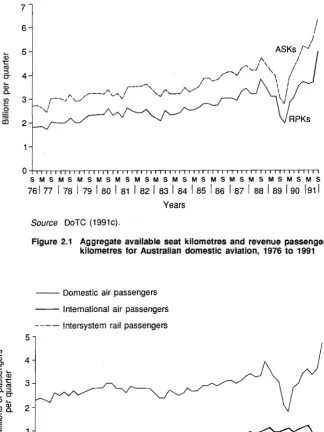
The growth in the supply, in terms of available seat kilometres (APK), and use, in terms of revenue passenger kilometres (RPK), of the services rovided by the
domestic airlines over the past 15 years are shown in figure 2.1.
t:
zyxwvutsrqponmlkjihgfedcbaZYXWVUTSRQPONMLKJIHGFEDCBA
The main features of the time series daita in figure 2.1 are:
-
the decrease in activity during the economic downturn of 1982-83;-
the period of strong growth starting in 1983 and culminating in theBicentennial and Expo activities of
zyxwvutsrqponmlkjihgfedcbaZYXWVUTSRQPONMLKJIHGFEDCBA
.I 988;BTCE Report 73
zyxwvutsrqponmlkjihgfedcbaZYXWVUTSRQPONMLKJIHGFEDCBA
zyxwvutsrqponmlkjihgfedcbaZYXWVUTSRQPONMLKJIHGFEDCBA
7 1 6
zyxwvutsrqponmlkjihgfedcbaZYXWVUTSRQPONMLKJIHGFEDCBA
I IzyxwvutsrqponmlkjihgfedcbaZYXWVUTSRQPONMLKJIHGFEDCBA
S M S M S M S M S M S M S M S M S M S M S M S M S M S M S M S
7 6 1 7 7 1 7 8 1 7 9 1 8 0 1 8 1 1 8 2 1 8 3 1 8 4 1 8 5 1 8 6 1 8 7 1 8 8 1 8 9 1 9 0 ( 9 1 (
Years
[image:21.487.87.411.73.505.2]Source DoTC (1991~).
Figure 2.1 Aggregate available seat kilometres and revenue passenger kilometres for Australian domestic aviation, 1976 to 1991
- Domestic air passengers International air passengers
"" lntersystern rail passengers
"_""
-
"""r---. ""__."""""~ C"_""""--C""S M S M S M S M S M S M S M S M S M S M S M S M S M S M S M S
76
I
77zyxwvutsrqponmlkjihgfedcbaZYXWVUTSRQPONMLKJIHGFEDCBA
I
78I
79I
80I
81I
82I
83I
84I
85I
86I
87I
88I
89I
90 191I
Years [image:21.487.82.409.364.615.2]Sources ABS (1991); BTCE unpublished data; DoTC (1991C).
Chapter 2
zyxwvutsrqponmlkjihgfedcbaZYXWVUTSRQPONMLKJIHGFEDCBA
zyxwvutsrqponmlkjihgfedcbaZYXWVUTSRQPONMLKJIHGFEDCBA
the effect
of
the pilots’ dispute in 1989-90; and
the record levels
of
activity since deregulation
of
interstate aviation
from
zyxwvutsrqponmlkjihgfedcbaZYXWVUTSRQPONMLKJIHGFEDCBA
31October
1990.It
follows
from
the data
in figure
2.1that the average load factor
for domestic
airlines
in
the period 1976
to
1989 was,
with few exceptions,
in
the range 67
to
77 per cent.
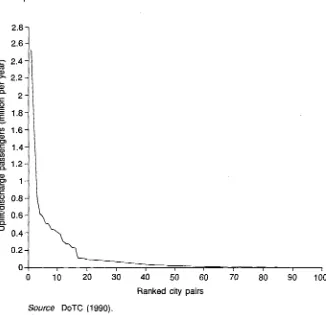
Figure
2.2shows
the variation over time
ofthe number
of
passengers carried
bythe domestic airlines (measured
in
terrrls of revenue passengers uplifted on each
flight).
In the period
from
1976 until the pilots’ dispute
in
1989-90, patronage
grew on average
by2.5 per cent per year.
To put the task performed
bythe domestic carriers into a broader perspective,
the patronage levels for intersystem rail
transport and international air travel
to
and from Australia have also been included in figure 2.2. In 1987,
for
example,
domestic airline patronage was about eight and
four
times greater than
international air and long distance rail patronage respectively. In the same year
patronage on the domestic airlines was about eleven times greater than
CHAPTER
3 IMPACT OF DEREGULATION ON INDUSTRY
STRUCTURE
zyxwvutsrqponmlkjihgfedcbaZYXWVUTSRQPONMLKJIHGFEDCBA
One of the Government’s main objectives in deregulating domestic aviation was to foster greater competition in the industry (Evans 1987). The standard paradigm in industrial organisation economics posits that the degree of rivalry among firms in an industry is largely a function of market structure. That is, structural features such as the number of sellers and buyers, barriers to entry and
the cost structures of firms will strongly influence the intensity
zyxwvutsrqponmlkjihgfedcbaZYXWVUTSRQPONMLKJIHGFEDCBA
of
rivalry amongfirms. It follows that in understanding airline behaviour since deregulation and in predicting the future competitiveness of the market, careful attention should be paid to structural conditions, in particular, to changes in structure which have occurred since deregulation,
This chapter begins with an examination of the theory regarding structural determinants of rivalry. This is followed by an examination of salient structural features in the post-deregulation domestic airline market. Changes in concentration and factors influencing rivalry are also examined, and the chapter concludes with an assessment of entry barriers in the domestic airline industry
-
a critical factor in determining industry structure now and in the future.STRUCTURAL DETERMINANTS OF RIVALRY
The industrial organisation economics literature has focused on a number of key structural determinants of the degree of competition (Scherer & Ross 1990). These include the number of competitors, degree of new entry, strength of industry demand/degree
of
excess capacity, and homogeneity of firms in costs and size. Each will be discussed in turn.Number of competitors
As more firms compete in a market, the degree of rivalry will become more intense. With more firms, the chances acre greater that any one maverick firm will
BTCE
Report
zyxwvutsrqponmlkjihgfedcbaZYXWVUTSRQPONMLKJIHGFEDCBA
zyxwvutsrqponmlkjihgfedcbaZYXWVUTSRQPONMLKJIHGFEDCBA
73zyxwvutsrqponmlkjihgfedcbaZYXWVUTSRQPONMLKJIHGFEDCBA
Existence
of
new entrantszyxwvutsrqponmlkjihgfedcbaZYXWVUTSRQPONMLKJIHGFEDCBA
New entrants typically inject a great deal of rivalry into an industry. Such firms may come in with low prices in an effort to attract customers from existing firms. Also, a new firm may not be familiar with the established signalling and other communication mechanisms which may reduce the level of competition. Also, new entrants frequently increase the degree of industry capacity and heterogeneity, which, as discussed below, also tends to accelerate the intensity of competition. On the other hand, strong entry barriers increase industry stability and can result in lower rivalry, in that firms can more easily engage in long-term mutually beneficial actions if they are confident the same set of players will be in the industry over time.
Strength
of
industry demandldegreeof
excess capacityA growing industry demand will facilitate a ‘live and let live’ attitude on the part of firms. In general, a growing market can encourage stability, as each firm can grow in size without rocking the boat. On the other hand, a decrease in demand or even afall in the growth rate, perhaps brought about by an economicdownturn, can lead to competitive warfare.
Related to industry demand is the degree of capacity utilisation in the industry. Firms producing at close to full capacity have little incentive to try to increase output by lowering prices. On the other hand, if firms are faced with excess capacity and idle resources, the temptation is great to lower prices and increase output in an effort to fill excess capacity. As such, a fall in industry demand, where capacity cannot be reduced easily, can have a particularly strong effect on increasing rivalry. Also, a new entrant, where existing competitors cannot readily reduce capacity, will even in the face of strong economicconditions lead to excess capacity at least in the short term.
Homogeneity
of
costs and sizeFirms with similar cost structures will find it easier to tacitly agree on the same price structures to maximise joint industry profits. Widely varying costs among firms will generally result in stronger rivalry. Also, if firms are similar in other dimensions such as size, corporate culture and length of time in the industry, coordination will be easier and rivalry will be less intense.
CHANGES IN INDUSTRY STRUCTURE SINCE DEREGULATION
Chapter
3
zyxwvutsrqponmlkjihgfedcbaZYXWVUTSRQPONMLKJIHGFEDCBA
zyxwvutsrqponmlkjihgfedcbaZYXWVUTSRQPONMLKJIHGFEDCBA
Compass’s
entryzyxwvutsrqponmlkjihgfedcbaZYXWVUTSRQPONMLKJIHGFEDCBA
zyxwvutsrqponmlkjihgfedcbaZYXWVUTSRQPONMLKJIHGFEDCBA
Competition from new entrants has been one of the important policy objectives of deregulation of domestic aviation. The role that Compass Airlines has played since deregulation has been critical in stimulating passenger demand and fostering substantial discounting of fares.
Compass commenced operations
zyxwvutsrqponmlkjihgfedcbaZYXWVUTSRQPONMLKJIHGFEDCBA
on
1 December 1990 with two AirbusA300-600R aircraft. The expected heterogeneity of service is exemplified by Compass’s plan to offer a one-class service with two key features not currently offered by Ansett or Australian, more leg-room and in-flight video entertainment. At the same time Compass cut in-flight service costs.
In the initial start-up phase Compass encountered several difficulties. For example, delays were caused by a lack of refuelling facilities at Sydney airport, and the reservations system caused some problems. The arrival of the third Airbus was delayed from February to 1 April 1991. Additional capacity was put in place in mid July with the arrival of an A31 0 aircraft and
on
26 August with the arrivalof
Compass’s fourth A300-600H aircraft.As at 1 October 1991 Compass operated with five aircraft into Adelaide, Brisbane, Cairns, Melbourne, Sydney and Perth. Brian Grey has indicated that Compass’s choice of a wide-bodied aircraft was ldictated by gate limitations at the major airports (BTCE 1991).
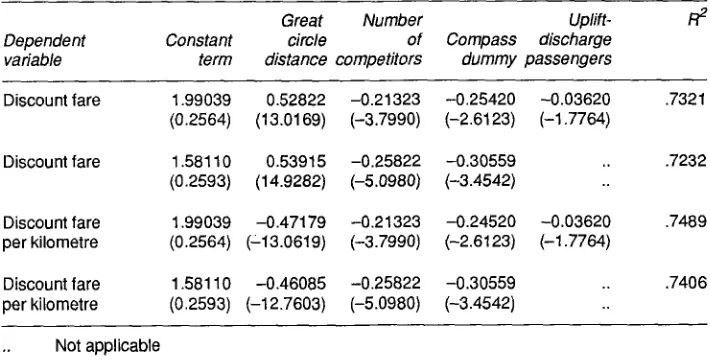
As illustrated by figures 3.1 and 3.2, one of the features of the Australian domestic aviation industry is that a new competitor can gain access to a large number of passengers by flying on only a small number of key routes. This has been the strategy pursued by Compass. Its route structure, shown in figure 3.3, reveals how it is using Melbourne airport as its major operations centre. The eight routes on which Compass offers most
of
its services are Melbourne-Sydney, Melbourne-Perth, Brisbane-Sydney, Perth-Sydney, Brisbane-Melbourne, Adelaide-Melbourne, Cairns-Melbourne, Adelaide-Sydney. These routes accounted for about 75 per centof
all Compass services on 1 September 1991. Melbourne has less congestion than Sydney airport and Compass stages all its aircraft through this centre. In addition, by running a common fleet from this airport it reduces dead-heading of crews and minimises overnight stays by crews at other destinations. Long-haul services, such as Melbourne-Perth and Perth-Sydney, enable Compass to tatke advantage of lower costs per seat kilometre.Compass’s cost advantage
BTCE
Report
zyxwvutsrqponmlkjihgfedcbaZYXWVUTSRQPONMLKJIHGFEDCBA
zyxwvutsrqponmlkjihgfedcbaZYXWVUTSRQPONMLKJIHGFEDCBA
732.8 -
zyxwvutsrqponmlkjihgfedcbaZYXWVUTSRQPONMLKJIHGFEDCBA
2.6 -
zyxwvutsrqponmlkjihgfedcbaZYXWVUTSRQPONMLKJIHGFEDCBA
5
2.4-2.2-
zyxwvutsrqponmlkjihgfedcbaZYXWVUTSRQPONMLKJIHGFEDCBA
Q) Q)
Q
zyxwvutsrqponmlkjihgfedcbaZYXWVUTSRQPONMLKJIHGFEDCBA
0
c 2 -
.-
-
-
1.8-Y
zyxwvutsrqponmlkjihgfedcbaZYXWVUTSRQPONMLKJIHGFEDCBA
I I I I l I I I I I
0 10 20 30 40 50 60 70 80 90 100
[image:26.495.100.426.52.367.2]Ranked city pairs Source DoTC ( 1 990).
Figure 3.1 Distribution of passengers by ranked city pairs in 1990
A range of aircraft, including B727s, B737s, B767s, A300s and A320s were simulated to represent the incumbent airlines. Utilisation was assumed to be 3300 hours per annum with a 1000 kilometre stage distance. The average cost components for the incumbent airlines were estimated by weighting the individual aircraft cost components by the total hours used for each aircraft type in 1990.
Chapter
3zyxwvutsrqponmlkjihgfedcbaZYXWVUTSRQPONMLKJIHGFEDCBA
zyxwvutsrqponmlkjihgfedcbaZYXWVUTSRQPONMLKJIHGFEDCBA
100- 90
-
80
-
zyxwvutsrqponmlkjihgfedcbaZYXWVUTSRQPONMLKJIHGFEDCBA
70
-
60
-
zyxwvutsrqponmlkjihgfedcbaZYXWVUTSRQPONMLKJIHGFEDCBA
I
C
a, 0 50-
a
L
a,
40 -
30 -
20 -
'"1
TABLE 3.1 ESTIMATES OF DIRECT OPERATING COSTS FOR COMPASS AND
zyxwvutsrqponmlkjihgfedcbaZYXWVUTSRQPONMLKJIHGFEDCBA
THE MAIN INCUMBENTAIRLINES(cents per availa,ble seat kilometre) Compass
Base Utilisation Stage lncumbenf
Capital Fuel Maintenance Crew Government
Other
Total
1.36 1.74 1.81 1.56
0.70 10.70 0.73 0.88
0.89 0.89 0.93 1.64 0.32 0.34 0.35 0.74
1.44 1.44 1.60 1.90
0.56 0.56 0.70 l .55
5.26 5.65 6.1 1 8.52
[image:27.491.61.417.56.370.2]Per cent
zyxwvutsrqponmlkjihgfedcbaZYXWVUTSRQPONMLKJIHGFEDCBA
of services on each route-
21 per cent4 to 10 per cent
less than 4 per cent
zyxwvutsrqponmlkjihgfedcbaZYXWVUTSRQPONMLKJIHGFEDCBA
Source Compass flight schedule.
Figure
zyxwvutsrqponmlkjihgfedcbaZYXWVUTSRQPONMLKJIHGFEDCBA
3.3 Compass routes as at 1 September 1991In terms of the direct operating cost components, Compass’s aircraft have higher capital costs per seat kilometre than the incumbent airlines (because they are newer), but are much more fuel efficient and less costly to maintain. The difference in crew costs
is
partly due to the continued presence of three membercockpit crews in some aircraft and the higher number
of
zyxwvutsrqponmlkjihgfedcbaZYXWVUTSRQPONMLKJIHGFEDCBA
flight attendants per seatin the aircraft flown by the incumbents. Compass’s costs per seat kilometre for the ‘other’ component
of
the direct operating costs (which includes provisioning and ground services), are estimated to be less than half the incumbents’ costs.The Bureau estimates that Compass’s overheads are 2.7 cents per ASK
compared to 5 cents for the incumbents. That is, Compass not only holds an advantage over the incumbents in direct operating costs, but also has much
Chapter
3zyxwvutsrqponmlkjihgfedcbaZYXWVUTSRQPONMLKJIHGFEDCBA
zyxwvutsrqponmlkjihgfedcbaZYXWVUTSRQPONMLKJIHGFEDCBA
Compass
zyxwvutsrqponmlkjihgfedcbaZYXWVUTSRQPONMLKJIHGFEDCBA
:c ::..zyxwvutsrqponmlkjihgfedcbaZYXWVUTSRQPONMLKJIHGFEDCBA
:: ~4 cents for the incumbents. Compass Airlines’ Chief ExecutiveOfficer, BT)..L-;~! ,3rey, claims that Compass’s total costs per ASK are
7.5
cents, compared to about 14 cents for the inwmbent airlines.Although the cost analysis in table 3.1 provides some insights into Compass’s competitiveness, it only tells parts of the story. Unlike the situation in the United States, revenue data for individual airlines are not publicly available in Australia. The only publicly available revenue data are the industry-average fare indices
published by the Prices Surveillance Authority. These are discussed in chapter 5.
zyxwvutsrqponmlkjihgfedcbaZYXWVUTSRQPONMLKJIHGFEDCBA
Changes in market concentration
The entry of Compass has reduced the level of industry concentration which existed under regulation. Since enterinig the market, Compass has gained 10 per
cent
of
the total aviation market and,zyxwvutsrqponmlkjihgfedcbaZYXWVUTSRQPONMLKJIHGFEDCBA
bly
1 September 1991, had captured 21.3per cent of the markets in which it was then operating. More detailed information on Compass’s share of the airline market over time and how its growth has affected other airlines’ market shares is provided in figures 3.4 and 3.5. Roy Morgan research statistics report that Compass had attracted 8.9 per cent of all business travellers by October (Blackburn 1991).
Further insight into the structural changes brought about by deregulation can be obtained by examining the number of rcompetitors on each of the main routes. Figure
3.6
shows the top20
routesfor
1988, and figure3.7
shows the top 20 routes so far in 1991. Two routes, Devonport-Melbourne and Karratha-Perth, were replaced in the top 20 by Cairns-Sydney and Adelaide-Alice Springs, between 1988 and 1991.It
can be seen from acomparison of figures 3.6 and 3.7zyxwvutsrqponmlkjihgfedcbaZYXWVUTSRQPONMLKJIHGFEDCBA
that additional competitionhas been generated on the following ten routes: Melbourne-Sydney, Bnsbane-Sydney, Adelaide-Melbourne, Brisbane-Melbourne, Adelaide-Sydney, Melbourne-Perth, Canberra-Melbourne, Brisbane-Cairns, Adelaide-Perth, and Cairns-Sydney. Eastwest withdrew from the Perth-Sydney route, but the number of competitors was maintained by the entry of Compass.
Potential new entrants
Other potential entrants at this stage ,are AAA Airlines, Air Hibiscus, Capitol Airlines of Australia, Seaboard Airlines, Southern Cross Airlines and Transcontinental Airlines of Australia. Reports in the media suggest that Transcontinental and AAA are the two airlines which are the most likely to enter the market, along with a new small regional operator, Northern Australian Airlines, which
is
expected to challenge Ansett WA with four Fokker 100s.Australian
zyxwvutsrqponmlkjihgfedcbaZYXWVUTSRQPONMLKJIHGFEDCBA
44% Australian group 38% Ansett group 52%September quarter 1988
Eastwest 4%
September quarter 1991
zyxwvutsrqponmlkjihgfedcbaZYXWVUTSRQPONMLKJIHGFEDCBA
[image:30.497.100.446.86.213.2]Source DoTC ( 1991 c).
Figure 3.4 Airline market shares
-
revenue passenger kilometres, September quarters 1988 to 1991Australian 43% Australian group 40%
Compass 0%
Eastwest
zyxwvutsrqponmlkjihgfedcbaZYXWVUTSRQPONMLKJIHGFEDCBA
6%Ansett arour,
zyxwvutsrqponmlkjihgfedcbaZYXWVUTSRQPONMLKJIHGFEDCBA
4Ansett group 51%
-
.
September quarter 1988 September quarter 1991Source DoTC ( 199 1 c).
Figure 3.5 Airllne market shares
-
passengers, September quartersChapter 3
zyxwvutsrqponmlkjihgfedcbaZYXWVUTSRQPONMLKJIHGFEDCBA
passengers. The airline intends to initially increase competition on Western
Australian and Tasmanian routes. Australian Aviation (July
zyxwvutsrqponmlkjihgfedcbaZYXWVUTSRQPONMLKJIHGFEDCBA
1991) reported thatTranscontinental proposed to commelnce operations in Western Australia by March 1992, with east coast services in place by late 1992.
AAA Airlines plans to initially operate a Fleet of three MacDonell Douglas DC9-30
aircraft on 120 services during the week between Sydney and Melbourne. On
weekends and public holidays two
zyxwvutsrqponmlkjihgfedcbaZYXWVUTSRQPONMLKJIHGFEDCBA
of
the aircraft will be chartered out. AAAAirlines intends to put 12 600 economy seats into the Melbourne-Sydney market each week, an increase of approximately 14 per cent on the capacity on that route, based on October 1991 passenger data. The airline expects to raise 70 per cent of its capital from pilots and 30 per cent from a group of Sydney investors.
AAA Airlines plans to take delivery of its first aircraft in early 1992.
zyxwvutsrqponmlkjihgfedcbaZYXWVUTSRQPONMLKJIHGFEDCBA
Alice Springs
o
-
4 airlines3 airlines -Hobart
2 airlines
Note Ansett, Ansett WA and Ansett NSW are treated as one operator.
[image:31.492.57.409.268.573.2]Source DoTC (1 991 a).
- ~ -__
zyxwvutsrqponmlkjihgfedcbaZYXWVUTSRQPONMLKJIHGFEDCBA
BTCE
zyxwvutsrqponmlkjihgfedcbaZYXWVUTSRQPONMLKJIHGFEDCBA
ReportzyxwvutsrqponmlkjihgfedcbaZYXWVUTSRQPONMLKJIHGFEDCBA
73zyxwvutsrqponmlkjihgfedcbaZYXWVUTSRQPONMLKJIHGFEDCBA
4 airlines
2 airlines
Note Ansett, Ansett WA and Ansett Express are treated as one operator.
Source DoTC (1 991 a).
Figure
zyxwvutsrqponmlkjihgfedcbaZYXWVUTSRQPONMLKJIHGFEDCBA
3.7 Number of domestic airlines on each of the top 20 routes in 1991BARRIERS TO ENTRY
A key to the future structure, conduct and performance of the domestic airline market is the prosperity of new entrants. That is, a critical structural feature of a market is the height of industry entry and operational barriers, which will determine whether existing and potential new entrants can survive and thrive.
Chapter 3
zyxwvutsrqponmlkjihgfedcbaZYXWVUTSRQPONMLKJIHGFEDCBA
zyxwvutsrqponmlkjihgfedcbaZYXWVUTSRQPONMLKJIHGFEDCBA
The sources and importance of entry barriers in the Australian settin are now examined, with reference to the United States situation where relevant! Barriers to entry can be classified into three broad categories: natural (or economic) barriers; firm-created barriers; and government-created barriers. Each will be
discussed in turn.
zyxwvutsrqponmlkjihgfedcbaZYXWVUTSRQPONMLKJIHGFEDCBA
NATURAL BARRIERS
TO
zyxwvutsrqponmlkjihgfedcbaZYXWVUTSRQPONMLKJIHGFEDCBA
ENTRYScale economies
There are a number of natural barriers to entry which may affect the decision of new airlines to commence operations on Australian domestic routes and the success of those who do enter. (Natural barriers are those intrinsic to the technology at hand.) The primary barrier in this category is the existence of scale economies, whereby larger firms can produce at lower cost than smaller firms. A related technological barrier is the extent
of
capital required to enter: industries where capital requirements are substantial-
for example if large investment in plant and equipment is required to enter-
also tend to be those where scale economies are present.Although the economic literature influential in the debate on deregulation in the United States pointed to no scale economies in aviation, subsequent research has shed important clarification on the matter. As discussed in more detail by Morrison (1991), there is now clear evidence that economies of aircraft size and economies of density exist.
Economies of aircraft size exist as larger aircraft are cheaper to operate per available seat kilometre than smaller aircraft. For example, Bailey, Graham and Kaplan (1 985) show that for a 1000-mile trip, cost per revenue passenger mile is
18 per cent lower for a 371-seat DClO-’IO than for a 115-seat
zyxwvutsrqponmlkjihgfedcbaZYXWVUTSRQPONMLKJIHGFEDCBA
DC9-30.
Theseeconomies exist because larger aircraft can generate additional capacity without proportionate increases in crew size, fuel use, and the like. In addition, where an aircraft increases its seating capacity, fixed costs such as ground and station handling can be shared among a larger number of passengers, reducing available seat kilometre costs.
Added passengers in a corridor greatly facilitate realisation
of
these economies without seriously sacrificing flight frequency. This gives rise to economies of density, in that more passengers travellinlg on a given route result in lower costs.BTCE
Report
zyxwvutsrqponmlkjihgfedcbaZYXWVUTSRQPONMLKJIHGFEDCBA
zyxwvutsrqponmlkjihgfedcbaZYXWVUTSRQPONMLKJIHGFEDCBA
73
zyxwvutsrqponmlkjihgfedcbaZYXWVUTSRQPONMLKJIHGFEDCBA
Caves, Christensen and Tretheway (1984) found that if the number of passengers increases by 10 per cent, holding the route structure constant, costs increase by only 8 per cent.
The issue then becomes: to what extent do new entrants, by nature smaller than their established rivals, suffer a cost disadvantage? Otherwise stated: to what extent does having a larger network facilitate increased traffic densities and the concomitant lower costs?
In the United States, with a comparatively large number of cities, the hub-and-spoke system is a formidable tool in realising economies of density. Ratherthan being offered direct service, passengers from a given city are all flown to an intermediate hub, where they then change planes, join passengers from many otherorigins, and proceed to theirfinal destinations. Thus, density between relevant city pairs is greatly enhanced.
For example, assume an airline services passengers flying from five different origin cities, located somewhat near each other, to five destination cities, also located somewhat near each other as shown in figure 3.8. Some passengers from each of the five origin cities fly to each of the five destination cities, so that there are 25 city pairs in the route system and 25 flights would be needed to service all passengers who wished to fly at agiven time. A hub-and-spoke system entails establishing a city located centrally between origin and destination cities as a hub. Flights from each of the origin cities would proceed to the hub, and, after passengers change planes, flights would proceed to each of the destination cities. With such a hub-and-spoke system, only ten flights would be needed to service all passengers who wished to fly at a given time. In effect, by initiating a hub-and-spoke system, the airline has achieved densities 2.5 times greater.
Importantly, largerfirms, with more origin and destination points in their networks, can realise greater benefits from hub-and-spoke systems in facilitating
economies
zyxwvutsrqponmlkjihgfedcbaZYXWVUTSRQPONMLKJIHGFEDCBA
of
density and lower costs. With reference to the previous example,a firm with ten origins and ten destinations could boost densities fivefold by switching from direct flights to a hub-and-spoke system. The relatively greater cost advantage accruing to larger firms from adoption of hub-and-spoke systems has proven to be a serious problem forsmallerfirms, including new entrants trying to get a foothold in the market.
However, the situation is very different in Australia. Given the relatively small number of cities, which are widely dispersed and not geographically amenable to hub-and-spoke networks, the United States style hub-and-spoke system does not confer advantages. Moreover, a new entrant such as Compass can enter with a small number of aircraft, serve a small number of cities, and realise substantial traffic densities.
Another potential benefit of increased network size in facilitating density economies is that additional routes can be used to feed traffic onto core routes.
Chapter
zyxwvutsrqponmlkjihgfedcbaZYXWVUTSRQPONMLKJIHGFEDCBA
3zyxwvutsrqponmlkjihgfedcbaZYXWVUTSRQPONMLKJIHGFEDCBA
Origin Destination Origin Destination
zyxwvutsrqponmlkjihgfedcbaZYXWVUTSRQPONMLKJIHGFEDCBA
12
zyxwvutsrqponmlkjihgfedcbaZYXWVUTSRQPONMLKJIHGFEDCBA
3
4
5
25 flights Linear network
[image:35.490.56.396.99.286.2]10 flights Hub-and-spoke network
Figure 3.6 Benefits of a hub-and-spoke network
because of this they provide only a modest amount of feeder traffic to the top routes and have relatively high costs. Therefore, unlike the United States, firms can operate on only a small number of routes in an integrated system and not suffer from cost disadvantages. Indeed, networks such as Compass’ can be advantageous in realising economies of density and aircraft size vis-a-vis Ansett’s and Australian’s more comprehensive networks.
Thus, new, smallercarriers in Australiado not appear to be at acostdisadvantage compared to established larger players. Indeed, new entrants may well be able to achieve lower costs if existing firms a1.e locked into particular cost structures. Compass, for example, has been able tal negotiate innovative pilot awards after
the pilots’dispute, which have
not
zyxwvutsrqponmlkjihgfedcbaZYXWVUTSRQPONMLKJIHGFEDCBA
been duplicated by Australian Airlines or AnsettAustralia.2
Compass has also been able to construct a route network and operating practices to reflect the current competitive environment, whereas the major airlines have had the perhaps more difficult task of rationalising existing services and fare
BTCE Report
zyxwvutsrqponmlkjihgfedcbaZYXWVUTSRQPONMLKJIHGFEDCBA
zyxwvutsrqponmlkjihgfedcbaZYXWVUTSRQPONMLKJIHGFEDCBA
73zyxwvutsrqponmlkjihgfedcbaZYXWVUTSRQPONMLKJIHGFEDCBA
structures from the period of regulation. For example, Compa.ss !-F!.::
zyxwvutsrqponmlkjihgfedcbaZYXWVUTSRQPONMLKJIHGFEDCBA
achieved acompetitive advantage by employing Melbourne as a centre c&
zyxwvutsrqponmlkjihgfedcbaZYXWVUTSRQPONMLKJIHGFEDCBA
up~raliaris
so thateconomies can be achieved by concentrating aircraft servicing xi: cme
p o i r r t
while also facilitating more efficient use of crews. The incumbent airBinse; ~ ~ i a ~ ~ w @ l l haveto close or rationalise facilities in order to achieve similar efficiencies.
zyxwvutsrqponmlkjihgfedcbaZYXWVUTSRQPONMLKJIHGFEDCBA
Capital requirements
Capital requirements have been identified as a barrier to entry ?Q
zyxwvutsrqponmlkjihgfedcbaZYXWVUTSRQPONMLKJIHGFEDCBA
n~any rraar'kets.It has been suggested in Tirole (1989) that entrants may haw?
,troub!e
finding finance for their investments because of the risk to creditors. Bri !h@ c%se of Compass, the airline floated $50 million on the Sydney StockE.xc;hango
arid was oversubscribed by $15 m i l l i ~ n . ~ A number of institutional investors were reportedly among those providing funds for C o m p a ~ s . ~One aspect which facilitates entry into the aviation industry is
That
r.;?a.ray
of the major capital components such as aircraft and terminals can be isa:ad at market rates. Although it is unclear whether the enthusiasm genesa&?d during the Compass float could be attained by other potential entrantsattempling
'to raisefunds, the Compass experience suggests that raising funds in the
zyxwvutsrqponmlkjihgfedcbaZYXWVUTSRQPONMLKJIHGFEDCBA
I ~ I C ~ T of $65million needed to establish a comparable airline is achievable.
Innovative approaches have been suggested by several potential entrants. AAA
' Airlines, for example, proposes to develop an employee ownership strategy where the pilots working for AAA will have 70 per cent of the consis any's equity base through a trust fund. AAA also proposes cutting capital ,,quirements through the use of older, less expensive aircraft (AAA Airlines 19: I , I .
In summary, there do not appear to be serious natural entry barriers into the Australian domestic airline industry.
FIRM-CREATED BARRIERS TO ENTRY
There are a number of barriers to entry in which competing firms play a role. In some cases firms may pursue a deliberate blocking strategy towards entrants. In other cases possession of a key resource is sufficient to deter entry.
3. The share placement occurred in June 1990 and Compass shares were listedon the Sydney Stock Exchange on 5 July 1990.
4. The Commonwealth Superannuation Fund Investment Trust, the Queensland Industry
Development Corporation, AMP and Prudential Assurance were reported in the Australian
(7 June 1990) as contributing a total of $19 million. Sarich Corp and AMP were reported in the Canberra Times@ July 1990, p.15) as holding 7.6 per cent of Compass's shares and BT