2019 International Conference on Computer Intelligent Systems and Network Remote Control (CISNRC 2019) ISBN: 978-1-60595-651-0
Simulation of Indoor 60 GHz Millimeter Wave
Propagation Characteristics Based on PSO
Optimized SVM
Zhongxiang Zhu, Yuanjian Liu and Shuangde Li
ABSTRACT
SVM (Support Vector Machine) is a modern Data-Mining method. It is good at processing large amounts of data and has high accuracy. In this paper, an indoor 60 GHz millimeter wave channel model based on PSO (Particle Swarm Optimization) optimized SVM is established. The prediction results of GA (Genetic Algorithm) and Grid-Search optimized SVM are compared. The simulation results show the PSO optimized SVM model has high prediction accuracy.
KEYWORDS
Particle Swarm Optimization, SVM, Millimeter Wave.
INTRODUCTION
With the development of 5G (the fifth generation), the current wireless communication spectrum resources are increasingly scarce. Millimeter waves have rich spectrum resources and become the research hotspot and development trend of the future 5G system [1]. By analyzing and processing the actual measured data, the propagation model similar to the actual channel is established to qualitatively study and model the millimeter wave channel [2]. It is especially important to find a suitable propagation model for indoor signal coverage problems.
Among many methods, ray tracing is an effective method to study the propagation of indoor radio waves. However, the calculation amount of this method increases with the complexity of the scene environment [3,4]. Although the neural ______________________________________
Zhongxiang Zhu, Yuanjian Liu, Shuangde Li
network semi-empirical and semi-deterministic model has very strong learning and prediction ability, it has some defects such as easy to fall into local optimum and low network generalization ability [5]. SVM has a good generalization ability in terms of nonlinear classification and function approximation. Compared with neural networks, SVM has a more reliable mathematical theory foundation and strong generalization ability.
The PSO is chosen to optimize the parameters in the SVM machine model. The simulated data of the indoor receiving power is obtained through the simulation software. The indoor propagation characteristics are predicted by the SVM method based on PSO optimization.
THEORY
SVM Basic Ideas and Parameters
Training data can be set to T = {(xi, yi), i = 1,2,3,⋅⋅⋅, N}, where xi ∈ Rn is the
input vector. yi ∈ R is the output vector. n is the dimension of xi. Using the nonlinear mapping ϕ(·), the sample is mapped from the original space Rn to the feature space Φ(xi) . The optimal decision function is constructed in the high-dimensional feature space [6]:
y(x) = ωT⋅ Φ(x) + b (1)
Where ω is the hyperplane weight eigenvector; b is the bias term.
The optimal parameters ω and b are found using the principle of structural minimization. The optimization problem of the optimal classification surface can be described as a quadratic programming problem:
{Minω,b = 1 2‖ω‖
2+ C ∑ x i N i=1
yi(ωTx
i+ b) ≥ 1, i = 1, ⋯ , N
(2)
{max Q (λ) = ∑Ni=1αi−
1
2∑ yiyjλiλj(ϕxi, ϕxj) N
i,j=1
s. t. ∑Ni=1yiλi = 0,0 ≤ λi ≤ C
(3)
Where ϕxi× ϕxj = K(xi, xj) is the kernel function.
The selection of kernel function determines the type of SVM classifier. The kernel functions include linear kernels, polynomial kernels, and radial basis kernels. The radial basis kernel function is selected as the kernel function of SVM:
K(xi, x) = exp( g‖xi− x‖2) (4)
Where g =2σ12.
The selection of the penalty factor C and the kernel parameter σ will affect the effect of the kernel function. The penalty factor C is the degree to which the misclassified samples are controlled. The empirical risk decreases with the increase of C. But the generalization ability also goes down. The σ is the width parameter of kernel function and represents the control of the radial range. The selection of penalty factor C and kernel parameter σ is very important for SVM classifier. Therefore, in order to achieve good SVM classification performance, it is necessary to select the appropriate C and σ [8].
Overview of PSO
PSO adjusts each particle to a better region by fitness function to search for the optimal solution of the problem. The algorithm initializes a bunch of random particles. Vector xi = (x1, x2, ⋯ , xn) and vector vi = (v1, v2, ⋯ , vn) are the position and velocity of the particles in the N dimensional space. Each particle has an adaptation value determined by the objective function. In each iteration, the particle updates itself by pbest value and gbest value.
{vxi = wvi+ c1r1(pbest− xi) + c2r2(gbest− xi)
Where pbest indicates that particle i is the individual optimal value and gbest represents the global optimal value of the particle group. c1 and c2 are two
constants called learning factors. The global optimization ability becomes stronger as the value of w increases. r1 and r2 are random numbers from 0 to 1. The w is
called inertia factor.
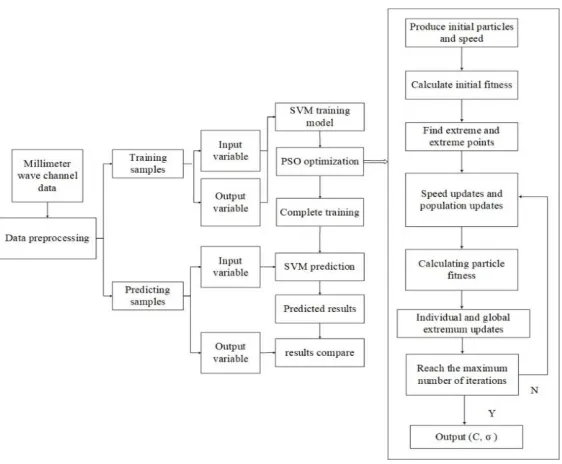
Technology Route
The steps to predict the indoor field strength using the PSO optimized SVM method are as follows:
First, select the 60 GHz indoor millimeter wave environment. The experimental data is generated by software simulation, and the received power is divided into training samples and test samples.
Second, use SVM learning and training data, and use PSO algorithm to optimize parameters of SVM.
Third, the test set and prediction results are compared and compared with other parameter optimization methods.
Figure 1. The process of PSO optimized SVM.
SIMULATION AND ANALYSIS
Simulation Environment
The indoor experimental environment is consistent with literature [9]. The simulation scene is shown in Figure 2. Includes a typical laboratory workstation. The transmitting antenna is located in the upper left corner of the laboratory. There are two receiving paths: (a-b-c) and (d-e-f).
[image:5.612.157.443.521.677.2]Material Parameters
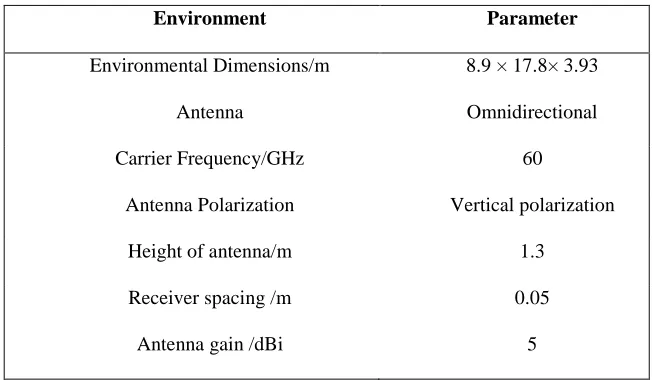
[image:6.612.134.460.236.427.2]Modeling parameters are shown in Table I. The parameters of building materials are shown in Table II.
TABLE I. SIMULATION ENVIRONMENT PARAMETERS.
Environment Parameter
Environmental Dimensions/m 8.9 × 17.8× 3.93
Antenna Omnidirectional
Carrier Frequency/GHz 60
Antenna Polarization Vertical polarization
Height of antenna/m 1.3
Receiver spacing /m 0.05
Antenna gain /dBi 5
TABLE II. MATERIAL PROPERTIES IN THE SIMULATION.
Buildings Materials σ(s/m) εr
Door wood 0.001 5
Table Wood 0.21 2.88
Wall PlasterBoard 0.06 2.02
Figure 3. Received power.
Results Analysis
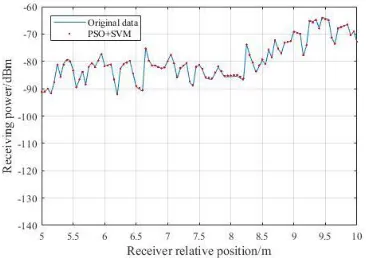
The parameters of the PSO are set as follows: the population number is 20, the evolution maximum number of iterations is 200, and the crossover probability is 0.6. C = 231.584 and g = 0.00390625 can be obtained by using the PSO algorithm. α and b can be obtained by substituting the parameters into the formula (3). Figure 4 is a simulated and predicted value curve for indoor radio wave propagation characteristics prediction based on PSO optimized SVM. It is worth noting that the value of prediction in term of the above algorithm has a good fit with the value of simulation.
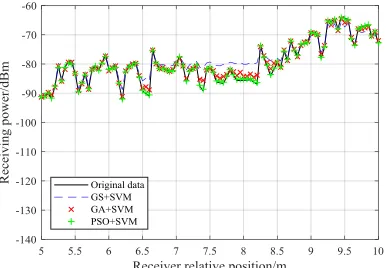
[image:7.612.210.393.531.660.2]In order to verify the effectiveness of this optimization method, Grid-Search algorithm and GA are used to predict. The predicted and simulated values of the three algorithms are shown in Figure 5(a). The error curve between the simulated value and the predicted value is shown in Figure 5 (b-c).
(a)Simulated and predicted value curves.
[image:8.612.196.389.185.319.2]
(b) The error curve. (c) The relative error curve.
Figure 5. Comparison of simulated and predicted values of three optimization methods.
MAE =N1∑ |y − yN i|
i=1 (6)
RMSE = √∑Ni=1(y−yi)2
N (7)
r = ∑Ni=1(y−y)(yi−yi) √∑N (y−y)2
i=1 √∑Ni=1(yi−yi)2
(8)
Where y is the measured value and yi is the predicted value; y is the average
value of measured value; yi is the average of the predicted value.
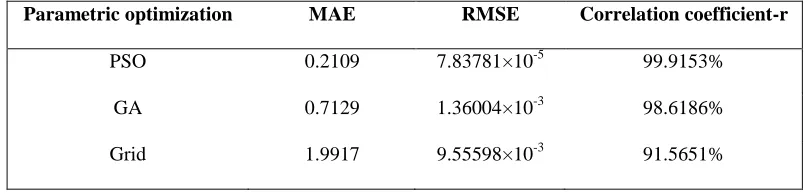
[image:9.612.238.495.52.223.2] [image:9.612.95.499.427.524.2]The error decreases with the decrease of MAR and RMSE, and the prediction effect is good. The larger r is, the closer the predicted value is to the simulated value. Table III shows the performance results of the three optimization algorithms.
TABLE III. PERFORMANCE RESULTS OF THREE METHODS.
Parametric optimization MAE RMSE Correlation coefficient-r
PSO 0.2109 7.83781×10⁻⁵ 99.9153%
GA 0.7129 1.36004×10⁻³ 98.6186%
Grid 1.9917 9.55598×10⁻³ 91.5651%
CONCLUSION
In this paper, the PSO algorithm is used to optimize the parameters of SVM regularization parameter C and kernel parameter σ. The simulation results show that the SVM prediction method based on PSO is more feasible and generalized. This is an effective method for predicting the propagation characteristics of indoor radio waves. Compared with other optimization algorithms, the PSO optimized SVM channel model has higher prediction accuracy. At present, the representation of indoor scenes is not enough. Further improvements are needed to make it more widely applicable to the study of indoor radio wave propagation characteristics.
ACKNOWLEDGMENTS
Corresponding author: Yuanjian Liu.
This work has been supported by the National Natural Science Fund under Grant no.61871232.
REFERENCES
1. Yong Li, Guanyun Wang, Shuangde Li, Feng Chen, Yuanjian Liu and Pengfei Wang, “Simulation and analysis of 60GHz millimeter-wave propagation characteristics in indoor complex environment,” IEEE International Conference on Computational Electromagnetics, Guangzhou, 2016, pp. 278-280.
2. F. Ferrero, J. Lanteri, L. Brochier and C. Migliaccio, “Impact of mechanical accuracy in mmW spherical measurements,” IEEE Conference on Antenna Measurements & Applications, Tsukuba, 2017, pp. 377-380.
3. Y. Chen, P. Li, D. Shi and Y. Gao, “Research on accelerate method of ray tracing,” Asia-Pacific Conference on Environmental Electromagnetics, Shanghai, 2012, pp. 266-269.
4. M. L. Tobin and J. E. Richie, “A 2-D ray tracing model for the characterization of spatial and time-domain properties of the indoor propagation channel,” IEEE Antennas and Propagation Society International Symposium. 1995 Digest, Newport Beach, CA, USA, 1995, pp. 1948-1951. 5. A. Neskovic, N. Neskovic and D. Paunovic, “Microcell coverage prediction using artificial neural networks,” Seminar on Neural Network Applications in Electrical Engineering, Belgrade, Yugoslavia, 2002, pp. 197-201.
7. Xiaju Zhu, Xiaopei Wu, Zhao Lu. “Speech emotion recognition algorithm based on SVM,” Application of Computer System, vol. 20, no. 5, 2011:87.
8. Y. Xu, Q. Du, M. Zhang, Q. Zhu and Y. He, “Soft-sensing development using adaptive PSO optimization based multi-kernel ELM with error feedback,” IEEE Driven Control and Learning Systems Conference, Enshi, 2018, pp. 431-435.
9. L. Azpilicueta, M. Rawat, K. Rawat, F. M. Ghannouchi and F. Falcone, “A ray launching-neural network approach for radio wave propagation analysis in complex indoor environments,” IEEE Transactions on Antennas and Propagation, vol. 62, no. 5, May 2014, pp. 2777-2786.