Open Access
Research article
Reliability of measures of impairments associated with
patellofemoral pain syndrome
Sara R Piva*
1, Kelley Fitzgerald
1, James J Irrgang
1, Scott Jones
2,
Benjamin R Hando
3, David A Browder
4and John D Childs
5Address: 1Department of Physical Therapy, School of Health and Rehabilitation Sciences, University of Pittsburgh, USA, 2Ramstein Outpatient
Physical Medicine Clinic, Ramstein Air Force Base, Germany, 3Eglin Regional Hospital, Eglin Air Force Base, FL, USA, 4Wilford Hall Medical Center,
Lackland Air Force Base, TX, USA and 5US Army-Baylor University Doctoral Program in Physical Therapy, USA
Email: Sara R Piva* - spiva@shrs.pitt.edu; Kelley Fitzgerald - kfitzger@pitt.edu; James J Irrgang - irrgangjj@upmc.edu; Scott Jones - scott.jones1@ramstein.af.mil; Benjamin R Hando - benjamin.hando@lackland.af.mil;
David A Browder - david.browder@lackland.af.mil; John D Childs - childsjd@sbcglobal.net * Corresponding author
Abstract
Background: The reliability and measurement error of several impairment measures used during the clinical examination of patients with patellofemoral pain syndrome (PFPS) has not been established. The purpose was to determine the inter-tester reliability and measurement error of measures of impairments associated with PFPS in patients with PFPS.
Methods: A single group repeated measures design was used. Two pairs of physical therapists participated in data collection. Examiners were blinded to each others' measurements.
Results: Thirty patients (age 29 +/- 8; 17 female) with PFPS participated in this study. Inter-tester reliability coefficients were substantial for measures of hamstrings, quadriceps, plantarflexors, and ITB/TFL complex length, hip abductors strength, and foot pronation (ICCs from .85 to .97); moderate for measures of Q-angle, tibial torsion, hip external rotation strength, lateral retinacular tightness, and quality of movement during a step down task (ICCs from .67 to .79); and poor for femoral anteversion (ICC of .45). Standard error of measurement (SEM) for measures of muscle length ranged from 1.6 degrees to 4.3 degrees. SEM for Q-angle, tibial torsion, and femoral anteversion were 2.4 degrees, 2.9 degrees, and 4.5 degrees respectively. SEM for foot pronation was 1 mm. SEM for measures of muscle strength was 1.8 Kg for abduction and 2.4 Kg for external rotation.
Conclusion: Several of the impairments associated with PFPS had sufficient reliability and low measurement error. Further investigation is needed to test if these impairment measurements are related to physical function and whether or not they are useful for decision-making.
Background
Patellofemoral pain syndrome (PFPS) is a common knee problem among young active individuals [1-3]. The
mechanism of PFPS is not well understood. It has been proposed that PFPS may arise from abnormal muscular and biomechanical factors that alter tracking of the patella Published: 31 March 2006
BMC Musculoskeletal Disorders 2006, 7:33 doi:10.1186/1471-2474-7-33
Received: 21 January 2006 Accepted: 31 March 2006
This article is available from: http://www.biomedcentral.com/1471-2474/7/33
© 2006 Piva et al; licensee BioMed Central Ltd.
within the femoral trochlear notch contributing to increased patellofemoral contact pressures that result in pain and dysfunction [4,5]. Authors have suggested a vari-ety of impairments involved in the etiology of PFPS [6-8]. However, there is no evidence that these impairments are associated with the patient's functional limitations. In the absence of definitive impairments in which to focus the examination or treatment in patients with PFPS, clinicians tend to perform an extensive physical examination that generally includes a multitude of impairment measures such as muscle weakness, soft tissue tightness, structural or postural alterations, and poor quality of movement [3].
Reliability and measurement error are essential properties of any measurement that need to be established before the measurement can be considered clinically meaningful and useful. Reliability is the ability of a test to consistently yield more or less the same results when administered on several occasions to stable subjects, whereas measurement error provides the threshold for interpreting test results being reasonably confident that true change has occurred [9,10]. Although several studies have investigated the reli-ability of impairment measures associated with patel-lofemoral dysfunction in healthy subjects [11-15], the reliability and measurement error of impairment meas-ures used during the clinical examination of patients with PFPS has not been established.
Among the measures of muscle strength performed in patients with PFPS, reliability of hip abduction and hip external rotation strength tests have not been determined in patients with PFPS. Hip abductor and external rotation strength are commonly measured in patients with PFPS because weakness of these muscles has been linked with PFPS [16,17]. Authors have suggested these muscles help to maintain pelvic stability by eccentrically controlling femoral internal rotation during weight-bearing activities. Weakness may result in increased medial femoral rotation and valgus knee moments, augmenting compressive forces on the patellofemoral joint [16,17]. Ireland et al [18] suggest that individuals with PFPS have weaker hip muscles when compared to matched control groups. Another study has shown that hip abduction strength is one of the variables able to distinguish between patients with and without PFPS [19].
Soft tissue restrictions, such as shortening of the quadri-ceps, hamstrings, and plantarflexor muscles, shortening of the iliotibial band/tensor fascia lata (ITB/TFL) complex, and shortening of the lateral retinacular structures have all been associated with PFPS and are impairments com-monly measured in this population [20-22]. It is theo-rized that tight quadriceps and hamstrings may increase compression of the patellofemoral joint [20]. While two studies agree supporting the association of quadriceps
flexibility and PFPS, the same studies conflict regarding the association of hamstrings flexibility and PFPS [21,22]. There is some evidence to support the association between plantar flexors tightness and PFPS [21]. Concern-ing the ITB/TFL and lateral retinacular tissues, although it has been theorized that tightness of these tissues may dis-place the patella laterally and increase the stress in the patellofemoral joint or medial retinacular tissue [1,23], evidence to support such theory does not yet exist. In gen-eral, studies investigating the measurement properties of the above mentioned soft tissue measures have not used individuals with PFPS, or have not determined the meas-urement error [11,12,24-30].
Studies examining the measurement properties of tests used to determine structural or postural alterations in patients with PFPS are also lacking. Some structural or postural alterations that have been linked to PFPS are excessive foot pronation, quadriceps angle (Q-angle), tib-ial torsion, and femoral anteversion. Evidence to support that increased foot pronation causes PFPS is inconclusive [6,31]. Regarding Q-angle, it was reported that Q-angle is more accentuated in runners with PFPS than in runners without PFPS [7]. To our knowledge, just one study has investigated the relationship between tibial torsion and PFPS and reported that the lateral rotation of the tibia rel-ative to the femur was increased in patients with PFPS [32]. Studies that investigated the association of femoral anteversion and PFPS have reported conflicting results [32,33]. Although some measures of structural alterations have shown good reliability [14], samples of patients with PFPS have rarely been used [13-15]. A recent study using patients with PFPS reported poor consistency of these measurements [30].
Quality of movement, sometimes referred to as neuromo-tor control or movement coordination, refers to the bio-mechanics of the lower extremities, trunk and arms in relationship with its surrounding during physical activi-ties [4]. It has been theorized that patients with PFPS exhibit altered movement patterns in the lower extremi-ties that may result in alterations of the load distribution across the patellofemoral joint [1,21,34]. Altered move-ment patterns may be recognized during physical activi-ties as movements performed with poor quality. We are unaware of studies that investigated the consistency of measures of quality of movement in patients with PFPS.
complex length, lateral retinacular structures length, foot pronation, Q-angle, tibial torsion, femoral anteversion and quality of movement, because of their frequent use in the examination of individuals with PFPS and the lack of information concerning their reliability and measurement error.
Methods
A single group repeated measures design was used in this study. Data for this study was obtained as part of a larger multicenter study that investigated predictors of function in persons with PFPS.
Subjects
Individuals were eligible to participate in this study if they were diagnosed by a physician with PFPS, were between 12 and 50 years of age, had pain in one or both knees, had duration of signs and symptoms greater than 4 weeks, had history of insidious onset not related to trauma, and had pain in the patellar region with at least three of the follow-ing: manual compression of the patella against the femur at rest or during an isometric knee extensor contraction, palpation of the postero-medial and postero-lateral bor-ders of the patella, resisted isometric quadriceps femoris muscle contraction, squatting, stair climbing, kneeling, or prolonged sitting.
Exclusion criteria included previous patellar dislocation, knee surgery over the past 2 years, concomitant known or suspected diagnosis of: peripatellar bursitis or tendonitis, internal knee derangement, systemic arthritis, ligamen-tous knee injury or laxity, plica syndrome, Sinding-Larsen-Johansson's disease, Osgood Schlatter's disease, infection, malignancy, musculoskeletal or neurological lower extremity involvement that interferes with physical activ-ity, and pregnancy. Thirty patients were recruited from 2 clinical sites: Wilford Hall Medical Center, in San Anto-nio, TX, and University of Pittsburgh's Centers for Rehab Services, Pittsburgh, PA). All subjects who agreed to par-ticipate signed a consent form approved by the Institu-tional Review Board of the respective clinical site. Demographic characteristics of the participants are reported in Table 1.
Procedures
Subjects had one lower extremity tested unless they had bilateral symptoms, in which case the most symptomatic side was tested. The most symptomatic knee was deter-mined by the patient's self-report. Data were collected during one assessment session that lasted approximately 60 minutes. We collected data during the same assessment session to ensure the subjects remained as stable as possi-ble (did not change) in the parameters tested. Examiners met once during a 2-hour session before the study was ini-tiated to review operational definitions and practice the
procedures to ensure standardization. Each examiner was provided with the Manual of Standard Operating Proce-dures of the study, which contained detailed explanations about the performance of each test.
Two pairs of physical therapists (1 pair from each site) with different levels of experience participated in data col-lection. One pair of testers had 3 and 5 years of clinical practice (pair 1); whereas the other pair had 2 and 10 years of clinical experience (pair 2). During each data col-lection session, the subject remained inside an examina-tion room. To ensure that the examiners remained blinded to each other's assessments, the two examiners entered the examination room independently, performed and recorded the measurements, and then left the room. The results were not shared with the other examiner. The measurements were always performed in the same order. Order of testing was based on patient positioning in the following order: supine, prone, side-lying, and standing positions. This was done to avoid excessive changing of positions, ensure that the examiners were performing all tests under the same conditions, and ensure that any order effect would be the same for each examiner. Each exam-iner in the pair alternated serving as the initial examexam-iner.
Measures
Each participant completed a demographic questionnaire and self-reported measures of pain and function prior to the physical examination. Subjects' age, gender, height, weight, prior history of knee problems, mechanism of injury, current episode duration, and symptom location were recorded.
[image:3.612.313.552.118.259.2]Pain intensity was measured using an 11-point numeric pain rating scale ranging from 0 (No Pain) to 10 (Worst
Table 1: Demographic characteristics of the sample. Values represent the mean (Standard Deviation) unless otherwise stated.
Variable (n= 30)
Age in years 29.1(8.4)
Number of subjects in each age range:
From 14 to 19 years 2 (7%) From 20 to 29 years 16 (53%) From 30 to 39 years 7 (23%) From 40 to 47 years 5 (17%) Number of females 17 (59 %)
Height in cm 171 (11.1)
Weight in kg 79 (18.6)
Body Mass Index as kg/cm2 .26 (.05)
Numeric Pain Rating Scale* score 3.9 (1.9) Activity of Daily Living Scale** score 67.3 (17.3)
* Numeric pain rating scale ranges from 0 (No Pain) to 10 (Worst Imaginable Pain) points.
Imaginable Pain). Patients rated their current, best, and worst level of pain during the last 24 hours. The average of the three ratings was used to represent the patient's overall pain intensity. Numeric pain scales have been shown to be reliable and valid [35-38].
The Activity of Daily Living Scale (ADLS) of the Knee Out-come Survey was used as a knee-specific measure of phys-ical function [39]. The ADLS assesses the effects of knee impairment on activities of daily living. The ADLS consists of 14 items that measure the full spectrum of symptoms and functional limitations during activities of daily living that one may experience as a result of a variety of knee pathologies. The ADLS score is transformed to a 0 to 100 point scale with 100 indicating the absence of symptoms and functional limitations. Psychometric testing has dem-onstrated the ADLS to be reliable, valid and responsive in subjects with PFPS [39,40].
Measurements performed during the physical examina-tion were as follows:
Hamstrings length was determined by measuring the straight leg raise using a gravity goniometer (MIE Medical Research Ltd., Leeks, UK). The subject was in the supine position with the tested knee extended and the other leg flat on the table to avoid excessive posterior pelvic tilt. Before starting the measurement, the goniometer was zeroed on the lower half of the anterior border of the tibia. Then, the lower extremity was passively lifted to the end range of motion or firm end feel and the measurement recorded in degrees (Figure 1). The average measurement of two trials with 5-second pause between trials was recorded.
Tightness of the lateral retinacular structures was assessed with the patellar tilt test [44]. The patellar tilt test was performed with the subject in supine with the knee in full extension and the femoral condyles placed in the hor-izontal plane. The examiner attempted to lift the lateral edge of the patella from the lateral femoral condyle. The patella was not allowed to move laterally during the meas-urement (Figure 1). The inability to lift the lateral boarder of the patella above the horizontal plane indicated a pos-itive test for tightness of the lateral retinaculum. Adequate length of the lateral retinaculum or negative test was indi-cated by the ability to lift the lateral boarder of the patella above the horizontal plane. Tightness of lateral retinacu-lum was scored as tight or normal.
Q-Angle was measured with the knee in full extension with the subject supine. The angle formed by the intersec-tion of the line of applicaintersec-tion of the quadriceps force (line from the anterior superior iliac spine to the center of patella) with the center line of the patellar tendon (line
from the center of the patella to the tibial tubercle) was measured in degrees with a universal goniometer (Figure 1) [42]. The center of the patella and the tibial tubercle were marked with a demographic pencil, which was wiped out after the measurement. Before the measure-ment the tester palpated the anterior superior iliac spine and asked the subject to keep his second finger pointing down over this landmark during the measurement. Sub-ject was also asked not to contract the quadriceps muscles during the measurement.
Tibial torsion was measured with a universal goniometer with the participant prone on a low table, and with the tested knee bent at 90°. Height of the table was adjusted so the tester could comfortably visualize the plantar sur-face of the subject's foot. To facilitate visualization, the tester marked the most prominent aspect of the medial and lateral malleolus with a small dot. The examiner measured the angle formed by the axis of the knee (imag-inary line from the medial to lateral femoral epicondile) and an imaginary line through the malleoli (Figure 1). We elected to measure tibial torsion with the patient in a prone position rather than the position usually described with the patient sitting with knees in 90° because tibial torsion is a horizontal plane rotational malalignment [43,44]. We believe using an inferior view of the leg ena-bles better observation of the talocrural joint axis in the horizontal plane.
Quadriceps length was determined by measuring the quadriceps femoris muscle angle during passive knee flex-ion with the subject in the prone positflex-ion. Care was taken to avoid anterior tilting of the pelvis and/or extension of the lumbar spine. The angle of knee flexion in the prone position was measured using a gravity goniometer which was zeroed on a horizontal surface prior to the measure-ments. The gravity goniometer was placed over the distal tibia (Figure 1). The average measurement of two trials with 5-second pause between trials was recorded.
Femoral anteversion was measured using the Craig's test with the participant in the prone position with the knee flexed to 90° [45]. Before starting the measurement, the gravity goniometer was zeroed on a vertical surface and placed on the medial surface of the lower leg, just proxi-mal to the medial proxi-malleolus (Table 2). The examiner pal-pated the posterior aspect of the greater trochanter of the femur. The hip was then passively rotated until the most prominent portion of the greater trochanter reached the horizontal plane. The degree of anteversion was then esti-mated based on the angle of the lower leg with the vertical (Figure 1).
Illustration of the techniques used to measure impairments associated with PFPS
Figure 1
Illustration of the techniques used to measure impairments associated with PFPS (A) Hamstrings length - straight leg raise test
(B) Tightness of the lateral retinacular structures - patellar tilt test (C) Q-angle
(D) Tibial torsion - angle formed between inter-epicondilar and intermalleolar lines (E) Quadriceps muscle length - quadriceps femoris muscle angle
(F) Femoral anteversion - Craig’s test (G) Plantar flexors length
(H) Hip external rotation strength (I) Hip abduction strength
(J) ITB/TFL complex length- Ober’s test (K) Foot pronation - navicular drop test
and again with the knee flexed at 90°. Ankle dorsiflexion measured with the knee extended was used to account for the influence of gastrocnemius tightness. Measurement of ankle dorsiflexion with the knee bent was used to detect tightness of joint capsule or soleus muscle. The subject was positioned in the prone position with the foot hang-ing off the table and the subtalar joint was maintained in the neutral position. Dorsiflexion was measured with a standard goniometer as the angle formed by the lateral midline of the leg on a line from the head of the fibula to the tip of the lateral malleolus and the lateral midline of the foot in line with the border of the rearfoot/calcaneus (Figure 1). The average measurement of two trials with 5-second pause between trials was recorded.
Hip external rotation strength – Strength measures were performed using the Lafayette Manual Muscle Test (MMT) System (Lafayette Instrument, Lafayette, IN). Muscle strength was recorded in terms of force, in kilograms. Hip external rotation strength was examined with the subject positioned in prone on a padded table with the test knee flexed to 90° and the hip in neutral rotation. The contral-ateral lower extremity was positioned with the hip in neu-tral rotation and the knee in full extension. To obtain optimal mechanical advantage, the examiner stood on the side of the table opposite of the test limb. Subjects exerted an isometric contraction of their hip external rotators for 3–5 seconds in a position of neutral hip rotation. The manual resistance against the external rotation was applied with the MMT just proximal to the medial malle-olus (Figure 1). To maintain uniformity in the nature of verbal commands provided by the tester during testing, the testers were instructed to always give a strong verbal encouragement during the performance of every maxi-mum effort. The average force of two trials with one minute of rest between trials was recorded.
Hip abduction strength was measured with the subject in side-lying with the test hip positioned superior with respect to the contralateral hip. Subjects exerted an iso-metric contraction of their hip abductors for 3–5 seconds in a position of approximately 30° of hip abduction and 5° of hip extension. The manual resistance was applied with the MMT just proximal to the lateral malleolus in the direction of adduction (Figure 1). To maintain uniformity in the nature of verbal commands provided by the tester during testing, the testers were instructed to always give a strong verbal encouragement during the performance of every maximum effort. The average force of two trials with one minute of rest between trials was recorded.
Length of the Iliotibial Band/Tensor Fascia Lata (ITB/ TFL) Complex was examined using the Ober's test [46]. The subject was positioned in side-lying with the tested leg positioned superior and the lower leg slightly flexed at
the hip and knee to maintain stability. The gravity goni-ometer was zeroed on a horizontal surface prior to the measurement and was placed over the distal portion of the ITB/TFL complex (Figure 1). The test leg was flexed to a right angle at the knee and grasped just below the knee with the examiner's distal hand. The examiner moved the subject's thigh first in flexion, then through abduction combined with extension until the hip was positioned in mid-range abduction with neutral flexion/extension. From this position the thigh was allowed to drop toward the table until the point where the limb stopped moving toward the table. At that point the measurement was taken. The result was recorded as a continuous variable. Negative values represent more tightness whereas positive values (below horizontal) represent less tightness. The average measurement of two trials with 5-second pause between trials was recorded.
Foot pronation was measured by the navicular drop test [14,47]. Navicular drop test measures the difference between height of the navicular at subtalar joint neutral position and that of the relaxed stance position [14,47]. The subject stood on a high hard surface with his feet shoulder width apart. The examiner stayed behind the subject with the eyes leveled at subject's feet. The examiner marked the subject's navicular tuberosity with a demo-graphic pencil, which was wiped out after the measure-ment. The examiner put the subject in the subtalar joint neutral position. Using an index card placed perpendicu-lar to the table, the examiner recorded the distance from the navicular to the floor (Figure 1). The subject was then instructed to relax from the subtalar neutral position and the measurement was repeated. Then, with a metric ruler, the distance between the two dots, in the index card (which represents the difference in the position of the navicular tubercle with respect to the floor between the subtalar neutral and relaxed standing positions) was recorded in millimeters. Greater distances between the dots indicate greater pronation.
Quality of movement during the lateral step down test
rotated or elevated one side compared with the other, 1 point was added; 4) Knee position. If the knee deviated medially and the tibial tuberosity crossed an imaginary vertical line over the 2nd toe, add 1 point, or, if the knee deviated medially and the tibial tuberosity crossed an imaginary vertical line over the medial border of the foot, add 2 points, and; 5) Maintain steady unilateral stance. If the subject stepped down on the non-tested side, or if the subject tested limb became unsteady (i.e. wavered from side to side on the tested side), add 1 point. Total score of 0 or 1 was classified as good quality of movement, total score of 2 or 3 was classified as medium quality, and total score of 4 or above was classified as poor quality of move-ment.
Data analysis
Descriptive statistics, including frequency counts for cate-gorical variables and measures of central tendency and dispersion for continuous variables were calculated to summarize the data. Kolmogorov-Smirnov Z-tests were performed to assess whether continuous data approxi-mated a normal distribution. Inter-tester reliability for cat-egorical or ordinal impairment measurements was determined by a Cohen's Kappa statistics and its 95% CI [48]. Intraclass correlation coefficients (ICC) and their 95% CI were calculated for continuous measures [49,50]. The ICC model (2, 1) was used when the unit of analysis was a single measurement, and the model (2, 2) was used when the unit of analysis represented the mean of 2 rat-ings [49,50]. The mean square estimates to calculate the ICC coefficients were obtained from a random effects 2-way analysis of variance with repeated measures [50].
Calculation of the standard error of measurement (SEM) was used to determine measurement error. Results of the reliability analyses for the continuous measures were used to calculate the SEM. The SEM was calculated as (SD * v 1 - r), where r is the test-retest reliability coefficient and SD is the standard deviation of the combined scores [51,52].
The sample size was calculated a priori using Sample-Power™ (Chicago, Illinois) statistical software based on the calculation of Cohen Kappa coefficients on a dichoto-mous variable (i.e. tight or not tight during the patellar tilt test). To ensure sufficient statistical power to achieve a lower bound of the 95% confidence interval for Kappa of 0.30, assuming Kappa would be equal to 0.60, a sample size of 30 subjects was needed [48]. This sample size would also be adequate to calculate ICC coefficients on the continuous variables, given that we had 2 testers per subject, hoping for an ICC of .85, and having determined that reliability of .60 or higher would be acceptable [53].
Results
[image:7.612.58.552.520.727.2]All the continuous variables were found to approximate a normal distribution (Kolmogorov-Smirnov Z tests p > .10). Results of the reliability analysis are in Table 2. Table 2 shows the means and standard deviations of the 4 testers on the continuous variables, the percentage of findings and percentage of agreement for categorical or ordinal variables, the reliability model used during the analysis, the reliability coefficient with the 95% CI, and the stand-ard error of measurement for continuous variables. Table 3 shows the reliability coefficient values for the overall sample and for each of the two pairs of testers.
Table 2: Means and standard deviations of the 4 testers of the continuous variables, percentage of findings for categorical or ordinal variables, the reliability model used during the analysis, the reliability coefficient, the percentage of agreement for Kappa calculation, the 95% CI, and the standard error of measurement for continuous variables.
Variable (n = 30) Mean (SD) or
% of findings
Model used Reliability coefficient and % of agreement for Kappa
calculation
95% CI SEM
Hamstrings length (degrees) 81.5 (15.0) ICC (2, 2) .92 (.82; .96) 4.3 Lateral retinacular length (tight, normal) 83% tight Kappa .71 (93%) (.57; .86)
--Q-angle (degrees) 12.2 (4.3) ICC (2, 1) .70 (.46; .85) 2.4
Tibial torsion (degrees) 17.6 (5.4) ICC (2, 1) .70 (.45; .85) 2.9 Quadriceps length (degrees) 138.5 (12.3) ICC (2, 2) .91 (.80; .96) 3.8 Femoral anteversion (degrees) 12.8 (6.1) ICC (2, 1) .45 (.10; .70) 4.5 Gastrocnemius length (degrees) 9.3 (5.8) ICC (2, 2) .92 (.83; .96) 1.6 Soleus length (degrees) 16.0 (6.0) ICC (2, 2) .86 (.71; .94) 2.2 Hip external rotation strength (Kg) 17.1 (5.2) ICC (2, 2) .79 (.56; .91) 2.4 Hip abduction strength (Kg) 12.9 (4.6) ICC (2,2) .85 (.68; .93) 1.8 ITB/TFL complex length (degrees) 15.5 (11.1) ICC (2, 2) .97 (.93; .98) 2.1 Foot pronation (mm) 5.9 (2.7) ICC (2, 1) .93 (.84; .97) 0.7 Quality of movement
(from 0 to 1 = good; from 2 to 3 = medium; 4 and above = poor)
33% good 50% medium
17% poor
--Discussion
Shrout has suggested a classification of reliability coeffi-cients in which values less than 0.10 are considered virtu-ally none agreement; .11 to .40 indicate slight agreement; .41 to .60 indicate fair agreement; values between .61 and .80 indicate moderate; and values greater than .81 indi-cate substantial agreement [50]. Based on this classifica-tion the inter-tester reliability coefficients were substantial for measures of hamstrings length, quadriceps length, gas-trocnemius length, soleus length, ITB/TFL complex length, hip abductors strength, and foot pronation. Mod-erate values of reliability were observed for measures of Q-angle, tibial torsion, hip external rotation strength, lateral retinacular tightness, and test of quality of movement. Measurement of femoral anteversion resulted in fair relia-bility.
To make valid interpretation of measurements, the meas-urements must first demonstrate reasonable reliability. Interpretation of the confidence intervals around the val-ues with substantial agreement (above .80) leads to the estimation that the inter-tester reliability of these meas-ures falls anywhere between .68 and .98. Therefore, con-sidering the worst case (lower bound of the 95% CI of hip abduction strength of .68), the reliability of these meas-ures are still satisfactory for clinical use. Measmeas-ures with a moderate level of reliability had their confidence intervals ranging from .45 and .91, with the lower bound of these intervals ranging from .45 to .58, which warrants some caution when interpreting the findings of Q-angle, tibial torsion, hip external rotation strength, tightness of lateral retinacular structures, and quality of movement. Regard-ing the interpretation of femoral anteversion, both the reliability coefficient value and the confidence intervals suggest that interpretation of this test's finding may not be consistent.
We have chosen to focus our investigation on inter-tester reliability, rather than intra-tester reliability for two rea-sons. First, in today healthcare system it is becoming increasingly common to have more than one clinician treating a patient for the same episode of care. Second, data for this study was obtained as part of a larger multi-center study that investigated predictors of function in persons with PFPS. As a result, data were been collected in multiple sites by different clinicians. Furthermore, when designing this study we assumed that the levels of intra-tester reliability would be at least equal or higher than the determined inter-tester reliability.
[image:8.612.56.560.99.286.2]We are not aware of prior studies that determined the reli-ability of measuring hamstrings length using the straight leg raise test in a population of patients with PFPS. Our results support the findings in three prior studies and are in conflict with one study. Two studies that were per-formed with healthy adults and used standard goniometer to measure the straight leg raises reported intersession cor-relation of r = .88 and an ICC for inter-tester reliability of .99 for this measure [54,55]. Although we acknowledge it may not be appropriate to directly compare results of reli-ability studies that calculated Pearson correlation coeffi-cient with studies that calculated ICC, such comparison gives us at least an approximation of the consistency of the measurement. Another study with a population of patients with low back pain that used a gravity goniometer to perform the measure reported an ICC of .87 for the inter-tester reliability and a SEM of 6.4 degrees [56]. Our results conflict with the findings of Hunt et al, performed with healthy individuals [57]. They reported fair inter-tester reliability of measuring straight leg raise with an electronic inclinometer, with ICC of .54 and .48 for the left and right leg respectively [57]. Because Hunt, et al, did not provide a description of subject inclusion criteria or a
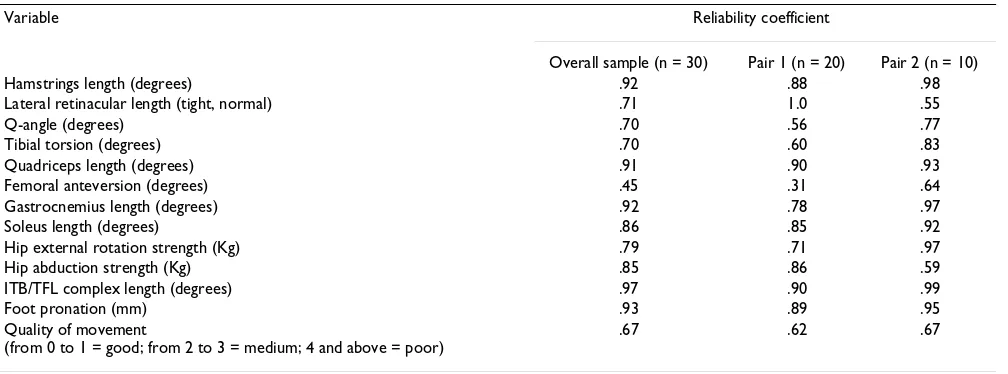
Table 3: Comparison of reliability coefficient for the overall sample and for each of the pairs of testers.
Variable Reliability coefficient
Overall sample (n = 30) Pair 1 (n = 20) Pair 2 (n = 10)
Hamstrings length (degrees) .92 .88 .98
Lateral retinacular length (tight, normal) .71 1.0 .55
Q-angle (degrees) .70 .56 .77
Tibial torsion (degrees) .70 .60 .83
Quadriceps length (degrees) .91 .90 .93
Femoral anteversion (degrees) .45 .31 .64
Gastrocnemius length (degrees) .92 .78 .97
Soleus length (degrees) .86 .85 .92
Hip external rotation strength (Kg) .79 .71 .97
Hip abduction strength (Kg) .85 .86 .59
ITB/TFL complex length (degrees) .97 .90 .99
Foot pronation (mm) .93 .89 .95
Quality of movement
(from 0 to 1 = good; from 2 to 3 = medium; 4 and above = poor)
clear description of the test procedure used in their study [57], it is not possible to speculate why their measures were less consistent than our findings or those of other studies. Perhaps the day-long time interval for inter-tester measures used in Hunt et al's study may have been too long and allowed for true variation in tissue compliance over time.
We elected to measure hamstrings length using the straight leg raise test rather than the popliteal angle test to avoid the potential for ceiling effects with the later test [46]. In our clinical experience, the ceiling effect will hap-pen with several patients with PFPS who may completely extend the knee before starting to feel the passive ham-strings resistance during the popliteal angle test. There-fore, in individuals with less hamstrings tightness, the popliteal angle will be limited on the ability to pick up subtle tightness.
Our study yielded better reliability for the patellar tilt test than that reported by Watson et al [24] Watson et al's study included mainly asymptomatic individuals (19 symptomatic and 76 asymptomatic) as subjects and stu-dents as testers. They reported inter-tester reliability with Kappa values of .20, .33, and .35 for the three pair of test-ers, with respective percent agreements of 57%, 47%, and 62% [24]. We believe our study may have had higher reli-ability because we used experienced therapists who were familiar with the test in clinical practice. Another poten-tial explanation for such difference is the exclusive use of patients diagnosed with PFPS in our study. Having only patients with PFPS may increase the incidence of positive findings and result in a more realistic determination of Kappa values. Watson et al [24] did not report the inci-dence of positive findings in their study.
Prior studies that used the same method as we did to measure Q-angle have reported lower levels of inter-tester reliability than in our study. Tomsich et al used a sample of healthy young individuals tested by therapists with experience ranging from 2.5 to 5.5 years and reported an ICC of .23 and a SEM of 3.7°[58]. Greene et al had 25 test-ers measuring each other's knees, two of whom had patel-lofemoral pain symptoms. They reported inter-tester reliability with ICC values of .20 and .26 for left and right knee respectively [11]. The better reliability in our study could be explained by better standardization of measure-ments and training of raters, or because all our subjects were diagnosed with PFPS. As increases and decreases in Q-angle are associated with increased patellofemoral pres-sures, it is possible that patients with PFPS have more var-iability in the measures of Q-angle than asymptomatic individuals [42]. The decreased data variability in the other studies may have artificially reduced the ICC values. Sutlive et al measured Q-angle on individuals with PFPS
in a standing position and reported an ICC of .40 (95% CI: .08; .70) and a SEM of 4.2°[30]. In Sutlive et al's study they do not give details about the methodology of the measure [30]. We have chosen to measure Q-angle in a non functional position to avoid contraction of the quad-riceps. Control for quadriceps contraction in a standing position is more difficult than in a supine position. Quad-riceps contraction during this measurement could pull the patella sideways and result in inconsistent readings. We believe measuring Q-angle with the participant in a supine position may yield more consistent results.
Our finding indicates a fair to poor reliability of the Craig's test to measure femoral anteversion, which is con-sistent with prior studies. One study reported Pearson cor-relation coefficient of r = .47 for inter-tester reliability of this test [15] and another study reported ICC of .17 [30]. The low reliability may be due to the difficulty in accu-rately palpating the greater trochanter and determining its most lateral position, especially in overweight individu-als. To test this hypothesis, we divided the sample accord-ing to body mass index (BMI), in which individuals with BMI of .249 or below are classified as normal or under-weight, and those with BMI of .25 or above are classified as overweight or obese [59]. The ICC for the 11 individu-als with BMI of .249 or below was .81 (95% CI .39; .95), whereas for the 19 individuals with BMI of .25 or above was .20 (95% CI -.30; .60). Therefore, it appears that in overweight individuals measurements of femoral antever-sion may be more difficult to perform and consequently less consistent. Until further study investigates the associ-ation of BMI and the consistency of femoral anteversion measures we recommend that clinicians make judgments based on the results of this measurement with caution.
Measures of dorsiflexion with the knees extended or flexed at 90° resulted in substantial reliability, which is in disagreement with prior studies. Elvery et al reported ICC of .50 for intertester reliability for ankle passive dorsiflex-ion [27]. In another study Youdas et al reported an ICC of .28 for measurements of active dorsiflexion [29]. A third study reported ICCs of .29 and .38 for ankle dorsiflexion with knee extended and flexed respectively [30]. We believe our study may have resulted in better reliability for several reasons: 1) We trained the testers to be consistent with positioning the arms of the goniometer; 2) We stabi-lized the tibia during active dorsiflexion; 3) Measuring active dorsiflexion performed by the subject removes the confounding effect of tester strength that could be a prob-lem if dorsiflexion was measured passively; 4) We used the average of two trials.
tight-ness, and foot pronation. Eng & Pierrynowski have tested the consistency of measures of quadriceps length using the quadriceps femoris muscle angle in a population of female with PFPS and reported an ICC of .94 for intra-tester reliability [60]. A prior study that examined the reli-ability of measuring hip abduction strength using a hand held dynamometer in runners with iliotibial band syn-drome reported substantial inter-tester reliability, with an ICC of 0.96 [61]. Another study used Pearson correlation coefficients to determine test-retest reliability using a hand held dynamometer in two boys with muscular dys-trophy and reported correlation coefficients of .86 for hip abduction strength [62]. In a recent study Reese & Bandy tested the reliability of measuring ITB/TFL complex in asymptomatic individuals using the Ober test as a contin-uous measure as we did and reported an ICC of .90 [63]. Sell et al investigated the reliability of measuring foot pro-nation using the navicular drop test and reported an ICC value of .73 for the inter-tester reliability [14]. In disagree-ment with our study and Sell et al study, Sutlive et al reported an ICC of .51 for the navicular drop test [30].
We identified only one study that investigated the reliabil-ity of measuring tibial torsion using the same method as we did and they reported an ICC of .32 (95% CI: .07; .53) with a SEM of 6.4° . The better reliability in our study could be explained by better standardization of measure-ments and training of raters.
Another important point of discussion when comparing our results with results from other studies is that the age of our subjects ranged from 14 to 47 years, which repre-sents a wider range than most of the other studies. Having included adolescents as well as adults formed a heteroge-neous sample and potentially created considerable differ-ence between the measurements. Higher variation in the measurement influence the within and between subjects variance, both of which can increase the ICC [49].
To our knowledge this is the first study that reports the reliability of measuring hip external rotation strength and quality of movement in patients with PFPS. Quality of movement was tested during the lateral step down test. This test was developed by our group based on the mala-daptive alterations in lower extremity function that are normally observed during physical examination in patients with PFPS [1,4,64,65]. In addition to the step down test being shown to be reliable, we believe it is able to recognize altered movement patterns commonly observed in this population [66]. Further studies should validate this test against referenced measures of function.
When comparing the reliability coefficients calculated with the data from the overall sample with the values obtained from each pair of testers, we observe that the
val-ues are consistent for most measurements. Measures that have shown greater differences between both pairs were lateral retinacular length, femoral anteversion, and hip abduction strength. These findings reiterate the above dis-cussion that measures of femoral anteversion are not reli-able and that measures of lateral retinacular length warrant some caution in its interpretation. The difference between the two pairs of testers in the measure of hip abduction strength raises additional concerns about this measurement.
An important element of the validity of measurements, and the subsequent ability to accurately interpret these measurements, relies on the evidence of satisfactory relia-bility and measurement error [67]. Poor reliarelia-bility and high levels of measurement error reduce the usefulness of a test and limit the extent to which test results can be gen-eralized [67]. Measurement error, determined in this study by calculating the SEM, refers to the hypothetical difference between an examinee's observed score on any particular measurement and the examinee's true score for the procedure [67]. Knowledge of the SEM allows us to put confidence bands around scores and provides a threshold for interpreting the test results over time. Using the SEM of hamstrings length of 4.3 degrees as an exam-ple, one can calculate a confidence interval around the obtained score. Let's suppose that the hamstrings length during the straight leg raise test was 80 degrees. If one SEM is added to the hamstrings length measure and one SEM is subtracted from it, an interval is created within which we can be 68% certain that the true measure falls. If two standard errors are added to the measure and two stand-ard errors subtracted from it, a wider interval is created, within which we can be 95% certain that the true measure falls. In our example, if a clinician measures hamstrings length 80 degrees and the SEM is 4.3 degrees, we can be 68% certain that the true hamstrings length is between 75.7 and 84.3 degrees and 95% certain that it is between 71.3 and 88.6 degrees. When interpreting changes over time, if the measure changes from 80 to 84.3 degrees from one occasion to the next, one can be 68% confident that true change has occurred, if the measure changes from 80 to 88.6 degrees, the level of confidence in such change increases to 95%. Further validation might be gained in future studies that determine how responsive to change these measurements are following interventions.
physical impairments is not known. Moreover, the SEM has several properties that make it an attractive statistic for determining clinically meaningful change. First, the SEM accounts for the possibility that some of the change observed with a particular measure may be attributable to random error. Secondly, the SEM is independent of the sample under investigation; that is, the SEM is expected to remain relatively constant for all samples taken from a given population. Third, the SEM is expressed in the orig-inal metric of the measure, aiding its interpretation [52].
One limitation of this study is that the reliability results found may be an over-estimate compared to real clinical practice. Many factors may have influenced the measure-ments collected during this research. The experimental environment may have been unrepresentative of meas-ures taken in a busy clinic. Specific aspects of clinical prac-tice may lower reliabilities values of the measures investigated in the present study. The testers in this study were well trained to perform the measures and followed a standardized protocol. In the real clinic, clinicians work under time restraints and may follow a less strict set of rules when testing their patients. Furthermore, several var-iations in technique may exist across clinicians. Even those who are very accurate in the use of the tests may never have had the opportunity to standardize their own techniques with those of colleagues. We believe the infor-mation about the reliability of the measures investigated in this study may be of clinical relevance if the clinicians who intend to use such measures are rigorous in the use of the tests as here described and if they make the effort to standardize the technique with the colleagues.
To validate the use of the measures of impairments asso-ciated with PFPS tested in this study, further research is warranted in a number of areas. It should be determined whether these impairment measurements are related to pain and function in individuals with PFPS. It should also be determined whether changes in these impairment measurements will be associated with improvement of pain and function after completing a rehabilitation pro-gram.
Conclusion
Several of the impairments associated with PFPS had good reliability. Inter-tester reliability coefficients were substan-tial for measures of hamstrings length, quadriceps length, plantar flexors length, ITB/TFL complex length, hip abductors strength, and foot pronation, which ensure valid interpretation of these tests results in clinical prac-tice. Moderate values of reliability were observed for measures of Q-angle, tibial torsion, hip external rotation strength, lateral retinacular tightness, and test of quality of movement, which warrants some caution when interpret-ing the findinterpret-ings of these tests. Measurement of femoral
anteversion resulted in fair reliability, suggesting that interpretation of this test may not be consistent. Addi-tional evidence is needed to support their use by testing if these impairment measurements are related to physical function and whether or not they can be used to guide treatment planning which ultimately would result in suc-cessful treatment outcomes.
Competing interests
The author(s) declare that they have no competing inter-ests.
Authors' contributions
SRP conceived and coordinated the study, performed sta-tistical analysis, and drafted the manuscript. KF, JJI, and JDC participated in the study design and revision of man-uscript. SJ, BRH, and DAB have acquired the data and were involved in drafting the manuscript. All authors read and approved the final manuscript.
Acknowledgements
Funding from Clinical Research Grant Program of Orthopaedic Section of American Physical Therapy Association and the Pennsylvania Physical Ther-apy Association Research Fund.
References
1. Brody LT, Thein JM: Nonoperative treatment for patellofemo-ral pain. J Orthop Sports Phys Ther 1998, 28:336-344.
2. Dehaven KE, Dolan WA, Mayer PJ: Chondromalacia patellae in athletes. Clinical presentation and conservative manage-ment. Am J Sports Med 1979, 7:5-11.
3. Rubin B, Collins R: Runner's knee. Phys Sportsmed 1980, 8:49-58. 4. Grabiner MD, Koh TJ, Draganich LF: Neuromechanics of the
patellofemoral joint. Med Sci Sports Exerc 1994, 26:10-21. 5. Sikorski JM: Importance of femoral rotation in
chondromala-cia patellae as shown by serial radiography. J Bone Joint Surg(Br)
1979, 61:435-442.
6. Duffey MJ, Martin DF, Cannon DW, Craven T, Messier SP: Etiologic factors associated with anterior knee pain in distance run-ners. Med Sci Sports Exerc 2000, 32:1825-1832.
7. Messier SP, Davis SE, Curl WW, Lowery RB, Pack RJ: Etiologic fac-tors associated with patellofemoral pain in runners. Med Sci Sports Exerc 1991, 23:1008-1015.
8. Witvrouw E, Bellemans J, Lysens R, Danneels L, Cambier D: Intrinsic risk factors for the development of patellar tendinitis in an athletic population. A two-year prospective study. Am J Sports Med 2001, 29:190-195.
9. Guyatt GH, Kirshner B, Jaeschke R: Measuring health status: what are the necessary measurement properties? J Clin Epide-miol 1992, 45:1341-1345.
10. Kirshner B, Guyatt G: A methodological framework for assess-ing health indices. J Chronic Dis 1985, 38:27-36.
11. Greene CC, Edwards TB, Wade MR, Carson EW: Reliability of the quadriceps angle measurement. Am J Knee Surg 2001,
14:97-103.
12. Rome K: Ankle joint dorsiflexion measurement studies. A review of the literature. J Am Podiatr Med Assoc 1996, 86:205-211. 13. Holmes CF, Wilcox D, Fletcher JP: Effect of a modified, low-dye medial longitudinal arch taping procedure on the subtalar joint neutral position before and after light exercise. J Orthop Sports Phys Ther 2002, 32:194-201.
techniques in the diagnosis in children and adolescents. Zeitschrift fur Orthopadie uns Ihre Grenzgebiete 1996, 134:295-301. 16. McConnell J, Fulkerson JP: The Knee: Patellofemoral and soft
tissue injuries. In Athletic Injuries and Rehabilitation Edited by: Zach-azewski JE, Magee DJ and Quillen WS. Philadelphia, PA, W.B. Saun-ders Co; 1996:693-728.
17. R H: Pelvic stability influences lower-extremity kinematics. Biomechanics 1998, 5:23-29.
18. Ireland ML, Willson JD, Ballantyne BT, Davis IM: Hip strength in females with and without patellofemoral pain. J Orthop Sports Phys Ther 2003, 33:671-676.
19. Piva SR, EA G, Childs JD: Strength around the hip and flexibility of soft tissues in individuals with and without patellofemoral pain syndrome. J Orthop Sports Phys Ther 2005, In Review:. 20. Hertling D, Kessler RM: Management of Common Musculoskeletal
Dis-orders 3rd edition. Philadelphia/PA, Lippincott; 1996:315-378. 21. Witvrouw E, Lysens R, Bellemans J, Cambier D, Vanderstraeten G:
Intrinsic risk factors for the development of anterior knee pain in an athletic population. A two-year prospective study. Am J Sports Med 2000, 28:480-489.
22. Smith AD, Stroud L, McQueen C: Flexibility and anterior knee pain in adolescent elite figure skaters. J Pediatr Orthop 1991,
11:77-82.
23. Wilk KE, Davies GJ, Mangine RE, Malone TR: Patellofemoral disor-ders: a classification system and clinical guidelines for nonop-erative rehabilitation. J Orthop Sports Phys Ther 1998, 28:307-322. 24. Watson CJ, Leddy HM, Dynjan TD, Parham JL: Reliability of the lat-eral pull test and tilt test to assess patellar alignment in sub-jects with symptomatic knees: student raters. J Orthop Sports Phys Ther 2001, 31:368-374.
25. Baggett BD, Young G: Ankle joint dorsiflexion. Establishment of a normal range. J Am Podiatr Med Assoc 1993, 83:251-254. 26. Boone DC, Azen SP: Normal range of motion of joints in male
subjects. J Bone Joint Surg Am 1979, 61:756-759.
27. Elveru RA, Rothstein JM, Lamb RL: Goniometric reliability in a clinical setting. Subtalar and ankle joint measurements. Phys Ther 1988, 68:672-677.
28. Stefanyshyn DJ, Engsberg JR: Right to left differences in the ankle joint complex range of motion. Med Sci Sports Exerc 1994,
26:551-555.
29. Youdas JW, Bogard CL, Suman VJ: Reliability of goniometric measurements and visual estimates of ankle joint active range of motion obtained in a clinical setting. Arch Phys Med Rehabil 1993, 74:1113-1118.
30. Sutlive TG, Mitchell SD, Maxfield SN, McLean CL, Neumann JC, Swiecki CR, Hall RC, Bare AC, Flynn TW: Identification of Individ-uals With Patellofemoral Pain Whose Symptoms Improved After a combined Program of Foot Orthosis use and Modi-fied Activity: A Preliminary Investigation. Phys Ther 2004,
84:49-61.
31. Powers CM, Maffucci R, Hampton S: Rearfoot posture in subjects with patellofemoral pain. J Orthop Sports Phys Ther 1995,
22:155-160.
32. Eckhoff DG, Brown AW, Kilcoyne RF, Stamm ER: Knee version associated with anterior knee pain. Clin Orthop 1997:152-155. 33. Eckhoff DG, Montgomery WK, Kilcoyne RF, Stamm ER: Femoral
morphometry and anterior knee pain. Clin Orthop 1994:64-68. 34. Cesarelli M, Bifulco P, Bracale M: Study of the control strategy of
the quadriceps muscles in anterior knee pain. IEEE Trans Reha-bil Eng 2000, 8:330-341.
35. Jensen MP, Karoly P, Braver S: The measurement of clinical pain intensity: a comparison of six methods. Pain 1986, 27:117-126. 36. Jensen MP, Turner JA, Romano JM: What is the maximum number of levels needed in pain intensity measurement? Pain
1994, 58:387-392.
37. Katz J, Melzack R: Measurement of pain. Surg Clin North Am 1999,
79:231-252.
38. Stratford PW, Binkley FM, Riddle DL: Health status measures: strategies and analytic methods for assessing change scores. Phys Ther 1996, 76:1109-1123.
39. Irrgang JJ, Snyder-Mackler L, Wainner RS, Fu FH, Harner CD: Devel-opment of a patient-reported measure of function of the knee. J Bone Joint Surg Am 1998, 80:1132-1145.
40. Marx RG, Jones EC, Allen AA, Altchek DW, O'Brien SJ, Rodeo SA, Williams RJ, Warren RF, Wickiewicz TL: Reliability, validity, and
responsiveness of four knee outcome scales for athletic patients. J Bone Joint Surg 2001, 83-A:1459-1469.
41. Kolowich PA, Paulos LE, Rosenberg TD, Farnsworth S: Lateral release of the patella: indications and contraindications. Am J Sports Med 1990, 18:359-365.
42. Huberti HH, Hayes WC: Patellofemoral contact pressures. The influence of q-angle and tendofemoral contact. J Bone Joint Surg Am 1984, 66:715-724.
43. Giallonardo LM: Clinical evaluation of foot and ankle dysfunc-tion. Phys Ther 1988, 68:1850-1856.
44. Gross MT: Lower quarter screening for skeletal malalign-ment--suggestions for orthotics and shoewear. J Orthop Sports Phys Ther 1995, 21:389-405.
45. Magee D: Orthopaedic Physical Assessment 2nd edition. Philadelphia, PA, W.B. Saunders Company; 1992.
46. Kendall FP, McCreary EK, Provance PG: Muscles Testing and Function
4th edition. Baltimore, MD, Williams & Wilkins; 1993.
47. TG MP, HG K: A survey of foot types in normal females between the ages of 18 and 30 years. J Orthop Sports Phys Ther
1985, 9:406-409.
48. Cohen J: Coefficient of agreement for nominal scales. Educ Psy-chol Meas 1960, 20:37.
49. Shrout PE, Fleiss JL: Intraclass correlations: Uses in assessing rater reliability. Psychol Bull 1979, 86:420-428.
50. Shrout PE: Measurement reliability and agreement in psychi-atry. Stat Methods Med Res 1998, 7:301-317.
51. Lydick E, Epstein RS: Interpretation of quality of life changes. Qual Life Res 1993, 2:221-226.
52. Wyrwich KW, Nienaber NA, Tierney WM, Wolinsky FD: Linking clinical relevance and statistical significance in evaluating intra-individual changes in health-related quality of life. Med Care 1999, 37:469-478.
53. SD W, M E, A D: Sample size and optimal designs for reliability studies. Statistics in Medicine 1998, 17:101-110.
54. Clark S, Christiansen A, Hellman DF, Hugunin JW, Hurst KM: Effects of ipsilateral anterior thigh soft tissue stretching on passive unilateral straight-leg raise. J Orthop Sports Phys Ther 1999,
29:4-9.
55. Hsieh CY, Walker JM, Gillis K: Straight-leg-raising test. Compar-ison of three instruments. Phys Ther 1983, 63:1429-1433. 56. Fritz JM, Piva SR: Physical impairment index: reliability,
valid-ity, and responsiveness in patients with acute low back pain. Spine 2003, 28:1189-1194.
57. Hunt DG, Zuberbier OA, Kozlowski AJ, Robinson J, Berkowitz J, Schultz IZ, Milner RA, Crook JM, Turk DC: Reliability of the lum-bar flexion, lumlum-bar extension, and passive straight leg raise test in normal populations embedded within a complete physical examination. Spine 2001, 26:2714-2718.
58. Tomsich DA, Nitz AJ, Threlkeld AJ, Shapiro R: Patellofemoral alignment: reliability. J Orthop Sports Phys Ther 1996, 23:200-208. 59. Flegal KM, Carroll MD, Ogden CL, Johnson CL: Prevalence and trends in obesity among US adults, 1999-2000. JAMA 2002,
288:1723-1727.
60. Eng JJ, Pierrynowski MR: Evaluation of soft foot orthotics in the treatment of patellofemoral pain syndrome. Phys Ther 1993,
73:62-68.
61. Fredericson M, Cookingham CL, Chaudhari AM, Dowdell BC, Oest-reicher N, Sahrmann SA: Hip abductor weakness in distance runners with iliotibial band syndrome. Clin J Sport Med 2000,
10:169-175.
62. Hyde SA, Goddard CM, Scott OM: The myometer: the develop-ment of a clinical tool. Physiotherapy 1983, 69:424-427. 63. Reese NB, Bandy WD: Use of an inclinometer to measure
flex-ibility of the iliotibial band using the Ober test and the mod-ified Ober test: differences in magnitude and reliability of measurements. J Orthop Sports Phys Ther 2003, 33:326-330. 64. Fulkerson JP: Disorders of the Patellofemoral Joint 3rd edition. Edited by:
Fulkerson JP. Baltimore, MD, Williams & Wilkins; 1997.
65. Thomee R, Renstrom P, Karlsson J, Grimby G: Patellofemoral pain syndrome in young women. I. A clinical analysis of align-ment, pain parameters, common symptoms and functional activity level. Scand J Med Sci Sports 1995, 5:237-244.
66. Vaatainen U, Airaksinen O, Jaroma H, Kiviranta I: Decreased torque and electromyographic activity in the extensor thigh muscles in chondromalacia patellae. Int J Sports Med 1995,
Publish with BioMed Central and every scientist can read your work free of charge "BioMed Central will be the most significant development for disseminating the results of biomedical researc h in our lifetime."
Sir Paul Nurse, Cancer Research UK
Your research papers will be:
available free of charge to the entire biomedical community
peer reviewed and published immediately upon acceptance
cited in PubMed and archived on PubMed Central
yours — you keep the copyright
Submit your manuscript here:
http://www.biomedcentral.com/info/publishing_adv.asp
BioMedcentral 67. Joint committee on standards for educational and
psychol-ogocal testing of the American Educational Research Asso-ciation, American Psychological AssoAsso-ciation, National Council on Measurement in Education, Standards for Educa-tional and Psychological Testing. Washington DC, American Educational Research Association; 2002.
Pre-publication history
The pre-publication history for this paper can be accessed here: