R E S E A R C H A R T I C L E
Open Access
Effect of diminished flow in rabbit lumbar
arteries on intervertebral disc matrix
changes using MRI T2-mapping and
histology
Takao Imanishi
†, Koji Akeda
*†, Koichiro Murata and Akihiro Sudo
Abstract
Background:Impaired lumbar artery flow has been reported in clinical and epidemiological studies to be associated with low back pain and lumbar disc degeneration. However, it has not been experimentally demonstrated that impaired lumbar artery flow directly induces intervertebral disc (IVD) degeneration by affecting IVD matrix metabolism. The purpose of this study was to evaluate whether ligation of the lumbar artery can affect degenerative changes in the rabbit IVD.
Methods:New Zealand White rabbits (n= 20) were used in this study. Under general anesthesia, the third and fourth lumbar arteries were double-ligated using vascular clips. The blood flow to the L3/L4 disc (cranial disc) was reduced by ligation of the third lumbar artery and that of the L5/L6 disc (caudal disc) by ligation of the fourth lumbar artery. The blood flow to the L4/L5 disc (bilateral disc) was decreased by ligation of both the third and fourth lumbar arteries. The L2/L3 disc was used as the control. Disc height was radiographically monitored biweekly until 12 weeks after surgery. The rabbits were sacrificed at 4, 8, and 12 weeks after surgery and magnetic resonance imaging (MRI) T2-mapping, histology and immunohistochemistry were assessed.
Results:Lumbar artery ligation did not induce significant changes in disc height between control and ischemic discs (cranial, bilateral and caudal discs) during the 12-week experimental period. T2-values of ischemic discs had no
significant trend to be lower than those of the control L2/L3 discs. Histologically, Safranin-O staining changed following ligation of corresponding IVD lumbar arteries. Histological grading scores for disc degeneration, which correlated significantly with MRI T2-values, had significant changes after the surgery. Immunohistochemical analysis showed that the ligation of lumbar arteries significantly affected a change in the percentage of HIF-1αimmunoreactive cells of ischemia discs compared to that of control discs four weeks after the surgery (p< 0.05).
Conclusions:The MRI and histology results suggest that diminished flow in lumbar arteries induce mild changes in the extracellular matrix metabolism of rabbit IVDs. These matrix changes, however, were not progressive and differed from the degenerative disc changes seen in the process of human IVD degeneration.
Keywords:Intervertebral disc,Lumbar artery,Disc degeneration,MRI T2-mapping, Rabbit
© The Author(s). 2019Open AccessThis article is distributed under the terms of the Creative Commons Attribution 4.0 International License (http://creativecommons.org/licenses/by/4.0/), which permits unrestricted use, distribution, and reproduction in any medium, provided you give appropriate credit to the original author(s) and the source, provide a link to the Creative Commons license, and indicate if changes were made. The Creative Commons Public Domain Dedication waiver (http://creativecommons.org/publicdomain/zero/1.0/) applies to the data made available in this article, unless otherwise stated.
* Correspondence:[email protected]
†Takao Imanishi and Koji Akeda contributed equally to this work.
Background
Low back pain is a musculoskeletal condition prevalent in the aging population that is associated with work-related disabilities and reduced quality of life [1]. Intervertebral disc (IVD) degeneration, clinically characterized by radio-graphic findings including the decreased signal intensity of magnetic resonance imaging (MRI) T2-weighted imaging [2] and disc height narrowing [3], is a proven major con-tributor to discogenic low back pain [4]. IVD degeneration is thought to result from micro-environmental changes in-fluenced by multiple contributing factors, including aging, sex, predisposing injury, genetics, and environment [5–7]. The exact mechanism of IVD degeneration has yet to be fully elucidated.
The IVD is anatomically classified as a symphysis. It consists of the gelatinous nucleus pulposus (NP) sur-rounded by the annulus fibrosus (AF), a concentrically organized lamella structure of collagen fibers. The NP is rich in an extracellular matrix (ECM) that mainly con-tains the hydrophilic proteoglycan (PG) “aggrecan” at-tached to many glycosaminoglycan (GAG) chains. A definitive biochemical feature of IVD degeneration is degradation of the ECM resulting from loss of PGs and collagens caused by the homeostatic imbalance between anabolism and catabolism [7].
Blood flow to the vertebral bodies of the lumbar spine is abundantly supplied by the lumbar arteries, branches of the abdominal aorta [8]. However, the IVD is an avas-cular structure, except for the outer-most layer of the AF [9]. Essential nutrients, such as oxygen and glucose, are supplied to the discs by capillaries that arise in the vertebral bodies and penetrate the subchondral bone (see review in [10]). These nutrients are then transported to IVD cells mainly by diffusion through the dense ECM [10]. The microenvironment of the center of the IVD is considered, therefore, to have the lowest concentration of glucose and oxygen [11].
Recent evidence shows that survival of IVD cells, par-ticularly those of the NP, in an environment of hypoxia and low glucose, is associated with expression of hypoxia inducible factor (HIF)-1α. HIF is essential in the main-tenance of anaerobic-glycolysis and cellular response to the hypoxic conditions of nutrient stress.
Because nutrient transport into IVD tissues is prob-lematic, especially into the center of the NP, interrup-tions in the supply of nutrients have been found to be strongly associated with the progression of IVD degener-ation [10].
Both clinical and epidemiological studies have indeed shown that impaired flow due to atherosclerosis of the lumbar arteries is associated with lumbar disc degener-ation and low back pain (see review in [12]). No in vivo animal study has demonstrated that impaired flow in the lumbar arteries directly induces IVD degeneration. From
results of previous studies [12–17], we hypothesized that factors that reduce the blood supply to the lumbar spine can cause micro-environmental changes within lumbar IVDs, leading to degenerative changes in IVDs.
The purpose of this study is to determine the effect of ischemia of lumbar vertebra on disc height and ECM changes using a rabbit lumbar artery ligation model.
Methods
Rabbit lumbar artery ligation model
This study was carried out in strict accordance with the recommendations in the Guide for the Care and Use of Laboratory Animals of the National Institutes of Health. The protocol of this study was approved by the Institu-tional Animal Care and Use Committee of Mie Univer-sity (reference number: 21–11). Twenty-two 12-week-old New Zealand White rabbits (female) weighing 2.4– 3.0 kg (Kitayama Labs Laboratory Animals Bleeding & Equipment Supply, Ina, Japan) were housed in separate cages under standard conditions with a light-dark cycle (12 h – 12 h) and dry-bulb room temperature at 22–24 (°C), and provided ad libitum access to tap water and food pellets daily.
Among seventeen rabbits that operated, two rabbits showed paralysis of the hind legs immediately after the surgery and not included in the experiment. These two rabbits were euthanized by carbon dioxide inhalation following premedication by the intramuscular adminis-tration of ketamine hydrochloride (25 mg/kg). 100% car-bon dioxide gas was introduced into the chamber where the rabbits were placed (with its fill rate at approxi-mately 10 to 30% of the chamber volume per minute).
The remaining fifteen rabbits showed no abnormality movement of the hind legs, and showed similar body weight changes throughout the experimental period.
Under general anesthesia induced by the intramuscu-lar administration of ketamine hydrochloride (25 mg/kg) and xylazine hydrochloride (5 mg/kg), lateral plain radio-graphs of the lumbar spine were taken before surgery and at 2, 4, 6, 8, 10, and 12 weeks after surgery. At 4, 8, and 12 weeks after surgery, five rabbits per group were euthanized as described above. Intact spinal columns were harvested for magnetic resonance imaging (MRI) and histological analyses to determine the degree of de-generation. Five 12-week-old rabbits with a sham oper-ation that only exposed the abdominal aorta were used for a 0-week control group.
Fig. 1Intraoperative picture of rabbit lumbar artery ligation. The abdominal aorta (arrow) was exposed by a retroperitoneal approach. The trunk of the lumbar artery (arrowhead) was doubly ligated using vascular clips (asterisk)
[image:3.595.58.539.88.276.2] [image:3.595.57.539.498.684.2]Radiographic analysis
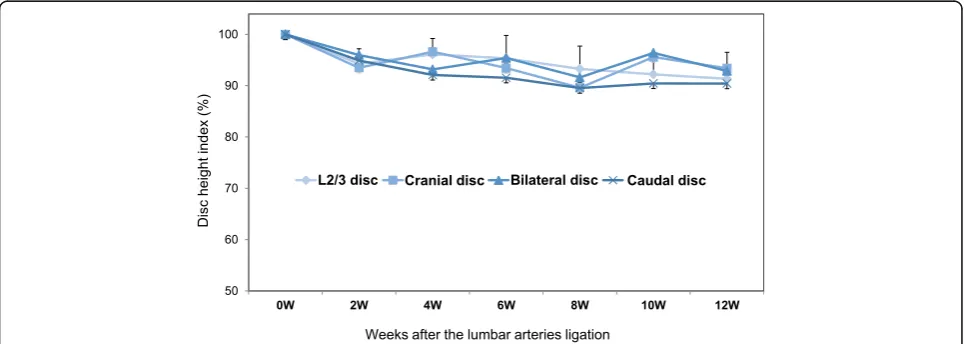
Disc height was radiographically monitored biweekly from the day of operation to 12-weeks post-operation (Fig. 3). The soft X-ray radiograms were digitized and measurements of vertebral body height and disc height using OsiriX Imaging Software (OsiriX Foundation, Geneva, Switzerland) were made by an orthopedic re-searcher blinded to the treatment group. Intervertebral disc height was expressed as the disc height index (DHI), as previously described [18]. A change in the DHI for a disc was expressed as percent disc height index (%DHI) and normalized to the measured operative disc height (%DHI = [postoperative DHI/ pre-operative DHI] × 100).
MRI T2-quantification
After the rabbits were sacrificed, the L1 to L6 vertebrae with surrounding soft tissues were isolated and wrapped by plas-tic cling film to prevent dehydration, and kept in ice box until subjecting to quantitative transverse relaxation time (T2) MRI analysis as previously reported [19]. MRI was per-formed using a 3.0-Tesla imager (Achieva 3.0 T, PHILIPS, Amsterdam, The Netherlands) with a 3″birdcage extremity coil (PHILIPS). Room temperature was kept constant at 24 °C during the MRI scan. T2 mapping was performed using a multi-echo spin-echo sequence in the sagittal plane. Scanning parameters were: Repetition Time (TR) = 3000 ms, Echo time (TE) = 20, 40, 400 ms (20 TEs), field of view = 10 cm, slice thickness = 2 mm, image matrix = 560 × 560, number of excitation = 1. Total scanning time per sam-ple was 10 min 39 s. For creating color-coded T2-maps, MR images at multiple TE were imported into OsiriX Medical Image software by a T2 mapping plug-in.
MRI analysis was performed on IVDs L2/L3, L3/L4, L4/L5 and L5/L6. Mean signal intensities were deter-mined in the regions of interest (ROI) framing the inner border of the AF on T2-weighted images taken at TE of 100 ms (Fig. 4A). Images were selected that best visual-ized the borders of the AF and NP (Fig.4B-E).
Histological analysis
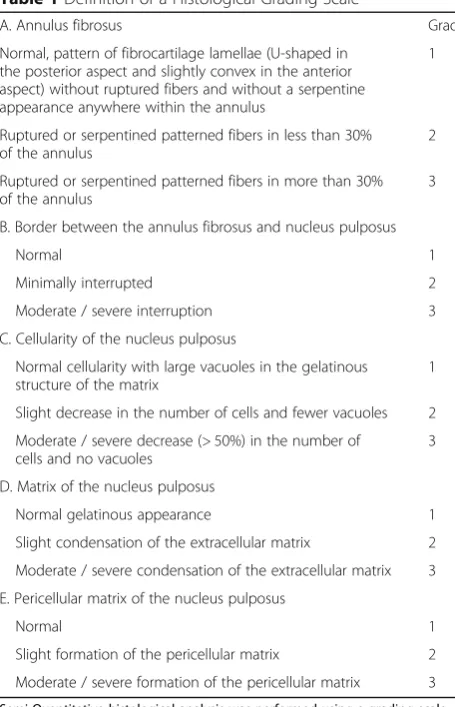
Intervertebral disc samples were harvested at 4, 8, and 12 weeks after surgery to analyze the degree of degener-ation over time. After MRI assessment, the experimental IVDs were fixed in 4% formalin, soaked in a decalcifying agent (K-CX: FALMA, Tokyo, Japan), embedded in par-affin, and sectioned midsagittally. The samples were stained with hematoxylin and eosin for analysis of cellu-lar constituents and Safranin-O for PG content. An ob-server, blinded to the experiment, analyzed the histological sections and graded them using a previously reported protocol [18, 20]. Histological grading of mid-sagittal sections was performed based on a scale using four categories of degenerative change, including (A) patterns of fibrocartilage in the lamellae of the AF, (B) the border between the AF and NP, (C) the cellularity of the NP, and (D) the matrix of the NP, as well as (E) the histological changes of the pericellular matrix of NP cells (Table1). Discs were graded with a value from 1 to 3 in each of the five parameters. A normal disc was assigned a value of 1 and a degenerated disc was assigned a value of 3. Grades ranged from 5 to 15 with a maximum of 3 points for each parameter; therefore, a grade of 15 repre-sents severe degeneration. The total scores for each disc in this semi-quantitative grading assessment were statis-tically analyzed.
[image:4.595.61.540.527.704.2]Immunohistochemical analysis
IVD samples (L2/L3 to L5/L6) of five rabbits at 4 weeks after surgery were representatively used for immunohisto-chemical analysis. Five L2/L3 discs at 4 weeks after surgery were used as the non-ischemic control. Samples were fixed, decalcified, and embedded in paraffin for serial 5μm sectioning used for immunohistochemical analysis. Fol-lowing endogenous peroxidase inactivation and heat-in-duced epitope retrieval, the sections were stained with anti-HIF-1αantibody (H1alpha67: Novus Biologicals, Lit-tleton CO, USA) for immunohistochemical analyses. Mouse IgG (DakoCytomation, Glostrup, Denmark) was used as the isotype or negative control. The sections were visualized using the universal immuno-enzyme polymer method (Histofine Simple Stain MAX-PO; Nichirei Biosci-ences, Tokyo, Japan) and 3,3′-diaminobenzidine tetrahy-drochloride (DAB; Dojindo, Tokyo, Japan), followed by counterstaining with Mayer’s hematoxylin.
The number of immunoreactive cells was counted by one observer who was blinded to the experimental group. The percentage of positive-staining cells in the outer AF (oAF), inner AF (iAF) and NP area was quantified using the mean percentage of immunopositive cells from five fields of microscopic images per sample at 200x magnification.
Statistical analysis
Differences in %DHI and MRI T2-values were assessed for statistical significance by two-way repeated measures ana-lysis of variance (ANOVA) to compare the IVD levels with time points of examination, followed by the Bonferroni post hoc test. Sample size was determined with a power analysis for an alpha of 0.05 and power of 0.80 using
A
B
D
C
E
[image:5.595.61.540.88.296.2]Fig. 4Representative color-coded T2 maps in the sagittal plane of the rabbit lumbar spine. The region of interest (ROI) was determined at the borders of the annulus fibrosus (AF) and nucleus pulposus (NP) (a). At eight weeks after surgery, compared to the control disc (b), the signal intensity in the center of the nucleus pulposus changed in the cranial disc (c), bilateral disc (d) and caudal disc (e). T2-value (ms) of each disc was indicated
Table 1Definition of a Histological Grading Scale
A. Annulus fibrosus Grade Normal, pattern of fibrocartilage lamellae (U-shaped in
the posterior aspect and slightly convex in the anterior aspect) without ruptured fibers and without a serpentine appearance anywhere within the annulus
1
Ruptured or serpentined patterned fibers in less than 30% of the annulus
2 Ruptured or serpentined patterned fibers in more than 30% of the annulus
3 B. Border between the annulus fibrosus and nucleus pulposus
Normal 1
Minimally interrupted 2 Moderate / severe interruption 3 C. Cellularity of the nucleus pulposus
Normal cellularity with large vacuoles in the gelatinous structure of the matrix
1 Slight decrease in the number of cells and fewer vacuoles 2 Moderate / severe decrease (> 50%) in the number of
cells and no vacuoles
3 D. Matrix of the nucleus pulposus
Normal gelatinous appearance 1 Slight condensation of the extracellular matrix 2 Moderate / severe condensation of the extracellular matrix 3 E. Pericellular matrix of the nucleus pulposus
Normal 1
Slight formation of the pericellular matrix 2 Moderate / severe formation of the pericellular matrix 3
[image:5.595.57.285.357.711.2]G*POWER3 [21] with a sample size of 5 animals at each time point. Histological grading scores were assessed by the Kruskal-Wallis test for inter-group comparisons and the Friedman test for temporal changes. The correlation between MRI T2-values and histological grading scores was evaluated using Spearman’s rank-order correlation test. The % of immuno-positive cells was evaluated by two-way ANOVA to compare IVD levels and disc area, followed by the Bonferroni post hoc test. All data were expressed as mean ± standard deviation (SD). All the statistical analyses were performed using IBM Statistical Package for Social Sciences Software (SPSS) Statistics (IBM Japan, Tokyo). The accepted level of significance was p< 0.05.
Results
Change in disc height
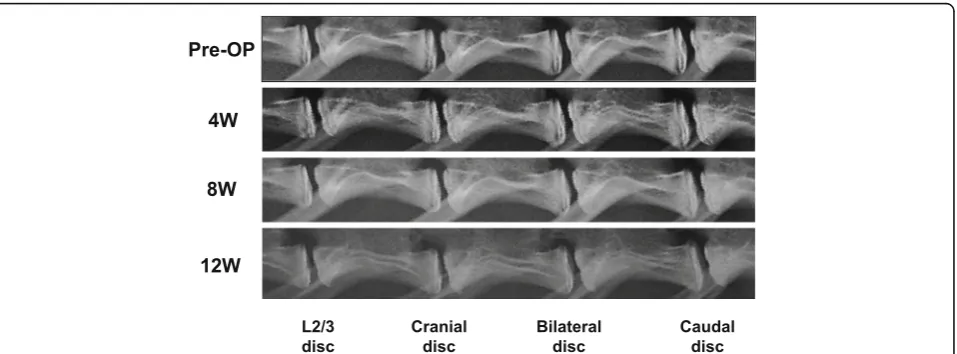
Representative radiographs before and after lumbar ar-tery ligation showed no remarkable narrowing of cranial, bilateral or caudal discs compared to before surgery and the intact L2/L3 disc of the same animal (Fig. 5). The %DHI of each experimental group significantly de-creased during the observation period (p< 0.01, 2-way repeated measures ANOVA), although the analysis of variance showed no significant interaction between disc level and time-point (p= 0.83). The %DHI at each disc level changed similarly during the observation period and no significant differences were found among the disc levels (Fig. 5). No significant differences were also seen in the %DHI among the four groups at each time point (Fig.5).
MRI assessment
Representative T2-mapping images of control (L2/L3) discs at 8 weeks postoperative showed that higher T2
values, as indicated by red pixels, were uniformly ob-served in the NP of IVDs (Fig.4B). However, the loss of red pixels, replaced by yellow pixels, was identified in the center of the NP of cranial, bilateral, and caudal discs (Fig.4C-E).
T2-values of the control, cranial, bilateral, and cau-dal discs (n= 5, respectively at each time point) showed significant decreases during the experimental period (p< 0.01, 2-way repeated measures ANOVA), although the analysis of variance showed no signifi-cant interaction between disc level and time-point (p= 0.58). The averaged T2-values of the ischemia group of cranial, bilateral and caudal discs were lower than that of the control L2/L3 group through-out the observation period but failed to reach statis-tical significance (p= 0.2, 2-way repeated measures ANOVA). No significant differences in T2-value were also found among the ischemia group of cranial, bi-lateral and caudal discs.
When the data were analyzed at each time point, the average T2-value of the cranial group was sig-nificantly lower than that of the L2/L3 control group at 4 weeks postoperative (T2-values [ms]: control: 172.1 ± 10.0, cranial: 159.2 ± 5.6, bilateral: 152.8 ± 7.5, caudal: 146.9 ± 9.5, p< 0.05 vs. control) (Fig. 6). No significant differences were seen in T2-values among the four groups at 0, 8, 12 weeks after surgery (Fig. 6).
Histological assessment
Histological changes were observed in NP tissues of cranial, bilateral, and caudal discs (n= 5, respectively at each time point) after lumbar artery ligation (Fig. 7); however no histological changes were found in AF tis-sues (Fig. 8). At 4 weeks post-ligation, the Safranin-O staining properties of the pericellular matrix of ischemic
[image:6.595.57.540.532.704.2]cranial, bilateral and caudal discs had become irregular (Fig. 7F-H). Circumferential condensation of the ECM, as shown by intense staining for Safranin-O in/around the pericellu-lar matrix, was found in the NP of cranial, bilateral and caudal disc tissues (Fig.7F-H). At 8 weeks, an irregular and circumferential staining pattern of the pericellular matrix was found in NP tissues of cranial, bilateral and caudal discs similar to those at 4 weeks post-ligation (Fig. 7J-L). At 12 weeks, diffuse staining for Safranin-O was seen in both the
pericellular and interstitial matrix in the NP of cranial, bilat-eral and caudal discs (Fig.7N-P).
In AF tissues, fibrochondrocyte-like cells were aligned lon-gitudinally between the collagen fiber bundles. However, no remarkable changes in the pattern of fibrocartilage lamellae and serpentine pattern of fibers were found (Fig.8). No rup-tured fibers were identified in the AF tissues.
The total histological grading scores showed that no significant differences among the four groups (n= 5) Fig. 6Magnetic resonance imaging (MRI) T2 values. Magnetic resonance imaging (MRI) analyses were performed at 0 (sham-operated), 4, 8 and 12 weeks after rabbit lumbar artery ligation surgery. A significant reduction in T2-values of cranial discs was observed at 4 weeks after surgery compared to the control (L2/L3) disc (p< 0.05)
A
B
C
D
E
F
G
H
I
J
K
L
M
N
O
P
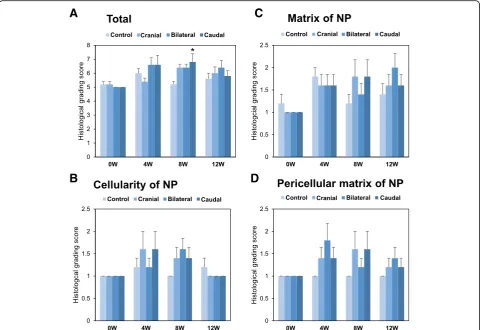
[image:7.595.56.540.87.272.2] [image:7.595.58.545.475.686.2]were seen at 0, 4 and 12 weeks post-surgery (Fig. 9A). However, lumbar artery ligation did significantly affect the total histological score of corresponding IVDs at 8 weeks after the surgery (p< 0.05, Kruskal-Wallis test) (Fig. 9A). The total scores for cranial disc were signifi-cantly increased compared to those of the L2/L3 control disc (p < 0.05, Fig.9A).
When changes in total histological scores over time were analyzed using the Friedman test, lumbar artery ligation had a significant (p < 0.05) effect on temporal changes of scores of ischemic, but not of control (L2/L3) discs. Com-pared to 0-week discs, total histological scores of caudal discs were significantly higher at 4 weeks after surgery and those of cranial, bilateral and caudal discs were significantly higher at 8 weeks after surgery. However, for all ischemic discs, no significant differences were identified at 12 weeks after surgery compared to those of 0 weeks.
When histological grading scores were evaluated for each category, the scores of the AF (category A) and the border between the AF and NP (category B) were constant at grade 1 in all discs and did not change throughout the experimental period. The histological grade of other cat-egories including NP cellularity (category B, Fig.9B), NP matrix (category C, Fig. 9C) and NP pericellular matrix (category D, Fig.9D) showed no significant differences in both the inter-group comparisons and temporal changes.
Correlation between MRI T2-values and histological grading scores
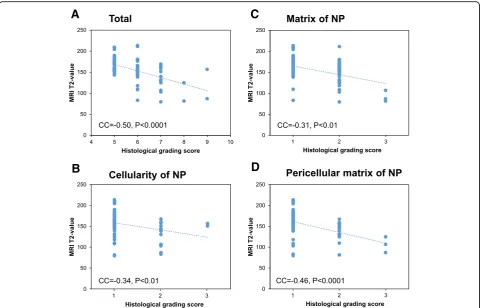
There was a significant negative correlation between MRI T2-values and total histological grading scores (correlation coefficient [CC] =−0.50, p< 0.0001, Spearman’s rank-order correlation test, Fig. 10A). A significant negative correlation was also identified between MRI T2-value and
every histological parameter of NP tissues (NP cellularity: CC =−0.34,p< 0.01; NP matrix: CC =−0.31, p < 0.01; NP pericellular matrix: CC =−0.46, p < 0.0001) (Fig.10B-D).
Immunohistological analysis of HIF-1α
HIF-1αimmunoreactivity was clearly detected in the nuclei and cytoplasm in the AF and NP cells of both control and ischemia (cranial, bilateral and caudal) discs (Fig. 11A). Statistical analysis revealed that the percentage of HIF-1α immunoreactive cells was significantly associated both with disc area (oAF, iAF, NP) and disc level (control and ische-mia discs) at 4 weeks after the ligation of lumbar arteries (p< 0.05). Analysis of variance also showed a significant interaction between the disc area and disc level (p < 0.05). A post-hoc test revealed that the percentage of HIF-1α im-munoreactive cells in the NP was significantly higher than that of the iAF (NP: 85.9 ± 9.6%, iAF: 63.5 ± 19.2%, oAF: 81.2 ± 19.8%, p < 0.01, between NP and iAF) (Fig.11B). The percentage of immunoreactive cells of caudal discs in total area (oAF, iAF and NP) was significantly higher than that of control (L2/3) discs (control discs: 71.3 ± 25.4%, cranial discs: 78.7 ± 15.8%, bilateral discs: 77.2 ± 18.3%, caudal discs: 80.2 ± 15.6%, p < 0.05 between control and caudal discs) (Fig.11B).
Discussion
The effect of ischemia of lumbar vertebrae on degenera-tive changes in a rabbit lumbar artery ligation model was evaluated in this study using radiographic disc height measurement and ECM changes of corresponding IVDs for this assessment. Our results indicate that lumbar ar-tery ligation induced no significant change in disc height over the experimental period compared to control discs. On the other hand, MRI T2-values in the NP of
A
B
C
D
E
F
G
H
I
J
K
L
M
N
O
P
[image:8.595.59.540.88.266.2]corresponding IVDs showed a tendency to decrease com-pared to control discs. Histological analyses showed changes in Safranin-O staining properties of correspond-ing IVDs followcorrespond-ing lumbar artery ligation.
Several experimental animal models of the process of IVD degeneration have been developed, although no ani-mal model that completely mimics human IVD degener-ation currently exists [22]. Hou and colleagues recently reported a rabbit model for ischemic lumbar vertebrae in-duced by injection of pingyangmycin into vertebrae adja-cent to the endplate and found that IVD degeneration was actually induced in this model [23]. Importantly, they also examined the anatomy of rabbit lumbar arteries using digital subtraction angiography (DSA) and vascular cast, and reported that, differing from human anatomy, the trunk of the lumbar arteries started directly from the aorta, divided into right and left branches that subdivided into internal and external branches going to several areas of the lumbar spine [23]. Therefore, in our animal model, blood flow of the third and fourth lumbar arteries would be almost completely impaired by double ligation of those trunks using vascular clips (Fig. 1). Our model using
ligation of rabbit lumbar arteries could be thought of as a vertebral ischemia model impairing blood flow to the lum-bar spine more proximally than the model reported by Hou et al. [23].
Transverse relaxation time (T2) mapping has been shown to quantitatively evaluate changes in molecular composition and structural integrity of IVDs [24–26]. Pre-vious studies have shown significant correlation between T2 values, water and PG content and arrangement of the collagen network structure [24,27]. The NP, playing a role as an internal semi-fluid mass, is rich in the large, nega-tively-charged proteoglycans (PGs) [28]. The PGs consist of a core protein that is covalently attached to glycosami-noglycan (GAG) chains, which are responsible for a water-retaining property of the NP. Therefore, T2-value of the NP reflects water concentration, which is also associ-ated with the biochemical function of extracellular matrix molecules such as large PGs“aggrecan.”
T2-values in human IVDs have been shown to be sig-nificantly correlated with the stage of disc degeneration [24–26]. Recent studies have reported that this MRI technique can detect matrix changes in the very early
A
C
B
D
[image:9.595.58.539.88.418.2]stages of disc degeneration [28, 29] and from physio-logical loading [30]. The results of our T2-mapping evaluation indicated that the T2-value had decreased in the center of NP tissues of the ischemia group. Because the microenvironment in the center of the NP is poor in oxygen and nutrient transport [10], we speculated that lumbar artery ligation in this animal model would fur-ther worsen the microenvironment of NP tissues.
Although T2-values of the ischemia group in our study tended to decrease compared to the control group, sig-nificance by two-way repeated measures ANOVA was not achieved. While significance might be obtained by increasing the number of animals, lumbar artery ligation would have only a mild effect on the matrix metabolism of the rabbit NP rather than inducing degenerative changes similar to human IVD degeneration.
Disc height narrowing, representing structural changes of IVDs, is a representative clinical sign of disc degener-ation seen in lumbar radiographs. In this study, %DHI of the control and ischemia groups did not differ significantly throughout the observation period, indicating that ligation of lumbar arteries in this model did not affect to induce structural changes in corresponding IVDs. However, the %DHI of both the control and ischemia groups showed a
slight, but significant, decrease from week 0 to 12. Verte-bral heights at corresponding levels for measurement of DHI (L2-L6) continuously increased until 12 weeks after surgery (data not shown), while the disc height of corre-sponding IVDs did not increase significantly (data not shown). The discrepancy between the increase of vertebral and IVD height by growth is attributable to the relative decrease in %DHI in this rabbit model.
Safranin-O is a cationic dye composed of a mixture of dimethyl phenosafranin and trimethyl phenosafranin with a specific stoichiometric potential to bind glycosaminogly-cans (GAGs) [31]. Safranin-O is, therefore, used for quan-tification and histological analysis of GAGs in articular cartilage and IVDs. The results of our study showed that staining patterns of Safranin-O in the NP changed after lumbar artery ligation, particularly in the pericellular area of corresponding IVDs, but not in AF tissues.
IVD cells, as well as chondrocytes, are surrounded by a narrow pericellular matrix (PCM) that plays a vital role in the biochemical and biomechanical properties of IVD cells [32–36]. The PCM is composed of a number of extracellular molecules, including a high concentration of the GAG-rich PG“aggrecan”[32]. In a three-dimensional alginate culture system, the PCM matrix metabolism is
A
C
[image:10.595.58.539.87.395.2]B
D
faster and more active than in other ECM regions [33– 36]. Our histological observations of the rabbit NP suggest that matrix metabolism synthesis, especially aggrecan, would be stimulated in the PCM in response to ischemia in corresponding IVDs. Previous studies have shown that the mRNA expression of aggrecan by bovine NP cells was stimulated by hypoxia in vitro [37]. Furthermore, the ex-pression ofβ-1,3-glucuronyltransferase 1 (GlcAt-1), a key
enzyme in GAG synthesis, was increased under hypoxic conditions in vitro [38]. We evaluated the immunohisto-chemical expression of HIF-1α in the control and ische-mia discs four weeks after surgery. Two-way ANOVA revealed that the ligation of lumbar arteries significantly affected a change in the percentage of HIF-1α immunore-active cells of ischemia discs compared to that of control discs. Therefore, we speculated that ischemia of the
A
[image:11.595.64.539.84.540.2]B
lumbar spine produced by lumbar artery ligation would stimulate the synthesis of aggrecan, particularly in the NP of corresponding IVDs.
Total histological scores of cranial discs were signifi-cantly higher than those of control discs at 8 weeks after surgery; however no significant differences were identified between the control and ischemia group at other time points. Temporal changes in histological scores revealed that those scores had significantly increased at 4 and 8 weeks after ligation in the ischemia group, although no significant increases were identified at 12 weeks. This sug-gests that the histological changes following lumbar artery ligation were not progressive, but rather mild. Interest-ingly, the results of MRI analyses showed a significant in-verse correlation between MRI T2-value and total histological score. When this correlation was independ-ently evaluated for each category of the NP, the highest correlation coefficient was identified with the category of “NP pericellular matrix.”We speculated that the decrease in MRI T2-value in the ischemia groups would corres-pond with changes in the matrix integrity of the NP as evaluated by the staining properties of Safranin-O.
However, the matrix changes in the young rabbit NP were mild, and we found no progressive histological de-generative changes or structural changes that are found in human IVD degeneration. The rabbits at this age used in this study were skeletal immature [39], and those discs have a large number of notochordal cells which have great potential to regulate matrix metabolism in-cluding the synthesis of extracellular matrix [40–42]. Therefore, the author speculates that IVD tissues of young rabbits have the potential to resist and/or repair ischemic changes in the lumbar IVDs.
Clinically, degenerative disc diseases commonly develop in middle-aged or older human populations. In many cases, these populations already have systemic atheroscler-osis and/or lumbar spondylatheroscler-osis changes, including IVD degeneration. There would be the possibility that impaired flow in lumbar arteries may enhance the degenerative changes of IVDs in middle-aged or aged-populations.
There are several limitations in this study. First, we did not perform arteriography to evaluate ischemia in the lumbar spines. Therefore, the extent of lumbar spine is-chemia and the existence of collateral arteries to the cor-responding vertebral levels remain unknown. The second limitation is that 12-week-old New Zealand White rabbits, roughly juvenile in human terms, were used in this study. Ideally, older rabbits should be used to evaluate the associ-ation between spinal ischemia and the disc degenerassoci-ation found in human IVDs. The third limitation is that sham operation that only exposed the abdominal aorta was only used for a 0-week control group. Therefore, it cannot be denied the possibility that ligation of lumbar arteries influ-enced the blood flow of control (L2/3) disc at 4, 8, and 12
weeks after surgery. Forth, it has been reported that the response of rabbit IVDs against external stimuli such as disc puncture varies dependent on the disc level, probably due to the difference in disc volume [43]. Therefore, there is a possibility that the effect of diminishing flow on disc matrix changes in this animal model may differ between the upper and lower disc level. Lastly, it has been reported that T1 and T2 relaxation times were significantly influ-enced by the temperature of samples [44, 45]. Although the temperature of the rabbit IVD samples was not mea-sured in this study, it would be great importance to meas-ure the temperatmeas-ure of the samples and keep it constant during the MRI scan using a temperature probe in a temperature-controlled condition for accurately evaluating the T2-values of samples.
Conclusions
In this study, we tested the hypothesis that ischemia of lumbar vertebrae initiates degenerative changes in corre-sponding IVDs. We used a rabbit lumbar artery ligation model. The results of this study reveal that the micro-environment, as evaluated by MRI T2-mapping and staining properties with Safranin-O, has in fact been changed in NP tissues after lumbar artery ligation. Fur-ther study using older rabbits is needed to evaluate the effect of impaired flow in lumbar arteries on degenera-tive changes in corresponding IVDs.
Abbreviations
AF:Annulus fibrosus; ANOVA: Analysis of variance; CC: Correlation coefficient; DHI: Disc height index; ECM: Extracellular matrix; GAGs: Glycosaminoglycans; GLUT1: Glucose transporters 1; HIF: Hypoxia inducible factor;
IVD: Intervertebral disc; MRI: Magnetic resonance imaging; NP: Nucleus pulposus; PCM: Pericellular matrix; PGs: Proteoglycans; ROI: Regions of interest; TE: Time-to-Echo; TR: Time-to-Repeat
Acknowledgments
The authors would like to acknowledge Takahiro Iino and Katsura Chiba for their assistance in the preparation of tissue specimens and immunohistochemical analysis.
Authors’contributions
TI performed the animal study, data acquisition and drafted the manuscript. KA performed the animal study, data acquisition and statistical analyses and drafted the manuscript, conceived of and made substantial contributions to the design of this study. KM performed immunohistochemical analyses (data acquisition), and revised the manuscript. AS contributed to the study design and coordination and revised the manuscript. All authors read and approved the final manuscript.
Funding Not applicable.
Availability of data and materials
The datasets used and/or analyzed during the current study available from the corresponding author on reasonable request.
Ethics approval and consent to participate
The protocol of this study was approved by the Institutional Animal Research Committee of Mie University.
The authors declare that they have no competing interests.
Received: 13 December 2018 Accepted: 15 July 2019
References
1. Gore M, Sadosky A, Stacey BR, Tai KS, Leslie D. The burden of chronic low back pain: clinical comorbidities, treatment patterns, and health care costs in usual care settings. Spine (Phila Pa 1976). 2012;37(11):E668–77. 2. Pfirrmann CW, Metzdorf A, Zanetti M, Hodler J, Boos N. Magnetic resonance
classification of lumbar intervertebral disc degeneration. Spine (Phila Pa 1976). 2001;26(17):1873–8.
3. Akeda K, Yamada T, Inoue N, Nishimura A, Sudo A. Risk factors for lumbar intervertebral disc height narrowing: a population-based longitudinal study in the elderly. BMC Musculoskelet Disord. 2015; 16:344.
4. Cheung KM, Karppinen J, Chan D, Ho DW, Song YQ, Sham P, et al. Prevalence and pattern of lumbar magnetic resonance imaging changes in a population study of one thousand forty-three individuals. Spine (Phila Pa 1976). 2009;34(9):934–40.
5. Ikegawa S. The genetics of common degenerative skeletal disorders: osteoarthritis and degenerative disc disease. Annu Rev Genomics Hum Genet. 2013;14:245–56.
6. Kepler CK, Ponnappan RK, Tannoury CA, Risbud MV, Anderson DG. The molecular basis of intervertebral disc degeneration. Spine J. 2013;13(3):318–30. 7. Vo NV, Hartman RA, Patil PR, Risbud MV, Kletsas D, Iatridis JC, et al.
Molecular mechanisms of biological aging in intervertebral discs. J Orthop Res. 2016;34(8):1289–306.
8. Crock HV, Yoshizawa H. The blood supply of the lumbar vertebral column. Clin Orthop Relat Res. 1976;115:6–21.
9. Hassler O. The human intervertebral disc. A micro-angiographical study on its vascular supply at various ages. Acta Orthop Scand. 1969;40(6):765–72. 10. Urban JP, Smith S, Fairbank JC. Nutrition of the intervertebral disc. Spine
(Phila Pa 1976). 2004;29(23):2700–9.
11. Holm S, Maroudas A, Urban JP, Selstam G, Nachemson A. Nutrition of the intervertebral disc: solute transport and metabolism. Connect Tissue Res. 1981;8(2):101–19.
12. Kauppila LI. Atherosclerosis and disc degeneration/low-back pain--a systematic review. Eur J Vasc Endovasc Surg. 2009;37(6):661–70. 13. Kauppila LI, McAlindon T, Evans S, Wilson PW, Kiel D, Felson DT. Disc
degeneration/back pain and calcification of the abdominal aorta. A 25-year follow-up study in Framingham. Spine (Phila Pa 1976). 1997;22(14):1642– 1647; discussion 8-9.
14. Kauppila LI, Mikkonen R, Mankinen P, Pelto-Vasenius K, Maenpaa I. MR aortography and serum cholesterol levels in patients with long-term nonspecific lower back pain. Spine (Phila Pa 1976). 2004; 29(19):2147–52.
15. Kauppila LI, Penttila A, Karhunen PJ, Lalu K, Hannikainen P. Lumbar disc degeneration and atherosclerosis of the abdominal aorta. Spine (Phila Pa 1976). 1994;19(8):923–9.
16. Kurunlahti M, Kerttula L, Jauhiainen J, Karppinen J, Tervonen O. Correlation of diffusion in lumbar intervertebral disks with occlusion of lumbar arteries: a study in adult volunteers. Radiology. 2001; 221(3):779–86.
17. Kurunlahti M, Tervonen O, Vanharanta H, Ilkko E, Suramo I. Association of atherosclerosis with low back pain and the degree of disc degeneration. Spine (Phila Pa 1976). 1999;24(20):2080–4.
18. Masuda K, Imai Y, Okuma M, Muehleman C, Nakagawa K, Akeda K, et al. Osteogenic protein-1 injection into a degenerated disc induces the restoration of disc height and structural changes in the rabbit anular puncture model. Spine (Phila Pa 1976). 2006;31(7):742–54.
19. Obata S, Akeda K, Imanishi T, Masuda K, Bae W, Morimoto R, et al. Effect of autologous platelet-rich plasma-releasate on intervertebral disc degeneration in the rabbit anular puncture model: a preclinical study. Arthritis Res Ther. 2012;14(6):R241.
20. Chujo T, An HS, Akeda K, Miyamoto K, Muehleman C, Attawia M, et al. Effects of growth differentiation factor-5 on the intervertebral disc--in vitro bovine study and in vivo rabbit disc degeneration model study. Spine (Phila Pa 1976). 2006; 31(25):2909–17.
analysis program for the social, behavioral, and biomedical sciences. Behav Res Methods. 2007;39(2):175–91.
22. Daly C, Ghosh P, Jenkin G, Oehme D, Goldschlager T. A review of animal models of intervertebral disc degeneration: pathophysiology, regeneration, and translation to the clinic. Biomed Res Int. 2016; 2016:5952165.
23. Hou C, Tan G, Zhuang W, Yang J. Establishment of a new animal model for ischemic lumbar vertebrae. Int J Clin Exp Med. 2015;8(7):10646–56. 24. Marinelli NL, Haughton VM, Anderson PA. T2 relaxation times correlated
with stage of lumbar intervertebral disk degeneration and patient age. AJNR Am J Neuroradiol. 2010;31(7):1278–82.
25. Perry J, Haughton V, Anderson PA, Wu Y, Fine J, Mistretta C. The value of T2 relaxation times to characterize lumbar intervertebral disks: preliminary results. AJNR Am J Neuroradiol. 2006;27(2):337–42.
26. Watanabe A, Benneker LM, Boesch C, Watanabe T, Obata T, Anderson SE. Classification of intervertebral disk degeneration with axial T2 mapping. AJR Am J Roentgenol. 2007;189(4):936–42.
27. Antoniou J, Pike GB, Steffen T, Baramki H, Poole AR, Aebi M, et al. Quantitative magnetic resonance imaging in the assessment of degenerative disc disease. Magn Reson Med. 1998;40(6):900–7. 28. Menezes-Reis R, Salmon CE, Bonugli GP, Mazoroski D, Tamashiro MH,
Savarese LG, et al. Lumbar intervertebral discs T2 relaxometry and T1rho relaxometry correlation with age in asymptomatic young adults. Quant Imaging Med Surg. 2016;6(4):402–12.
29. Pandit P, Talbott JF, Pedoia V, Dillon W, Majumdar S. T1rho and T2 -based characterization of regional variations in intervertebral discs to detect early degenerative changes. J Orthop Res. 2016;34(8):1373–81.
30. Chokan K, Murakami H, Endo H, Mimata Y, Yamabe D, Tsukimura I, et al. Evaluation of water retention in lumbar intervertebral disks before and after exercise stress with T2 mapping. Spine (Phila Pa 1976). 2016;41(7):E430–6. 31. Kiviranta I, Jurvelin J, Tammi M, Saamanen AM, Helminen HJ.
Microspectrophotometric quantitation of glycosaminoglycans in articular cartilage sections stained with safranin O. Histochemistry. 1985;82(3):249–55. 32. Wilusz RE, Sanchez-Adams J, Guilak F. The structure and function of the
pericellular matrix of articular cartilage. Matrix Biol. 2014;39:25–32. 33. Thonar E, An H, Masuda K. Compartmentalization of the matrix formed by
nucleus pulposus and annulus fibrosus cells in alginate gel. Biochem Soc Trans. 2002;30(Pt 6):874–8.
34. Chiba K, Andersson GB, Masuda K, Thonar EJ. Metabolism of the extracellular matrix formed by intervertebral disc cells cultured in alginate. Spine (Phila Pa 1976). 1997;22(24):2885–93.
35. Hauselmann HJ, Masuda K, Hunziker EB, Neidhart M, Mok SS, Michel BA, et al. Adult human chondrocytes cultured in alginate form a matrix similar to native human articular cartilage. Am J Phys. 1996;271(3 Pt 1):C742–52.
36. Hauselmann HJ, Fernandes RJ, Mok SS, Schmid TM, Block JA, Aydelotte MB, et al. Phenotypic stability of bovine articular chondrocytes after long-term culture in alginate beads. J Cell Sci. 1994;107(Pt 1):17–27.
37. Mwale F, Ciobanu I, Giannitsios D, Roughley P, Steffen T, Antoniou J. Effect of oxygen levels on proteoglycan synthesis by intervertebral disc cells. Spine (Phila Pa 1976). 2011;36(2):E131–8.
38. Gogate SS, Nasser R, Shapiro IM, Risbud MV. Hypoxic regulation of beta-1,3-glucuronyltransferase 1 expression in nucleus pulposus cells of the rat intervertebral disc: role of hypoxia-inducible factor proteins. Arthritis Rheum. 2011;63(7):1950–60.
39. Gilsanz V, Roe TF, Gibbens DT, Schulz EE, Carlson ME, Gonzalez O, et al. Effect of sex steroids on peak bone density of growing rabbits. Am J Phys. 1988;255(4 Pt 1):E416–21.
40. Kim KW, Lim TH, Kim JG, Jeong ST, Masuda K, An HS. The origin of chondrocytes in the nucleus pulposus and histologic findings associated with the transition of a notochordal nucleus pulposus to a fibrocartilaginous nucleus pulposus in intact rabbit intervertebral discs. Spine (Phila Pa 1976). 2003;28(10):982–90.
41. MR MC, Seguin CA. Notochord Cells in Intervertebral Disc Development and Degeneration. J Dev Biol. 2016;4(1).
42. Scott NA, Harris PF, Bagnall KM. A morphological and histological study of the postnatal development of intervertebral discs in the lumbar spine of the rabbit. J Anat. 1980;130(Pt 1):75–81.
43. Martin JT, Collins CM, Ikuta K, Mauck RL, Elliott DM, Zhang Y, et al. Population average T2 MRI maps reveal quantitative regional
44. Baron P, Deckers R, Knuttel FM, Bartels LW. T1 and T2 temperature dependence of female human breast adipose tissue at 1.5 T: groundwork for monitoring thermal therapies in the breast. NMR Biomed. 2015;28(11): 1463–70.
45. Zech WD, Schwendener N, Persson A, Warntjes MJ, Jackowski C. Temperature dependence of postmortem MR quantification for soft tissue discrimination. Eur Radiol. 2015;25(8):2381–9.
Publisher’s Note