2019 2nd International Conference on Informatics, Control and Automation (ICA 2019) ISBN: 978-1-60595-637-4
Analysis of Insulator Leakage Current under Fog and Haze Conditions
Based on K-means Algorithm
Yu-hang GUO, Ruo-bing HAN
and Yun-zhi XU
*School of Electrical and Power Engineering, China University of Mining and Technology, Xuzhou 221116, Jiangsu Province, People's Republic of China
*Corresponding author
Keywords: Leakage current, K-means algorithm, Silhouette coefficient, Fog and haze, Insulators.
Abstract. When fog and haze weather occurs, insulator flash over accident is easy to happen, which have adverse effects on the safe and stable operation of the power system. The insulators leakage current under different haze components was measured by simulating the haze environment in the laboratory. The K-means algorithm is used to analyze the leakage current of insulators. By comparing the silhouette coefficient of the insulator leakage current under different fog and haze environment, it is found that the silhouette coefficient can be taken as the characteristic value of fog and haze environment. The relationship between the silhouette coefficient of leakage current and the fog and haze environment is summarized.
Introduction
As an significant component of the power system, insulators flashover accidents are easy to happen in the fog and haze environment due to the harsh working environment, which results in serious consequences[3]. When fog and haze weather occurs, the air humidity will become high, which leads to an increase of the humidity and the conductivity of the insulators surface. Also, there are a large number of particles in the fog and haze, which deposit on the insulators surface and increase the pollution degree. When the insulator surface is moistened, the contamination layer will be affected by moisture, and the contamination will be dissolved. The soluble salt ion content in it will be higher and higher with the increase of the contamination degree and the humidity degree, and the leakage current will also increase, which may cause the occurrence of pollution flashover. Power accidents caused by fog and haze occur from time to time. For example, in February 2001, rare fog and haze weather occurred in north and northeast China and Henan. According to statistics, there were about 238 power failure lines this time, which had a huge impact on power operation[4]. Therefore, it is necessary to study the leakage current of insulators in fog and haze environment. In this paper, K-means clustering analysis is carried out on leakage current, and the relationship between silhouette coefficient and fog-haze environment is obtained.
K-means Algorithm
K-means algorithm is a clustering algorithm based on distance division, where K represents the number of cluster and means represents the mean. Its principle is simple, and it is easy to realize. Also, the clustering effect is very nice, so it is widely used.
Algorithm Procedure
Input: sample data X, number of cluster K, the maximum number of iterations N;
Output: division result of the cluster (K clusters, making the sum of squares error minimum). Euclidean distance:
n
i
i
i y
x Y
X dist
1
2
, (1)
2 1 i
Ki x ci
a x
SSE . (2)
where ai is the mean vector of the cluster ci, which is the center of mass.
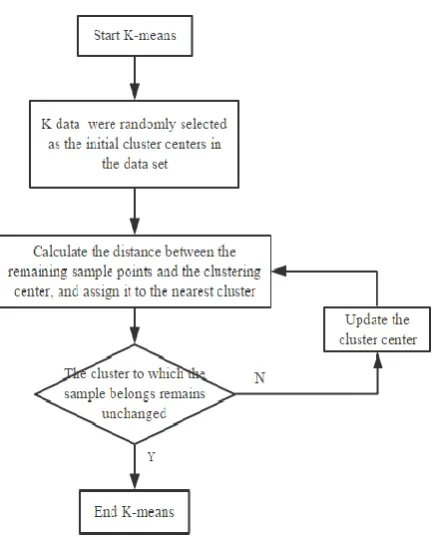
Steps of K-means algorithm:
(1) Select K initial centers of mass. C = {a1, a2, a3, ..., ak } .
(2) For each data, calculate the distance from it to all the center of mass and select the cluster nearest to it and put it into it.
(3) Calculate the mean value in the cluster and update the center of mass.
i c x j j x c a 1 (3) (4) Repeat the above two steps until certain conditions are met.Advantages and Disadvantages of the Algorithm
Advantages:
(1)Simple principle and easy implementation.
(2)Good clustering effect (depending on the choice of K value). (3)When the data is large, the scalability is good.
Disadvantages:
(1)K value needs to be determined by yourself, which affects the result. (2)Sensitive to outliers and noise.
(3)When the data scale is large, the running time is relatively long. (4)The result is not necessarily globally optimal, but only locally optimal.
Silhouette Coefficient
Silhouette Coefficient is a method for evaluating the clustering quality. It combines the concept of Cohesion and Separation. The range of this value is -1~1. If the value is large, it indicates that the clustering result is excellent.
The calculation formula of the silhouette coefficient is:
-1,1 , i a max i a -i b S i
i b i
S (4)
where a(i) is the average distance between Xi and all points in the same cluster, which is called the degree of cohesion;b(i) is the minimum value of the average distance between Xi and all points in the non-same cluster, which is called the degree of separation.
Figure out the silhouette coefficient of all points, and then calculate the average value, and you get the average silhouette coefficient. The larger the silhouette coefficient, the better the result.
Insulators Leakage Current Collection on Fog and Haze Days
Table 1. Composition of fog water in each group.
Number Fog water composition
1 No
2 Distilled water
3 m (NaNO3): m (Na2SO4)=1:16,add 1 part water 4 m (NaNO3): m (Na2SO4)=16:1,add 1 part water 5 m (NaNO3): m (Na2SO4)=16:1,add 3 part water
The experimental procedure:
(1)Sample Pretreatment. Wash the insulator with water to remove dirt and then let it dry.
(2)Prepare the pollutant, 13902mg kaolin and 1390.2mg sodium chloride for each pollutant, to simulate the severe degree of pollution of ESDD=0.2mg/cm2 and NSDD=2mg/cm2. Add water to mix the contaminant into a paste and apply it evenly to the insulator surface with a brush.
(3)Connect the experimental equipment according to figure 2.
(4)Use the prepared solution to moisten the contaminated sample until the humidity is saturated.
(5)Increase the voltage evenly until flashover.
(6)Record leakage current data of each group.
Denoising of Leakage Current
The data we get from experiments usually contains noise. Before analyzing the data, denoising should be carried out. We choose the wavelet threshold denoising. The denoising of white noise is ideal and easy to be realized.
Figure 2. Experimental schematic diagram.
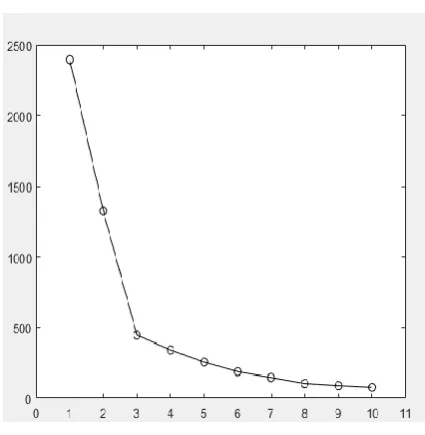
Figure 3. Relation between K value and SSE.
Analyze Leakage Current Characteristics by Using the K-means Algorithm
Determine K Value
Select a group of data as the research object. We selected the spray with high concentration nitrate for analysis. The following is the selection of K value through the elbow rule.
As can be seen from Fig.3, when K=3, there is an inflection point, and the descending amplitude is different before and after, so it is considered that when K=3, the clustering effect is the best.
Leakage Current Clustering Analysis
K=3 has been determined above, and clustering analysis is adopted for data with different leakage currents below. Some results are shown in Fig.4-5.
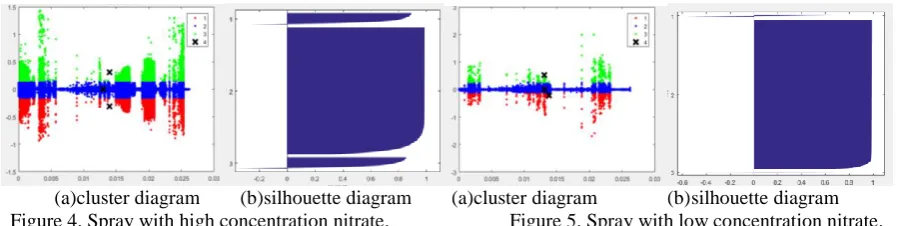
[image:4.595.190.403.294.512.2]that the parts that have a greater impact on insulators are those that have a higher current amplitude, but a smaller proportion, which indicates that this small part of current determines the impact on insulators.
The following conclusions can be drawn:
(1)With the same concentration, compared with sulfate and nitrate, when the wetting layer is sulfate solution, the part of large leakage current amplitude takes up a larger proportion. This shows that the sulfate solution has a greater impact on insulators. When the haze is dominated by sulfate, insulators will be in a more unfavorable situation.
(2)By comparing the figure with a higher and a lower concentration of nitrate, it can be found that, when the composition of haze is the same, if the concentration is higher, the part of large leakage current amplitude accounts for a larger proportion, which indicates that compared with a lower concentration, a higher concentration of haze has a greater impact on insulators.
(a)cluster diagram (b)silhouette diagram (a)cluster diagram (b)silhouette diagram Figure 4. Spray with high concentration nitrate. Figure 5. Spray with low concentration nitrate.
Table 2. Silhouette coefficient of different haze (K=3).
Haze component silhouette diagram No filth, no spray. 0.9848 Filth, cleaning fog 0.3332 Filth, sulfate spray 0.4442 Filth, Spray with high concentration nitrate 0.9136 Filth, Spray with low concentration nitrate 0.9701
Table 2 is the silhouette coefficient obtained by clustering the leakage current of insulators in different haze environments.
As can be seen from table 2:
(1)When K=3, it can be seen that the clustering effect of leakage current of insulators with different haze components is different, and the silhouette coefficient obtained is different. Therefore, we can take the silhouette coefficient as the characteristic value to represent the haze environment of insulators.
(2)With the same haze composition, the silhouette coefficient at a higher concentration of haze is smaller than that at a lower concentration.
(3)When haze concentration is the same, the silhouette coefficient of sulfate fog is smaller than that of nitrate fog.
Conclusion
In this paper, the running conditions of insulators in fog and haze days are simulated. The K-means algorithm was used to analyze the characteristics of insulator leakage current under different haze environments, and it was found that the influence of high haze concentration on insulators was greater, and the influence of sulfate type haze on insulators was greater than that of nitrate type.
To some extent, the silhouette coefficient of clustering results can be used as the characteristic value to measure the working environment of insulators, and the relationship between the silhouette coefficient and haze environment can be established.
[image:5.595.74.523.241.354.2]References
[1] Y. Xu, H. Zheng, K. Zhao, N. Bian. Analysis of Insulator Leakage Current under Fog and Haze Conditions Based on Fractal Theory[J]. Colliery Mechanical & Electrical Technology, 2018(06): 33-37.
[2] Y. Xu, Q. Ge, G. Li. Research on Leakage Current Characteristics of Insulator under Fog and Haze[J]. Research and Exploration in Laboratory, 2017, 36(03): 36-40.
[3] Xiaobin Jing. Study on the Leakage Current Characteristics and State Detection of catenary Leakage [D]. Southwest Jiaotong University, 2015.
[4] Lei Gao. Study on External Insulation Characteristics of Power Transmission and Substation Equipment in Fog and Haze[D]. Shenyang University of Technology, 2017.
[5] M. Albano, R. T. Waters, P. Charalampidis, H. Griffiths and A. Haddad, "Infrared analysis of dry-band flashover of silicone rubber insulators," in IEEE Transactions on Dielectrics and Electrical Insulation, vol. 23, no. 1, pp. 304-310, February 2016.
[6] Y. Guo, X. Jiang, Y. Liu, Z. Meng and Z. Li, "AC flashover characteristics of insulators under haze–fog environment," in IET Generation, Transmission & Distribution, vol. 10, no. 14, pp. 3563-3569, 4 11 2016.
[7] Z. Deng, F. Cheng. The Research on Image Signal Denoising Method Based on Wavelet Threshold[J]. Journal of Jiamusi University (Natural Science Edition), 2018, 36(06): 906-909+945.
[8] J. Xu, J. Fan, Ch. Chen, J. Qu. Improvement of the global K-means algorithm based on density[j]. Journal of Yunnan Minzu University (Natural Sciences Edition), 2019, 28(02): 160-164.
[9] R. M. Esteves, T. Hacker and C. Rong, "Competitive K-Means, a New Accurate and Distributed K-Means Algorithm for Large Datasets," 2013 IEEE 5th International Conference on Cloud Computing Technology and Science, Bristol, 2013, pp. 17-24.