Intervention Program
by
Yasmina Marie Bouraoui-Karoui
A dissertation submitted in partial fulfillment of the requirements for the degree of
Doctor of Public Health Health Management and Policy
School of Public Health in the University of Michigan
2015
Doctoral Committee:
ii
This dissertation is dedicated to my children; first and foremost my daughter Karima Abdi Mohamed Kusow, who began and finished this journey with me, and was generous throughout the years in sharing her Mom with this and other life projects. I cannot thank her enough.
It is also dedicated to the other children that have been gifts in my life: (Abraham) Leek Mach Dhuol; (Philip) Madol Mach Dhuol; (David) Ayuiu Mach Dhuol; Ender Barahona Gonzalez; Warda Ibrahim; Zahrah Saleh; Janet Lopez Ruiz; and Diana Romero Sagastume. Each of them touched my heart and left me wiser. Finally, a special
iii
A project such as this cannot be undertaken without the support of the village. First and foremost, I would like to thank my chairperson, Dean Smith. Dean was an encouraging and supportive guide throughout the project, who shared his knowledge and humorous quips liberally, providing a positive environment during challenging times. I would also like to thank the other members of my dissertation committee, David
Hutton, Simone Singh, and Minal Patel, who each provided substantive and thoughtful comments during the process.
Many persons supported me during the coursework phase of my dissertation, when I was attending school, working full-time, and attending to a dependent child. This included my beautiful sister and mother (in-law), Fartumo Kusow and Timiro Mohamed; Randle Gelispie; Lori Post; Patti and Jim Oemhke; Lucinda Deason; and Denise
Cyzman.
My classmates in the PEW VIII cohort provided the camaraderie and support to get through the coursework and attack the dissertation phase. This included Dan Ball, Ron Dechert, Laura Shone, and Betsy Thompson. A special thanks to Mary Ann Kozak, Connie Currier, and Pamela Landsman Blumberg, who provided encouragement right to the end.
iv
wonderful staff and students at the Center for Statistical Consultation and Research (CSCAR) at the University of Michigan.
Several supervisors at the Michigan Department of Community Health supported me with a flexible work schedule at various times throughout the project; thank you to Sandy White, Kathy Miller, and Vendella Collins. My current colleagues at the Michigan Developmental Disabilities Council have carried a heavier load as I took many days off during the writing phase; many thanks to all of them; Vendella Collins, Tedra Jackson, Tracy Vincent, Wendy Duke-Littlejohn, Dee Florence, Meredith Smith, Terry Hunt, and Brett Williams.
A special thanks to the staff from the Healthy Homes Section at the Michigan
Department of Community Health, especially Courtney Wisinski, Tom Largo, and Erika Garcia, who were generous with their data, knowledge, and expertise.
One individual was with me through the trenches; special thanks for the friendship and support of my best friend, Jay Waller.
v
Dedication ...ii
Acknowledgements ... iii
Table of Figures ... x
Table of Tables ...xi
Abstract ... xvi
Chapter 1 Statement of the Problem ... 18
1.1. Significance of the Study ... 18
1.2. Gaps in knowledge ... 20
1.3. Research Questions ... 21
1.4. Background on Asthma ... 21
1.4.1. Definition and Essential Characteristics... 21
1.4.2. Course of development... 22
1.4.3. Prevalence and Incidence ... 23
1.4.4. Impact on health and health care ... 24
1.5. Applied Significance ... 27
vi
2.2. Concept of Healthy Homes ... 29
2.2.1. Background ... 29
2.2.2. Definition ... 30
2.2.3. Health Disparities in Access to Healthy Homes ... 31
2.2.4. Strengths and weaknesses of the approach ... 32
2.3. Cost Analysis and Cost-Benefit Research ... 32
2.3.1. Background ... 32
2.3.2. Definition ... 33
2.3.3. Important considerations ... 33
2.4. Cost-benefit research related to Asthma and Healthy Homes ... 34
2.5. Policy Implications ... 35
2.5.1. Background ... 35
2.5.2. Economic analyses and policy ... 36
2.5.3. Asthma policy ... 37
2.6. Employers/Managed Care/Health Insurers ... 38
2.6.1. Background ... 38
2.6.2. Insurance Reimbursement ... 39
2.6.3. Actions that can impact Health Coverage and Care Practices ... 40
vii
3.2. Hypothesis ... 46
Chapter 4 The Intervention ... 48
4.1. Introduction ... 48
4.2. Description of the HHU II Project Population ... 48
4.2.1. Baseline Demographic Characteristics of the HHU II Project Population .. 49
4.3. Project costs ... 51
4.3.1. Personnel ... 52
4.3.2. Travel... 52
4.3.3. Supplies and materials ... 53
4.3.4. Consultants ... 55
4.3.5. Other Costs ... 57
4.3.6. Total Costs ... 58
4.4. Cost Considerations ... 58
4.4.1. Comparing Basic and Custom Interventions ... 64
4.4.2. Basic and Custom Products and Services Costs for HHU II Project ... 64
4.4.3. Custom Intervention Products and Services ... 66
Chapter 5 Methodology and Research Design ... 68
5.1. Study Design ... 68
viii
the following criteria: ... 70
5.2.2. Control Group: ... 70
5.3. Participant Flow Diagram and Attrition table ... 71
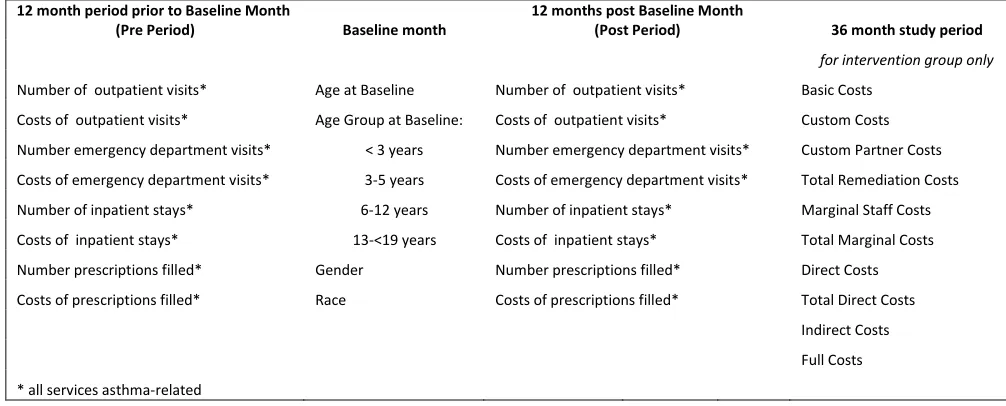
5.4. Methods for the calculation of each cost type ... 73
5.4.1. Variables of Interest ... 73
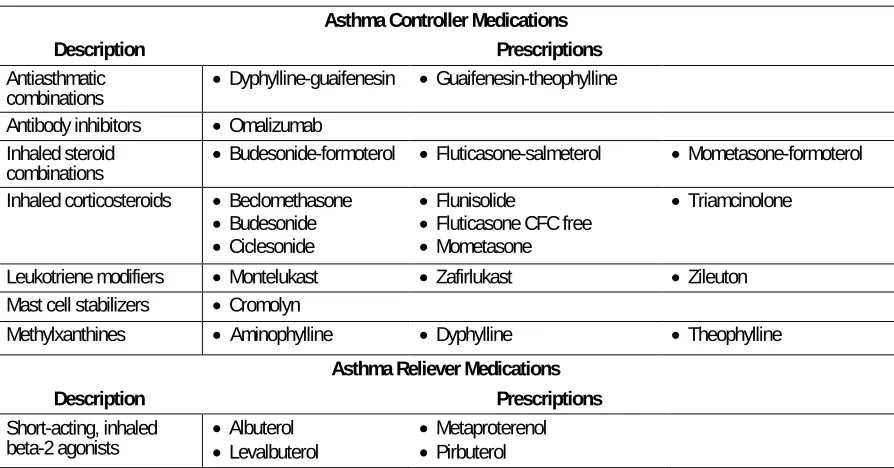
5.4.2. Identification of Asthma-related Services by Place of Service ... 74
5.5. Statistical Analysis Methods ... 79
5.5.1. Descriptive Statistics ... 80
5.5.2. General linear regression ... 82
5.5.3. Exclusion of outliers ... 82
5.5.4. General Linear Regression with the Exclusion of Outliers ... 82
5.5.5. Comparisons of Cost Calculations ... 83
5.5.6. Models including intervention costs ... 83
5.5.7. Protection of rights of human subjects ... 83
Chapter 6 Results... 85
6.1. Subject Characteristics ... 85
6.2. Utilization of Services ... 86
6.2.1. Pre period ... 86
ix
6.3. Costs of Services ... 93
6.3.1. Pre period ... 94
6.3.2. Post period ... 97
6.3.3. Difference in Costs Pre – Post ... 99
6.3.4. General linear regression ... 102
6.3.5. General linear regression with exclusion of outliers ... 119
6.3.6. Comparisons of Costs Calculations ... 125
Chapter 7 Discussion and Policy Implications ... 128
7.1. Discussion ... 128
7.1.1. Utilization ... 128
7.1.2. Medical Costs ... 131
7.1.3. Other cost considerations ... 132
7.1.4. Cost-benefit considerations ... 135
7.2. Limitations ... 137
7.3. Policy Implications ... 142
7.3.1. From an insurer perspective ... 142
7.3.2. From other perspectives ... 144
7.4. Suggestions for Future Research ... 145
x
Table of Figures
Figure 4.1: MARGINAL Costs ... 61
Figure 4.2: DIRECT Costs ... 62
Figure 4.3: FULL Costs ... 63
Figure 7.1*: Median Number of Days of Symptoms in Past Month ... 133
xi
Table 4.1: Demographics of HHU II Participants, by Medicaid Study participation ... 51
Table 4.2: Basic and custom intervention products and services ... 55
Table 4.3: Elements: Marginal, Direct, & Full Project Comparisons ... 59
Table 4.4: Costs of Basic, Custom, and Total (Basic and Custom) Intervention ... 65
Table 4.5: Costs of Basic Intervention Products and Services ... 65
Table 4.6: Costs of Custom Intervention Products and Services ... 65
Table 4.7: Costs of Basic and Custom Intervention Products and Services ... 66
Table 4.8: Costs of Basic and Custom Intervention Products and Services including Partner Remediation Costs ... 66
Table 4.9: Custom intervention products and services ... 67
Table 5.1: HHU II Program Recruitment and Participant Flow Diagram ... 72
Table 5.2: Study Variables Collected at Each Study Phase ... 73
Table 5.3: Chronic Obstructive Pulmonary Disease and Allied Conditions ... 74
Table 5.4: DRG Codes used to identify Asthma-Related Inpatient Stays ... 78
Table 5.5: Asthma Controller and Reliever Medications... 79
Table 6.1: Baseline Demographic Information for Healthy Home University II Cost-Benefit Study ... 86
xii
Outpatient Services during the PRE period between HHU II intervention and control groups ... 88 Table 6.4: Unadjusted Utilization of Asthma Controller and Rescue Prescriptions, during the POST period between HHU II intervention and control groups ... 89 Table 6.5: Unadjusted Utilization of Asthma-Related Prescriptions Medications,
xiii
participants and a control group ... 102 Table 6.14: Multivariate Results Change in Utilization of Asthma-related RX filled
xiv
xv
xvi
Objective: Environmental conditions can exacerbate asthmatic children’s symptoms. The benefit was examined for Healthy Homes University II, an in-home asthma public health program for low-income families which included an assessment for asthma triggers; products and services to reduce exposures; and asthma education.
Design: Case-Control Study; symptomatic asthmatic participants aged <18 in Lansing, Michigan. Program staff assessed homes for asthma triggers and subsequently
provided products and services to reduce exposures to cockroaches, dust mites, mold, tobacco smoke, and other triggers. Asthma education included identification of asthma triggers and instructions on specific behaviors to reduce exposures. Controls selected from two similar communities.
Intervention: 250 households received a baseline intervention home visit for health education and product installation, and 3 and 6 month post-intervention home visits. A subset of households received custom interventions.
Participants in study: Children < 18 years of age; income < 80% of Area Median
Income; continuously enrolled in Medicaid for a 25 month period and had either one ED visit or one hospitalization due to asthma during the first 12 months of that 25 month period; 40 cases met the inclusion criteria.
Outcome measures: Asthma-related: controller and reliever prescriptions filled,
controller and reliever prescription costs, outpatient visits, outpatient costs, emergency department visits, emergency department costs, inpatient stays, inpatient stay costs, overall costs, and intervention costs.
xvii
18
Chapter 1
Statement of the Problem
1.1. Significance of the Study
Childhood Asthma is a major public health issue that is costing billions to treat every year. An estimated $19.7 billion was spent on asthma in direct and indirect costs in 2007 in the United States. Almost 24% ($4.7 billion) of this amount was spent on preventable hospital visits [1].
Allergic diseases, including asthma, are the most frequently reported chronic diseases in children, affecting more than 6.2 million children under the age of 18 annually in the United States [1]. Moreover, asthma prevalence, hospitalizations, and deaths have increased steadily among children over the past three decades [2]. The current asthma prevalence rate was 47% higher in blacks than in whites in 2011. Moreover, the highest prevalence rates for whites and blacks were in the 5-17 age group in 2011 [3]. Asthma is also disproportionately associated with poverty, with poor children having a
prevalence 1.4 times greater than non-poor children; positive health outcomes and savings can be expected to disproportionately accrue to children at the highest risk of severe asthma [4].
19
higher compared to those without asthma [6]. Black children have higher rates of hospitalization and emergency department (ED) visits than whites, creating a disproportionate economic burden of asthma for these populations [7, 8].
National best practice guidelines for managing asthma, National Asthma Education Prevention Program (NAEPP) guidelines[9] outline four best practices of effective asthma management. These include:
i. Use of objective measures of lung function to assess disease severity and control;
ii. Comprehensive pharmacologic therapy to reverse and prevent airway inflammation and constriction, and to manage exacerbations;
iii. Patient education and
iv. Environmental control measures to avoid or eliminate factors that contribute to asthma onset and severity.
Historically, treatment of asthma has focused on the clinical setting through monitoring of lung function and medication use (best practices 1 and 2). Given the poor control of asthma in population based surveys [10], research is focusing on the implementation of cost-effective education and environmental trigger reduction programs and services (best practices 3 and 4).
20
can be demonstrated, the expected contribution is lower health care costs and improved health outcomes for children with asthma in Michigan.
Few patients have access to best practices 3 and 4, patient education and control of environmental triggers. It is known that environmental conditions within the home can exacerbate asthmatic children’s symptoms. As a result, in-home environmental public health intervention programs that address multiple environmental triggers combined with face-to-face education over multiple home visits have become current program practice. However, many of these initiatives have been grant funded and time-limited, and financial sustainability for such programs remains a challenge.
Little is known about the full costs and benefits of Health Homes Intervention programs to control chronic diseases such as asthma in Michigan.
1.2. Gaps in knowledge
A CDC Task Force has reviewed 13 studies that evaluated costs and the effectiveness of home-based, multi-trigger and multi-component environmental interventions. The Task Force Review and selected studies will be discussed in detail in Chapter 2. Briefly, the Task Force found that gaps in knowledge remain about how particular components impact the overall effectiveness of a multi-faceted intervention [11].
21
asthma-related health care utilization. Additionally, the evaluation will compare the intervention group to a control group.
1.3. Research Questions
The purpose of the project is to determine if a return on investment (ROI) can be
demonstrated upon analysis of the second round of a program implemented in Lansing, Michigan to study the relationship between the Healthy Homes University (HHU)
interventions and utilization of emergency department, hospitalization, urgent care, physician/clinic utilization, and use of controller and rescue medications due to acute asthma events. The project will consider the health benefits and cost-effectiveness of asthma programs that supplement quality clinical care with asthma education and environmental interventions in the home.
1.4. Background on Asthma
1.4.1. Definition and Essential Characteristics
According to the World Health Organization, asthma is characterized by recurrent attacks of breathlessness and wheezing, which vary in severity and frequency from person to person, due to inflammation of the air passages in the lungs, so that the nerve endings become easily irritated [12]. In an attack, the lining of the passages swell
22
1.4.2. Course of development
Exposure to allergens and irritants can trigger or exacerbate episodes of asthma, especially in the home [13]. Common asthma triggers in the home environment include dust mites, pets, cockroaches, mice and rats, mold, environmental tobacco smoke, and indoor pollutants. Strategies have been developed to target each trigger respectively [13].
Dust mites are a long established trigger for dust mite sensitive patients, increasing asthma symptoms, pulmonary function, and need for medication. This trigger can be removed through the use of allergen-impermeable pillow and mattress covers, using bedding cleaned in hot water >130 F, removal and disposal of old carpet, reduction in home humidity to <60%, and the washing of stuffed animals weekly [13, 14].
Pet allergens, in particular dog and cat, are a second important trigger; removal of pets from the home is the most effective method to reduce this allergen.
Cockroaches are particularly common in the urban environment, and be hard to
eliminate. Allergens can be reduced by using “integrated pest management” strategies to include removing food and water sources, maintaining clean surfaces and floors, sealing trash containers, carefully storing foods, using gel baits for extermination, and sealing all cracks and small holes in the residence.
23
Mold and exposure to dampness accounts for 21% of the asthma in the U.S. [15]. Remediation involves removing mold from hard, non-porous surfaces; discarding mold-contaminated materials (carpet, ceiling tiles); and addressing the sources responsible for mold growth.
Environmental tobacco smoke is linked to increased risk of developing asthma, increased severity, and increased frequency of exacerbations in children with asthma [13]. Interventions are targeted to smokers with asthma, or smokers who are parents of children with asthma, through smoking cessation programs and air filtration methods to reduce the indoor concentration of environmental tobacco smoke [16].
Indoor pollutants include nitrogen dioxide, particulate matter from biomass combustion products, and bacterial endotoxins [17-19]. They are often a trigger for asthma
exacerbations, most often through the use of gas stoves, wood-burning appliances or fireplaces [13, 20].
1.4.3. Prevalence and Incidence
1.4.3.1. Major risk factors
24
treated(e.g. rhinitis, gastro esophageal reflux), and stress can also trigger or exacerbate existing asthma [21]. The particular triggers that will exacerbate asthma vary by the individual. If not treated appropriately, asthma can cause long-term loss of lung function and severe outcomes, such as hospitalizations and even death.
1.4.4. Impact on health and health care
1.4.4.1. Mortality, disability, morbidity, and quality of life
Michigan has conducted the Asthma Call‐back Survey since 2005, which collects
detailed information about asthma symptoms, management, and trigger exposures. It is the only source of Michigan specific asthma information [22]. The data reflected here are Michigan specific and represent response years 2008-2010.
Asthma Symptoms – Children: According to this survey, 16.8% of children with current asthma had asthma symptoms on 9 or more days during the past month.
Difficulty Sleeping Due to Asthma Symptoms – Children: 20.4% of children with current asthma had difficulty sleeping due to asthma symptoms on 2 or more days during the past month. The prevalence was 52.2% higher among children ages 0‐9 than children ages 10‐17.
Asthma symptom-free days – Children: 57.9% of children with current asthma
experienced 14 asthma symptom‐free days during the past 2 weeks.11.2% of children with current asthma had asthma symptoms every day of the last 2 weeks.
25
were no significant differences within age, sex, and race groups; nor within household income or respondent education groups.
Number of school days missed due to asthma - Children: 16.5% of children with current asthma missed 6 or more school days due to asthma in the past 12 months due to asthma. 54.5% of children with current asthma missed no school days due to asthma in the past 12 months due to asthma.
Asthma Emergency Department/ Urgent Care Visits – Children: 9.2% of children with current asthma visited the emergency department or urgent care center for asthma 2 or more times during the past 12 months.
Asthma Hospitalizations – Children: 4.2% of children with current asthma had at least 1 hospitalization for asthma the past 12 months. There were no significant differences within age, sex, or race groups; nor within household income or respondent education groups.
Asthma Action Plans – Children: 45.7% of children with current asthma had received an asthma action plan at some point in their life.
1.4.4.2. Cost, quality, and access
The Asthma Call-back Survey also provides information regarding access to care, quality of care, and some cost barriers to care. The following data [21] are Michigan specific and represent response years 2008-2010:
26
Asthma Management Class – Children: 12.7% of children with current asthma or an adult in their household have taken an asthma management class at some point in their life.
Advised to Modify Environment to Improve Asthma – Children: 44.6% of respondents for children with current asthma or an adult in their household have been advised by a health professional to modify the child’s environment to improve their asthma at some point in their life. The prevalence of having been advised to modify their environment to improve asthma for children with current asthma within household was significantly higher among respondents who attended some college or graduated from college than respondents with less formal education.
Long Term Control Medication Use – Children: 49.1% of children with current asthma had used a long term control medication during the past 3 months. The prevalence of using a long term control medication was significantly higher among respondents who attended some college or graduated from college than respondents who did not attend at least some college.
Routine Asthma care Visits – Children: 45.4% of children with current asthma had 2 or more routine asthma care visits during the past 12 months.
27
Cost Barriers To Care for Children: 10.7% of respondents for children with current asthma reported experiencing a cost barrier to their asthma care during the past 12 months. The most frequent type of cost barrier was related to medication; during the past 12 months, 8.5% respondents for children with current asthma reported needing asthma medication for the child but could not buy it because of cost.
1.5. Applied Significance
If cost-effectiveness of the implementation of NAEPP best practices 3 and 4 can be demonstrated, a business case of investing in asthma education and in-home
environmental interventions could be made to health care payers. Gaps in insurance reimbursement and policy implications for payer organizations will be explored. If health insurers routinely reimbursed for these services and supplies, they could become
28
Chapter 2
Review of Literature
2.1. Major analytical approaches
An analysis of the cost-benefit of a Healthy Homes intervention, while straightforward in and of itself is impacted by various factors which affect the eventual adoption of policy changes which would shift expenditures from payers of asthma care from a treatment model to a preventative (healthy homes) approach. The reduction of childhood asthma morbidity and utilization of health care services is complex, and is impacted by selected factors in underlying analytical models. The review of the selected literature is
organized according to the concept of healthy homes, cost analysis and cost-benefit research, policy issues, and insurance/managed care.
Over sixty-two articles were identified which were relevant to various aspects of this study. These included articles addressing childhood asthma and healthy homes interventions in particular; defining asthma cases; the unsustainability of high asthma costs; federal support for healthy homes initiatives; prior studies that have evaluated costs and the effectiveness of home-based, multi-trigger and multi-component
29
research for U.S public health policy was reviewed, as well as various methods for cost-effectiveness analysis. Articles were also reviewed which focused on the health
economics of asthma, and funding models which could potentially pay for healthy homes interventions upstream, especially as it relates to health plans.
2.2. Concept of Healthy Homes
2.2.1. Background
Florence Nightingale, the founder of modern nursing, stated “The connection between the health and the dwelling of the population is one of the most important that exists” [23]. A key characteristic of asthma is the role of environmental exposures in the initiation of the disease and its development. Therefore, the reduction in environmental triggers can determine the difference between its effective management and it being out of control [24]. Although the environmental factors present with asthma are found in all types of homes, sub-standard home environments, disproportionately occupied by low-income and minority populations, allow it to flourish.
The NAEPP guidelines for the diagnosis and management of asthma [14] recognize the importance of reducing exposure to indoor environmental asthma triggers. Furthermore, the reduction of indoor exposures has been shown to improve clinical outcomes [25, 26]. In 2009, a federal Healthy Homes Work Group (HHWG), comprised of
30
2.2.2. Definition
In 2009 the Surgeon General established a call to action to promote healthy homes; homes which are sited, designed, built, maintained, and renovated in ways that support the health of its residents [23]. The term homes can be single-family homes, apartments, townhomes, duplexes, condominiums, or manufactured homes, and also includes the land immediately around the home and any other structures on the property. The call focused on the impact of housing on public health and urged a coordinated effort to improve housing factors that affect health [27].
Five broad categories are recognized as contributing to adverse health effects in a home [28]: 1) Physical conditions, such as heat, cold, energy efficiency, radon
exposure, noise, inadequate light, ventilation, and fine particulates in the home. 2) Chemical conditions such as carbon monoxide, volatile organic chemicals, secondhand smoke, and lead. 3) Biological conditions such as rodents, house dust mites,
cockroaches and their associated allergens, and humidity and mold. 4) Building and equipment conditions, such as accidents and unintentional injuries and access to sewer services. 5) Social conditions, such as architectural features related to mental health.
Healthy Homes interventions generally consist of two parts: an environmental assessment, which uses an assessment survey tool to identify potential indoor contaminants; and environmental trigger education and mitigation, which includes education on trigger education, and the implementation of mitigation techniques [29].
31
Major, which includes major structural improvements to the home, such as carpet removal, replacement of ventilation systems, or extensive repairs to restore structural integrity (e.g.to roof, walls, floors).
Moderate, which includes the provision of multiple low cost materials with the active involvement of a trained home visitor: providing a fitting mattress and pillows with allergen-impermeable covers, installation of small air filters and dehumidifiers,
integrated pest management, professional cleaning services or equipment, and minor repairs of structural integrity.
Minor, which includes the provision of advice on recommended environmental changes and may include the provision of low-cost items such as mattress and pillow allergen-impermeable covers.
2.2.3. Health Disparities in Access to Healthy Homes
The American Housing Survey (AHS) provides prevalence information on the US housing quality, at the national and city levels. Significant disparities by race and
income over time exist with regards to residence in substandard housing. In 2005, AHS data reported that 7.5% of non-Hispanic Blacks, and 2.8% of non-Hispanic Whites, resided in moderately substandard housing [30]. A study from Seattle/King County reported that among children with persistent asthma in households with incomes less than 200% of the poverty line, damp conditions were evident in 65% of the homes, and mold was visible in 38% of the homes [31]. The experience with childhood lead
32
micrograms per deciliter fell from 97% to 3.1% among African American children, by focusing resources on the subpopulations at greatest risk.
2.2.4. Strengths and weaknesses of the approach
The EPA notes that health plans pay a substantial portion of the costs spent annually to treat asthma, and is encouraging insurers to incorporate environmental remediation management into their disease management programs [29]. Of the four best practice components in the NAEPP guidelines, access to best practices 3 and 4, asthma
education and environmental interventions, remain scarce, despite increasing evidence that these practices improve symptoms [11, 24].
2.3. Cost Analysis and Cost-Benefit Research
2.3.1. Background
Cost-benefit analysis (CBA) has been put forth as the gold standard of economic
evaluation methods [32]. This analysis converts health outcomes into dollar equivalents and compares the costs and consequences (positive and negative) of various
intervention strategies in monetary terms [33], by subtracting costs from the value of benefits to estimate the net benefit of an intervention [34]. This method has been widely used in regulatory analyses of environmental health and safety programs, especially by OMB for major regulations expected to have economic impacts greater than U.S. $100 million[34]. It is important to note that the least resource-interventions may be the most cost-effective, but not the most effective [35]. Also, determining which type of intervention is most effective for which type of patient is important. For
33
triggers, or those with low literacy levels, interventions to reduce environments exposures can be beneficial [24].
2.3.2. Definition
The summary measure of a CBA can be expressed as a net benefit (costs minus benefits), or as a ratio of costs to benefits [33].
2.3.3. Important considerations
A very important consideration in any cost-benefit analysis is perspective. The
perspective taken by any CBA analysis will determine the final ratio of cost effect. The costs associated with adverse health as well as the costs and benefits of any
intervention addressing a health issue are not distributed equally among various groups in society [33]. For example, the perspective of a federal payer (Medicaid for example) may be very different than that of a state payer, a managed care organization, an employer, or a beneficiary. Finally, the overall societal perspective is again different, and impacts public policy decisions, as prevention strategies that are cost-effective to society may not have a positive short-term financial return for payers [34]. The panel on Cost-effectiveness in Health and Medicine recommends the societal perspective, which is often used in public health [36]. In this approach, all significant costs and health effects associated with everyone affected by the intervention are included in the
34
The pharmaceutical industry and managed care organizations have their own
perspectives as well, all of which may differ from what might be most cost-effective for society at large.
This analysis will be from the perspective of an insurer/payer. Of interest are the costs they will incur in producing or arranging for medical care for their subscribers and beneficiaries [36]. As such, the cost categories of interest are the cost of the healthy homes intervention, and the changes in medical benefits, such as the direct medical costs (office visits, hospitalizations, emergency department visit, diagnostic tests, medical supplies, prescription drugs) [33]. Other considerations which will be
addressed are the study time frame and the analytic horizon. It is important to note that not relevant to the payer is how rapidly a beneficiary can return to work, as they are not responsible for the disability payments.
2.4. Cost-benefit research related to Asthma and Healthy Homes
There have been a limited number of studies that have compared the economic burden of housing-related adverse health outcomes with the resources required to implement relevant interventions [33]. Asthma related direct and indirect costs attributable to residential exposure in children and adolescents 16 years or younger is estimated at more than $1.1 billion annually [37]. Up to 20% of all asthma cases may be attributable to dampness and mold, at an annual cost of $4.0 billion [15].
35
medical costs averted, or benefit-cost-ratios. Six studies with minor to moderate remediation demonstrated that these interventions provide good value for money invested based on substantial returns for money invested and a cost per symptom free day that is below the standard cut-off for what is considered cost-effective in the
literature. Cost-effectiveness studies show a cost of $12 to $57 per additional symptom free day [3 randomized control trials; Krieger (2005), Kattan (2005), and Sullivan
(2002)]. The majority of studies in the economic review were interventions for children with asthma, and studies that included adults also included children.
Cost-benefit studies show a return of $5.3 to $14.0 for each dollar invested [3 studies; Oatman (2007), Jowers (2000), and Shelledy (2005)]. These studies all had a pre-post study design, used a 12 month follow-up period, and two of them provided information on direct medical costs averted. The third, Jowers, included productivity costs averted. Regression to the mean may have played a role in these studies, because participants had moderate to severe asthma at the beginning of the study. The previously
mentioned randomized controlled trials were more likely to have benefits which were more certainly due to the intervention. Those studies could not show a positive cost-benefit ratio.
2.5. Policy Implications
2.5.1. Background
36
the population [39]. The Institute of Medicine (IOM) convened a panel of experts to examine the legal and regulatory authority for public health activities, to describe the implications for the changing social and policy context for public health laws and regulations. They identified some of the legal and policy interventions available to improve the public’s health. These included the power to regulate; the power to tax and spend; and the power to modify the built environment. They also encouraged the
government and private sector to consider health in all places (HIAP) approaches, which can act on the social and environmental factors that influence health but are out of the control of the health sector [39].
2.5.2. Economic analyses and policy
Economic analyses can be used to make informed decisions about how to allocate limited resources in a manner that optimizes value for money [40]. Current decision rules have been inadequate to guide choices that would yield the most benefit for the population [40]. There are numerous health related interventions available, with significant development of health care and pharmaceutical technologies used to treat disease, with concurrent rapid growth in costs. Professional and economic incentives continue to expand those services, with the share of the U.S. gross domestic product devoted to health care growing from 5 to 15% between 1965 and 1995 [36]; and currently at 17.9% [12]. Ninety-nine percent of those health care expenditures target individual medical care, leaving few resources to target public health and prevention programs that could benefit the entire population [36]. Attention has focused on acute concerns rather than on the most efficient methods of promoting health through
37
favored over high-touch strategies such as home visiting and home remediation, which cannot be patented and do not capture the interest of the pro-profit health care industry [41]. Certain services are more profitable than others and the relationship between profitability of treatments and their outcomes is a topic avoided by administrators [42].
Asthma is no exception. The annual cost for a year’s supply of inhaled fluticasone propionate (220ug) is approximately $2200 per year, compared to costs ranging from $200 to $1500 for home visiting programs [41]. Yet home visit programs are limited, largely because health care payers do not reimburse for them.
2.5.3. Asthma policy
Clinical practice guidelines describing quality health care for asthma have been in existence for two decades. The National Asthma Education and Prevention Program (NAEPP) Guidelines for the Diagnosis and Management of Asthma provide an
evidence-based treatment regime [14]. They describe four components of good asthma management including 1) objective assessment and monitoring, 2) pharmacologic therapy, 3) patient education, and 4) environmental control. There exists a gap
38
The NHLBI Guidelines Implementation Panel Report [44] recommends the development of protocols and coverage for in-home environmental trigger reduction supplies and services for children and adolescent as appropriate and needed. Children and youth whose asthma is not under control should have comprehensive coverage which covers environmental trigger education, environmental interventions such as mattress/pillow covers, HEPA air filters, HEPA vacuums, and integrated pest management. In some cases, remediation may be appropriate as well [11, 24].
2.6. Employers/Managed Care/Health Insurers
2.6.1. Background
39
that premiums should not be increased to cover asthma management, as the service will be cost-effective and may generate cost-savings [24].
Many employers are actually self-insured, and would actually receive the benefits themselves. Further, even when employers are purchasing insurance, a competitive insurance market would yield lower premiums in the long-run when cost-beneficial programs are adopted.
2.6.2. Insurance Reimbursement
There are a number of policy issues related to the implementation of the NAEPP guidelines. From an insurance perspective, major issues remain with insufficient and inconsistent insurance benefits, the high costs of prescription medications, the lack of reimbursement for educational services and case management, and an unwillingness to consider the reduction in environmental exposures. These concerns contrast a CDC review which found that the combination of minor to moderate environmental
remediation with an educational component provides good value for the money invested based on improvement in symptom free days, savings from medical costs averted, and improvement in productivity [11].
Some disease management programs are offering some of the asthma best practice components, but very few offer home visits for environmental assessments and
40
The fact that managed care organizations have not been keen on providing primarily behavioral interventions for disease prevention and health promotion services is a longstanding issue [35]. For asthma home visiting and remediation services, initial intervention costs are upfront, and in the case of reduced expenditures for asthma, the benefits and cost-savings may accrue over months or years. Given the expected benefits of reduced urgent care use, reduced absenteeism, and presenteeism, health insurance premiums should not increase as a result of investing in managing asthma [24].
2.6.3. Actions that can impact Health Coverage and Care Practices
Industry Report Cards can play a significant role on health plans emphasis on providing a particular service. The Health Plan Employer Data and Information Set (HEDIS) “is a tool used by more than 90 percent of America's health plans to measure performance on important dimensions of care and service. Altogether, HEDIS consists of 75
measures across 8 domains of care. Because so many plans collect HEDIS data, and because the measures are so specifically defined, HEDIS makes it possible to compare the performance of health plans on an "apples-to-apples" basis [4, 46]. Payers routinely provide incentives to insurers who meet certain benchmarks, known as “Pay for
41
HEDIS 2013 included the following selected measures on asthma management: enrollees had to have experienced continuous enrollment (for the measurement year and year prior), and the measures were provided for all enrollees ages 5-64, and by age brackets, including children aged 5-11 and 12-18.
Use of Appropriate Medications for People With Asthma (ASM) The percentage of members 5–64 years of age during the measurement year who were identified as having persistent asthma and who were appropriately prescribed medication during the measurement year.
Medication Management for People With Asthma (MMA) Two rates, (1) the percentage of members who remained on an asthma controller medication for at least 50% of their treatment period; (2) the percentage of members who
remained on an asthma controller medication for at least 75% of their treatment period.
42
Consolidation of health care may have a positive impact on the provision of preventative services. A health care plan that dominates a particular marketplace, or which owns multiple plans in a particular catchment area, will have an incentive to provide
preventative services, as they are more likely to hold on to their enrollees for significant periods of time [35].
Provision or non-provision of services also impacts enrollment in health plans. If there is demand for a particular service, and the health plan does not cover it, they may lose members to a plan that does. Therefore it may be worth the expense to provide the service, regardless of the cost-effectiveness of the intervention [35].
Enrollee and provider demand for services is another determinant in health coverage. Beneficiaries and providers alike demand high cost crisis management interventions that are not necessarily cost-effective. However, there is not the same clamor for preventative measures with benefits in the long-term.
Government mandates are a final determinant of coverage. Governing entities, such as State insurance commissioners, have the authority to require coverage of interventions. This would address the problem of an organization bearing the cost of coverage, whilst another organization accrued the benefits.
2.6.3.1. New Strategies to pay for Preventative Services
The historical fee for service health care model embodied by the U.S. healthcare
system lacks incentives for providers and insurers to invest in prevention [49]. A chorus of providers, practitioners, and community health planners are investigation new
43
starting at the local level. The following outlines some of the predominant ideas which are being proposed and tested.
Health Impact Bonds propose raising capital from private investors to target community prevention initiatives through evidence –based clinical and community care, and
leveraging future health care cost savings to pay for prevention today. Savings from such initiatives are returned to investors, and are re-invested, creating an ongoing system of better health and lower costs. Such a bond is being implemented in Fresno, California, by the University of California, Berkeley, and a health impact investing firm, Collective Health, targeting the incidence and severity of asthma by investing in home-based remediation of environmental conditions in homes of 200 local children with moderate to severe asthma [49, 50]. The California Endowment, a private health
foundation, is investing $1.1 million in the project [50], and the intervention is estimated to generate a net savings of $4.5 million, and a return of investment of $1.69 for every dollar spent [49]. If successful, investors will be repaid by the insurers through a portion of the savings realized by lowered emergency department visits, hospitalizations, and post intervention treatment costs.
Wellness Trusts are funding pools typically funded by taxing a levy on insurers and hospitals, in order to support the health and wellness interventions to improve targeted populations. Many of the funded initiatives from such trusts carry out prevention
initiatives which are community-based, and which address preventable health
44
may ‘lose’, as they may as likely ‘gain’ a member who will have benefited from the investment [49].
Community Benefits requirements were enacted under legislation passed in 1994 which required hospitals, as a condition of their tax-exempt status, to provide “community benefits in the public interest” [49]. About 2,900 or 60% of hospitals nationwide are non-profit, and the tax-exemption was valued at $12.6 billion dollars annually [51]. New requirements under the Affordable Care Act (ACA) require tax-exempt hospitals to do community health needs assessments and improvement plans every three years, and adopt implementation plans which address the community’s health needs [49, 51]. Effective in 2012, community building activities, which focus on upstream
environmental, social, and economic factors, are eligible to be counted as community benefit expenditures, providing a new resource to fund prevention activities [52]. The IRS has also asked hospitals to track such expenditures, defined as support for “physical improvement and housing, economic development, community support, environmental improvements, leadership development for community members, coalition building, and community health improvement advocacy, and workforce development” [49, 52]. These activities are understood to benefit the population’s health without the provision of medical care.
A recent literature review of cost-effective analyses indicates that environmental
45
Chapter 3
Conceptual Model and Study Hypothesis
3.1. Conceptual Model
The purpose of the project is to conduct a return on investment (ROI) or cost-benefit analysis of the second round of a program implemented in Lansing, Michigan to study the relationship between the Healthy Homes University II (HHU II) Program
interventions and utilization of emergency department, hospitalization, urgent care, physician/clinic utilization, and prescription use due to acute asthma events. The project will consider the health benefits and cost-effectiveness of asthma programs that supplement quality clinical care with asthma education and environmental interventions in the home.
Best practices have been identified by NHBLI [9]. If cost-effectiveness of the
46
The Program will be evaluated using a quasi-experimental study in which changes in Medicaid claims for asthma among the intervention group are compared to changes among a control group.
3.2. Hypothesis
The hypothesis is that children with moderate to severe asthma who receive asthma education and environmental interventions in the home will have lower total medical costs related to lowered utilization of outpatient, emergency department, hospitalization, and use of rescue medications due to acute asthma events than children in a matched control group which do not receive any interventions.
Exploratory research questions that will be considered include:
1. Are asthma education and environmental interventions in the home associated with lower utilization of asthma-related outpatient services?
2. Are asthma education and environmental interventions in the home associated with lower costs of asthma-related outpatient services?
3. Are asthma education and environmental interventions in the home associated with lower utilization of asthma-related Emergency Department (ED) services? 4. Are asthma education and environmental interventions in the home is associated
with lower costs of asthma-related Emergency Department (ED) services? 5. Are asthma education and environmental interventions in the home associated
with lower utilization of asthma-related hospitalizations?
47
7. Are asthma education and environmental interventions in the home associated with lower utilization of asthma-related rescue medications?
8. Are asthma education and environmental interventions in the home associated with lower costs of asthma-related rescue medications?
48
Chapter 4
The Intervention
4.1. Introduction
The Healthy Homes II project was implemented from December 15, 2008 through June 14, 2012, and was an $875,000 award from HUD to the Michigan Department of
Community Health, Health Homes Section. In addition $144,792 in product carry-over from previous awards, and money collected by the Healthy Homes Section from fines and fees collected were spent on the project. Program match funding of $170,916 were comprised of Health Michigan funds ($36,439), Lead-Safe Housing Program funds ($88,246) and other MDCH program contributions ($44,231). An additional $122,412 was leveraged funds provided by local partnering organizations and product suppliers. Therefore, an estimated $1,313,120 was spent on the project.
4.2. Description of the HHU II Project Population
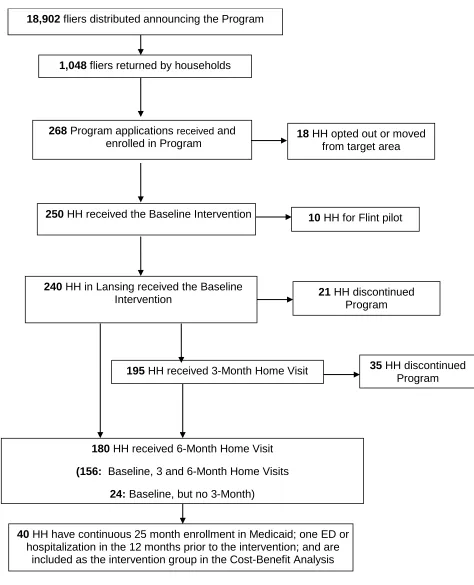
Two hundred and fifty participants were recruited to participate in the study, 240 of them from Greater Lansing, MI, and ten from Flint, MI. For the purposes of the evaluation, only the Greater Lansing participants were included in the evaluation. All 240
49
collection and analysis for 50 of the participant homes, Basic and Custom asthma trigger reduction and injury product installation to address identified health and safety risks in the home, and follow up calls and/or visits. The HHU Program Recruitment and Program Flow Diagram (attrition chart) is in Chapter 5, Table 5.1.
4.2.1. Baseline Demographic Characteristics of the HHU II Project
Population
Two hundred and forty participants participated in the project. Applications were prioritized based upon a score matrix. This matrix consisted of 14 child specific
questions and 11 housing related questions. Points were awarded based on how each question was answered. High scores were matched with units that housed children under six years old, had an asthma diagnosis and/or symptomology, based on the location and condition of the home, and the presence of multiple children living in the unit. Those applications which scored the highest were placed at a higher priority for completion.
50
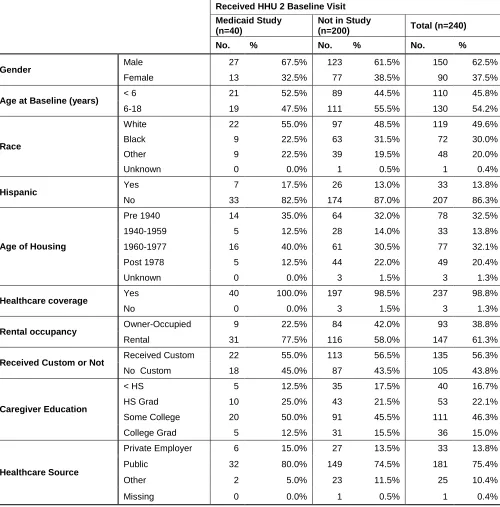
The majority of the participants were male (62.5%), and the remainder female (37.5%). Just under half of the participants were under the age of six (45.8%), and 54.2% were between the ages of six and eighteen (54.2%). The majority of participants were white (49.6%), followed by black (30%) and other races (20%). Hispanics represented 13.8% of the study population.
The majority of the caregivers reported having some college, 46.3%, followed by high school graduates, 22.1%, those with less than high school, 16.7%, and college
graduates at 15%.
Virtually all of the participants reported having health coverage (98.8%). Of those, almost 14% were covered by a private insurer, and the vast majority, 75.4%, was covered by public insurance, or Medicaid. Ten percent reported other health insurance coverage.
Almost thirty three percent of the individuals lived in pre-1940 housing, with a similar amount in 1960-1977 housing, twenty percent in post 1978 housing, and almost 14% in 1940-1959 housing. The majority of participants lived in rental housing, 61.3%, and almost 38.8% lived in owner occupied housing.
51
Table 4.1: Demographics of HHU II Participants, by Medicaid Study participation
Received HHU 2 Baseline Visit Medicaid Study
(n=40)
Not in Study
(n=200) Total (n=240)
No. % No. % No. %
Gender Male 27 67.5% 123 61.5% 150 62.5%
Female 13 32.5% 77 38.5% 90 37.5%
Age at Baseline (years) < 6 21 52.5% 89 44.5% 110 45.8%
6-18 19 47.5% 111 55.5% 130 54.2%
Race
White 22 55.0% 97 48.5% 119 49.6%
Black 9 22.5% 63 31.5% 72 30.0%
Other 9 22.5% 39 19.5% 48 20.0%
Unknown 0 0.0% 1 0.5% 1 0.4%
Hispanic Yes 7 17.5% 26 13.0% 33 13.8%
No 33 82.5% 174 87.0% 207 86.3%
Age of Housing
Pre 1940 14 35.0% 64 32.0% 78 32.5%
1940-1959 5 12.5% 28 14.0% 33 13.8%
1960-1977 16 40.0% 61 30.5% 77 32.1%
Post 1978 5 12.5% 44 22.0% 49 20.4%
Unknown 0 0.0% 3 1.5% 3 1.3%
Healthcare coverage Yes 40 100.0% 197 98.5% 237 98.8%
No 0 0.0% 3 1.5% 3 1.3%
Rental occupancy Owner-Occupied 9 22.5% 84 42.0% 93 38.8%
Rental 31 77.5% 116 58.0% 147 61.3%
Received Custom or Not Received Custom 22 55.0% 113 56.5% 135 56.3%
No Custom 18 45.0% 87 43.5% 105 43.8%
Caregiver Education
< HS 5 12.5% 35 17.5% 40 16.7%
HS Grad 10 25.0% 43 21.5% 53 22.1%
Some College 20 50.0% 91 45.5% 111 46.3%
College Grad 5 12.5% 31 15.5% 36 15.0%
Healthcare Source
Private Employer 6 15.0% 27 13.5% 33 13.8%
Public 32 80.0% 149 74.5% 181 75.4%
Other 2 5.0% 23 11.5% 25 10.4%
Missing 0 0.0% 1 0.5% 1 0.4%
4.3. Project costs
52
with reduced components, which will be deemed “MARGINAL”, “DIRECT”, and “FULL” for evaluation purposes, many of which would not be necessary in the private sector. These components are described in detail in section 4.3.
4.3.1. Personnel
Personnel costs were the largest expense. Over the course of the project, $269,908 was spent on the HHU II Program Manager (included in the DIRECT and FULL costs, and $252,925 on the Family Services Coordinator (Included in the MARGINAL,
DIRECT, and FULL cost calculations.
An additional $61,131 was spent on an epidemiologist, who performed statistical analysis of project survey tools that were used to document health outcome measurements. The epidemiologist also performed quality control and quality
assurance of survey tools and data management. Additionally, $14,196 was expended for a health analyst to analyze participating family Medicaid records in order for HHU to build surveillance systems of the asthmatic populations to track changes in incidence rates, monitor adherence to treatment protocols, and generate cost justification
analyses. These latter costs would not be necessary for implementation in the private sector and will be excluded in the “MARGINAL” and “DIRECT” cost calculations.
4.3.2. Travel
Travel expenses included the conference travel for project staff to Washington, D.C. (15 trips), at a cost of $18,919. This travel included HUD Grantee Orientation and other HUD-sponsored conferences that benefit staff professional development and
53
on the mileage and parking costs to house the project vehicle. Only these costs would be necessary for implementation in the private sector and will be included in the “MARGINAL” analysis.
4.3.3. Supplies and materials
This item includes consumable supplies (general office supplies, partnership meeting supplies, phone charges , healthy homes course manuals, allergy testing supplies), which totaled $19,719 of the supply budget. This budget category included phone service for arranging appointments with participating families and to conduct follow-up calls with families between home visits. The project provided an in-depth manual (275 manuals at $20/each) to participating families with resource materials that could be consulted for all aspects of the HHU Program’s Healthy Homes approach.
Additionally, Allergen testing was performed on fifty (50) units, which was 20% of the 250 total units. This included sampling and analysis by Johns Hopkins School of Medicine Reference Laboratory for dust mites (Dermatophagoides farinae),
cockroaches (Bla g I and II), and mouse urinary protein (as needed). The total cost of allergen sampling was $8,459. Samples were collected in food preparation and eating areas and key indicator child living and sleeping areas. Each home received sampling at baseline, 6 month and 12 month intervals.
The costs of the general office supplies and allergen testing were not counted in the calculation of MARGINAL and DIRECT costs.
54
These included the basic and custom costs for the 240 homes in the HHUII Lansing location, and the 10 homes in the HHUII Flint location. They were included in the MARGINAL, DIRECT, and FULL cost calculations.
The Basic Intervention services (average cost $449/unit) consisted of installing the following products, based on the identified needs of the individual home and family: 9-volt batteries ($1.28), D batteries ($0.69), bath mat ($11.68), cabinet safety locks ($2.19), cabinet slide locks ($2.52), carbon filter for air purifier ($19.00), CO detector ($15.50), caulk ($1.80), door mat ($6.30), fan ($9.00), fire extinguisher ($16.20), first aid kit ($5.39), flashlights ($3.60/2pk), foam crack sealant ($2.19), food container- large ($5.40), food containers - small ($18.00/30ct), furnace filter ($3.60), gun trigger locks ($0.00 as they were leveraged from a partner program), HEPA room air purifier ($100.00), HEPA vacuum ($129.99), HEPA vacuum bags ($3.48).hypoallergenic mattress covers (twin - $27.92, full - $35.90, queen - $40.15, king - $51.68),
hypoallergenic pillow cover ($4.69), mice baits ($3.60/8pk), nightlights ($1.80), outlet covers ($2.40/30ct), poison control magnet ($0.00), pull-cord wind-ups ($1.80/2pk), roach baits ($6.36/12pk), safety gate ($9.00), shower curtain ($2.10), step stool ($4.50), smoke alarm ($5.00), thermometer ($3.60), trash can with lid ($9.90). Included in these prices were a green cleaning kit to reduce in home chemicals. The kit included the following items: bucket ($1.68), disposable gloves ($7.74/100ct), mop handle ($7.17) and mop head refills ($9.68/3pk) or Swiffer handle ($8.08) and refills ($6.72) depending on flooring surfaces in home, shop towels in a box ($7.20), spray bottle ($1.78),
55
The Custom Intervention Products (average cost $391/unit) were installed based on need and program compliance of the family. Included products that were installed were: window air conditioning units for eligible housing to be located in subject child’s
bedroom (average cost $100.00); twin mattress, box spring, and frame ($295.00); full mattress, box spring, and frame ($374.00); dehumidifiers for homes with bedrooms at ground or basement levels (average cost $160.00); and dryer vent repair (average cost $30.00).
Table 4.2: Basic and custom intervention products and services
Basic - Asthma Related Products Basic - Safety Related Products
HEPA vacuum HEPA room filters
Trash can with secure cover Food containers with securing lids Smoking cessation kit
Green cleaning supplies Pillow and mattress covers IPM traps and baits Foam crack sealant Caulk
Shower curtain
Low allergen furnace filters Door mats
Fan
Outlet safety plugs
Carbon monoxide and smoke detectors Cabinet safety locks
Skid proof bathtub mats Fire extinguisher Gun trigger locks
Mercury-free thermometers
Poison Control Stickers and First aid kits Child safety gate
Mini blind cord wind-ups Flashlights and nightlights Step stool
Radon test kits
Custom Products Custom Services
Beds and pillows Carpet removal and floor replacement Surge protectors Integrated pest management services
Dehumidifiers Slope/yard grading
Window air conditioning unit Electrical improvements Dryer vent/extenders Garbage removal
Gutter extenders Moisture control (ventilation, gutter installation, plumbing repair, roof repair)
4.3.4. Consultants
56
install the HHU II products given to the families on the Baseline Site Visits. The HHU II Program Manager, Assistant Field Coordinator and two CDC Apprentices were also trained to administer health questionnaires and education, install basic intervention products, in the event a technical assistant could not attend the scheduled site visit. Additionally, lead paint worker and supervisor educational stipend funding ($500) was provided to five (5) low – moderate-income individuals within the target community to install products and services.
A policy and procedure document was created to delineate the responsibilities and duties of the TA’s. In summary, the responsibilities included; performing a visual assessment of all interior and exterior components of the structure, yard and outbuildings for asthma triggers and injury hazards; installation of the intervention products; recording the type, number, and location of each product installed on the room-by-room checklist; walking through the home to identify products, show the family how to use and maintain products and educate the family on products installed within the home. The total spent on product installation and assessments for healthy homes interventions was $50,675. This amount was included in MARGINAL, DIRECT, and FULL costs and calculations.
At the baseline site visit the families completed the baseline survey; received education regarding home asthma triggers and injury control based on answers to the
57
environmental, health and safety risks in the unit. It also provided the program with information to determine the priority and level of intervention work needed in a unit. The program staff provided hands-on education regarding asthma triggers, home safety and basic home maintenance to every family. Each family received the HHU II Course Manual which included topics, such as; asthma medications, asthma triggers, asthma action plan, nutrition, smoking cessation resources, home safety, HEPA vacuum and room filters, pesticides, green cleaning products, air scents, asbestos, radon, lead-based paint and local resources. Every family received the installation of the basic products and a subset of families received various custom products and services. Both are outlined in Table 4.2. Baseline and custom products were included in the
MARGINAL, DIRECT, and FULL cost calculations.
4.3.5. Other Costs
Financial Administrative Services costs totaled $57,000, and were for the administration of financial services by the Michigan Department of Community Health offices of finance and budget for providing services for LOCC’s draw down, purchasing of supplies and overseeing contracts and grant administration.
Environmental Review Public Notices funding in 3 local newspapers at a total cost of $1,500 was expended to meet HUD’s Environmental Review Procedures. $400 was spent on the Flint site and $1000 to support neighborhood coalitions.
The part time epidemiologist had indirect costs of $4,780.
58
over the three years of the project. These ‘other’ costs were only counted in the ‘FULL’ costs calculations.
4.3.6. Total Costs
Project implementation costs totaled $1,313,120. Personnel costs were the largest expense representing 47% of the total cost of the project. This was followed by leveraged/match funds at 22%, supplies/materials at 14%, direct costs at 6%, other indirect costs at 5%, consultants at 4%, and travel at 2%, representing the actual implementation costs.
4.4. Cost Considerations
59
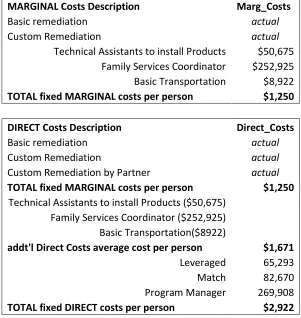
Table 4.3: Elements: Marginal, Direct, & Full Project Comparisons
MARGINAL Costs Description Marg_Costs
Basic remediation actual
Custom Remediation actual
Technical Assistants to install Products $50,675 Family Services Coordinator $252,925 Basic Transportation $8,922
TOTAL fixed MARGINAL costs per person $1,250
DIRECT Costs Description Direct_Costs
Basic remediation actual
Custom Remediation actual
Custom Remediation by Partner actual
TOTAL fixed MARGINAL costs per person $1,250
Technical Assistants to install Products ($50,675) Family Services Coordinator ($252,925) Basic Transportation($8922)
addt'l Direct Costs average cost per person $1,671 Leveraged 65,293 Match 82,670 Program Manager 269,908
60
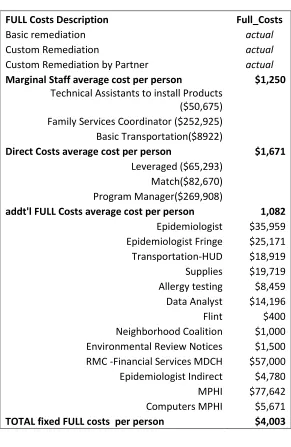
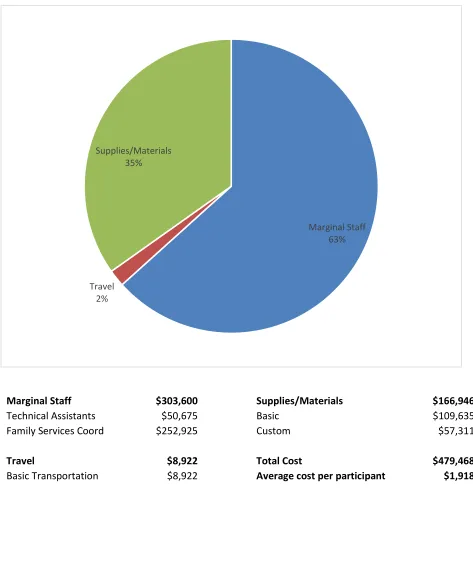
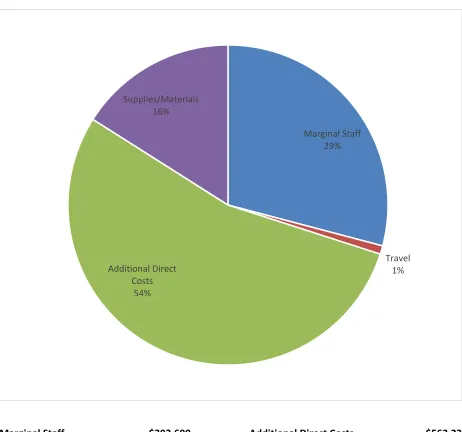
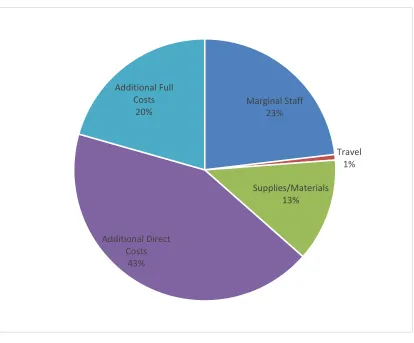
Once the actual remediation costs are added, Figure 4.1, Figure 4.2 and Figure 4.3 show the average marginal ($1,918), direct ($4,171), and full costs ($5,252) per participant in the project.
TABLE 4.3 (Cont’d)
Elements: Marginal, Direct, & Full Project Comparisons
FULL Costs Description Full_Costs
Basic remediation actual
Custom Remediation actual
Custom Remediation by Partner actual
Marginal Staff average cost per person $1,250
Technical Assistants to install Products ($50,675) Family Services Coordinator ($252,925) Basic Transportation($8922)
Direct Costs average cost per person $1,671
Leveraged ($65,293) Match($82,670) Program Manager($269,908)
addt'l FULL Costs average cost per person 1,082
Epidemiologist $35,959 Epidemiologist Fringe $25,171 Transportation-HUD $18,919 Supplies $19,719 Allergy testing $8,459 Data Analyst $14,196 Flint $400 Neighborhood Coalition $1,000 Environmental Review Notices $1,500 RMC -Financial Services MDCH $57,000 Epidemiologist Indirect $4,780 MPHI $77,642 Computers MPHI $5,671
[image:62.612.72.363.104.551.2]61
Figure 4.1: MARGINAL Costs
Marginal Staff $303,600 Supplies/Materials $166,946
Technical Assistants $50,675 Basic $109,635
Family Services Coord $252,925 Custom $57,311
Travel $8,922 Total Cost $479,468
Basic Transportation $8,922 Average cost per participant $1,918 Marginal Staff
63%
Travel 2%
62
Figure 4.2: DIRECT Costs
Marginal Staff $303,600 Additional Direct Costs $563,237
Technical Assistants $50,675 Leveraged-custom partner $56,489
Family Services Coord $252,925 Leveraged -other $65,923
Match-custom partner $88,246
Travel $8,922 Match-other custom products $36,439
Basic Transportation $8,922 Match -other partner $46,232
Program Manager $269,908
Supplies/Materials $166,946
Basic $109,635 Total Cost $1,042,705
Custom $57,311 Average cost per participant $4,171
Marginal Staff 29%
Travel 1% Additional Direct
Costs 54%
63
Figure 4.3: FULL Costs
Marginal Staff 23%
Travel 1%
Supplies/Materials 13%
Additional Direct Costs
43% Additional Full
Costs 20%
Marginal Staff $303,600 Additional Full Costs $270,416
Technical Assistants $50,675 Epidemiologist $35,959
Family Services Coord $252,925 Epidemiologist Fringe $25,171
Transportation-HUD $18,919
Travel $8,922 Supplies $19,719
Basic Transportation $8,922 Allergen Testing $8,459
Data Analyst $14,196
Supplies/Materials $166,946 Flint $400
Basic $109,635 Neighborhood Coalition $1,000
Custom $57,311 Environmental Review Notices $1,500
RMC -Financial Services MDCH $57,000
Additional Direct Costs $563,237 Epidemiologist Indirect $4,780
Leveraged-remediation $56,489 MPHI $77,642
Leveraged -other $65,923 Computers MPHI $5,671
Match-remediation $88,246 Match-other custom products $36,439
Match -other partner $46,232 Total Cost $1,313,121