2019 International Conference on Information Technology, Electrical and Electronic Engineering (ITEEE 2019) ISBN: 978-1-60595-606-0
Developing a Remote Visualization and Diagnostic System for
Electric Operating Tabl
e
Tian-hua HUANG
1, Jian-jun YI
1,*, Liang HE
2,3, Ya-jun ZHANG
1and Wang HE
11
Department of Mechanical Engineering, East China University of Science and Technology, Shanghai 200237, China;
2
Shanghai Aerospace Control Technology Institute, Shanghai 201109, P. R. China; 3
Shanghai Key Laboratory of Aerospace Intelligent Control Technology, Shanghai 201109, P.R. China
*Corresponding author
Keywords: Electric operating table, Visualization, Expert system, Fault tree.
Abstract. In order to make the electric operating tables in each medical institution have good management and maintenance, this paper proposes a system that can monitor and diagnose the running conditions of operating table visually and remotely. The system use advanced sensor technology to collect all kinds of parameters of operating table, and send the data to Data Center through the wireless transmission way. In order to realize the visual diagnosis, this paper provides several kinds of models to display the real state of operating table, including mechanical models, hydraulic models, electrical structure models, and the corresponding internal small unit structure models. Then the staff can monitor and diagnose the operating table according to the various models. Furthermore, this paper purposes an expert system to diagnose some common and happened fault rapidly and accurately, which can greatly improve the management and maintenance of electric operating table.
Introduction
Electric operation table is a kind of basic medical device, which plays an important role in orthopedics, orthopedics and surgery. However, the majority of operating tables distributed in more than 400,000 medical institutions nationwide are still in the situation of no monitoring, no self-diagnosis, relying on professional staff to travel for maintenance and other conditions.There are limitations such as low safety in use, high maintenance cost, and difficulty in product r&d and upgrading. At the same time, electric operating table is a relatively complex electromechanical and hydraulic coupling system, which requires high professional requirements for maintainer and is difficult to maintain. So there is usually a large lag in maintenance. Once a part of the operating table malfunctions and fails to work properly, it will not only cause great economic losses, but even influence the normal operation and endanger the lives of patients. Therefore, there is an urgent need for a system to manage and maintain the electric operating tables, which can get the real-time status of tables to monitor, tracking and diagnose the operating tables. It not only can save expenses for medical institutions, but also provide more professional, safe and effective maintenance conveniently.
The Overall Structure of the System
Also, it is convenient for the institution to obtain and process the operating table data in that institution. Then the gateways sent all the received data to the remote server. And the data is processed in the server [1]. All data displayed in visualization models is used to diagnosis. The visualization models include mechanical structure model, hydraulic system model, electrical system model and the small models of each part. Users can get what they want on the terminal device, including models, data and diagnostic results.
。。。。
Gateway
Server
Wifi Wifi Wifi Wifi
Electric system
Hydraulic system
Mechanical structure
Visualization model
Diagnostic system
Mechanical structure
Hydraulic system
Control system Database
Diagnostic system
End-user
[image:2.595.171.415.163.319.2]Gateway
Figure 1. The whole system structure.
The Sensor Data on Operation Tables
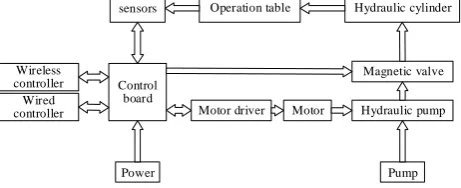
At present, the operating tables on the market are commonly electro-hydraulic type, and the basic components and working principle as shown in figure 2. The main control board receives the instruction from handhold controller, then drive motor and the corresponding electromagnetic valve according the instruction to realize the corresponding movement of operating table. The whole control process include circuit control, drive hydraulic system and the mechanical structure. So we should get the following data by sensors to monitor and diagnose the electric operating tables, including bed running posture, state of the electric and hydraulic system.
Control board
Motor driver Motor Hydraulic pump
Magnetic valve Hydraulic cylinder Operation table
sensors
Wired controller
Wireless controller
Power Pump
Figure 2. The structure of the operating table.
The perception detection module is integrated on the main control board to detect and collect all kinds of information on the electric operating table. The Angle value, oil pressure value and flow value of the operating table need collected. As well as whether the motor, electromagnetic valve, acceleration sensor and infrared receiver head are working normally.
The angles of the operating table are gotten by acceleration sensor - ADXL345. Pressure sensors are used to collect oil pressure values. The inlet and outlet flow rate of hydraulic pump is measured by flow meter. The voltage and current values of the motor determine the operation status of the motor. The voltage and current values of electromagnetic valve show the running state of electromagnetic valve [3]. Wifi technology is used to transmit various parameters and results obtained by each sensor.
Make the Visualization Model with Unity3d
[image:2.595.183.414.470.564.2]graphics or image, and has real-time interactive ability, and can reflect the reality of the real world. We use visualization technology here, to vividly display the data collected on the electric operating table through the movement of the models [5]. So that users can visually see the state of the operating table, fault location and other information on the remote platform.
According to the working principle of electric operating table and the information for diagnosis, we establish the mechanical structure model of electric operating table to reflect the real-time motion state of electric operation bed. Besides the electrical system model and the hydraulic system model are established to represent the overall working conditions of operating table. What’s more, in order to show more clearly the state of various modules of the operating bed and the interaction and communication between modules, we establish other small sepatate models of the table, including the control board model, motor model, hydraulic pump model, the electromagnetic valve model, hydraulic cylinder model and so on. In order to facilitate modeling, we use Solidworks software to establish various mechanical models of the operation bed, and then import them into Unity3d software.
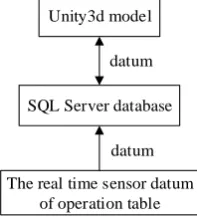
The model needs to reflect the status of the real electric operating table, so it needs to interact with the real-time data or database data. SQL Server database is used here to store the data. Parameters collected in real time by sensors of the operating table were uploaded to the Server through the network and stored in the database. Then, Unity3D project connected to the SQL Server database to achieve the data and realize corresponding animation display through scripts. The data transfer framework is shown in the figure 3.
Unity3d model
SQL Server database
The real time sensor datum of operation table
datum
[image:3.595.255.354.357.466.2]datum
Figure 3. Data transmission between data from bed and models.
Fault Diagnosis Expert System
Through the visualization technology, remote experts can analyse and diagnose the operating table through the models that reflecting the real-time state of operation bed. However for the daily management of maintenance and common fault analysis, we can establish a fault analysis expert system based on electric operation bed to maintain the operating table and solve some common faults, which can save manpower and cost, and further improve efficiency [6].
Knowledge base
Reasoning machine
Database
Interpretation mechanism
User interface
User
[image:3.595.228.386.589.729.2]Knowledge acquisition
Figure 4. The structure of the fault diagnosis expert system.
existing experience and knowledge. In addition to solving the faults that have occurred before, it can even judge the faults that have not occurred before, and store the new fault information, so as to make accurate and rapid judgment next time the same fault is encountered. Expert system generally includes knowledge base, reasoning machine, database, interpretation mechanism and human-computer interaction port, as shown in the figure.
Establishing the Knowledge Base. According to the characteristics of electric operating table, the expert system divides the knowledge base into mechanical structure, hydraulic system, electronic control system and the other four categories. Each category is divided into several small categories. Through various ways to collect fault may occur while the operating table work and the corresponding solutions. These knowledge sources include book knowledge of related theory has been formed, technical means and methods of the widely recognized by peers, early experience, as well as the relevant manuals, guides, equipment operation instruction and maintenance manuals and other information [7].
Due to the limitation of the knowledge base that can't contain all the failure problems of operating bed. We design a man-machine dialogue port. So the operation and management personnel can inport the new solutions and new problem to system, which can enhance the adaptability and learning ability of expert system. As the growth of the system using time, increasingly rich knowledge base, system can solve more and more problems and more accurately.
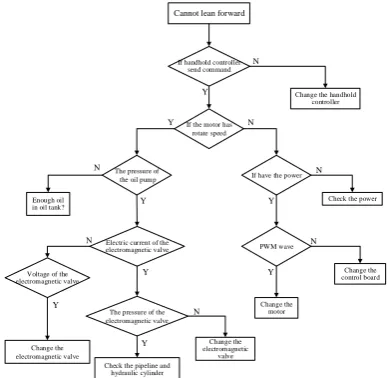
Fault Tree and Resolution Strategy. Fault tree is an inverted tree structure diagram used to express the logical relationship between a particular event and each subsystem or sub-event related to it. Generally, it relies on the steps of determining the top event, investigating the cause event and designing the fault tree.
The top event is the failure phenomenon to be analyzed. The top events selected in the expert system for fault diagnosis of the electric operating table include: a certain movement does not move, some movements does not move, movements chaos, unexpected movement happenes, unstable movement, abnormal sound, etc. For each top event, according to the mastered knowledge, collected data and information and previous similar fault experience, the main causes of the fault are analyzed and determined, and then the fault tree is designed according to the logical relationship obtained from the fault cause analysis.
System fault
Hydraulic system
Mechanical structure Electrical
control system
power motor
Handhold controller
Control board
Hydraulic oil
Hydraulic cylinder
Electromagnetic valve Hydraulic
pump
waist table
back base
Figure 5. Fault tree of the system.
By establishing the faults knowledge base of electric operation bed, the faults are divided step by step until the basic causes of operating faults are found. Electric operating table mainly includes three parts: electric control system, hydraulic system and mechanical structure system. As shown in the figure 5, the system fault tree can be further divided down level by level to obtain the component fault tree. For special problems, the professional technicist analyse the real state of operating table to find the reasons and solutions, which can improve the system fault tree and knowledge base.
Cannot lean forward
If handhold controller send command
If the motor has rotate speed
The pressure of
the oil pump If have the power
PWM wave Electric current of the
electromagnetic valve
The pressure of the electromagnetic valve Voltage of the
electromagnetic valve
Change the handhold controller
Check the power
Change the control board
Change the motor Enough oil
in oil tank?
Change the electromagnetic valve
Check the pipeline and hydraulic cylinder
Change the electromagnetic
valve
Y N
Y N
N Y
Y
Y Y
N
N Y
Y N
[image:5.595.207.401.70.259.2]N
Figure 6. The fault tree of the problem of forward lean.
Validation of the System
[image:5.595.62.534.379.498.2]The following figure 7 shows the circuit board designed by adding wifi module and sensor interface on the basis of the original controller of the electric operating table. As shown in the figure 8, it is the home page of the monitoring platform, including the model view of real-time action, expert diagnosis system, diagnosis record and knowledge management.
Figure 7. Control board. Figure 8. Home page of the system.
Enter the view model interface, take the overall model as an example, as figure 9, when the real operating table moves, the model can carry out the corresponding action, and the specific data can be seen on the left side of the interface.
Figure 9. Page of the model. Figure 10. Page of the expert system.
[image:5.595.56.538.558.701.2]normal, and quickly find out the cause and give the solution through the fault tree and historical diagnosis record in the system. According to the parameters, the system find the causes are the connection of the power line and the electromagnetic valve broken. The real cause is one of the causes that the system finds. So the system is useful.
Summary
This paper presents a method for remote visual monitoring and diagnosis of electric operating table. All kinds of sensors are used to get the real-time information data from operating table. Then the data are sent to remote server through wireless transmission way. The established diagnosis expect system can find the fault and solutions quickly according to the knowledge base. Besides, I create many kinds of models that reflect the real state of operating table, through which the technician can know the condition of table clearly and solve the complex and uncommon faults. Then the expert system will become better and more intelligent over time.
Acknowledgements
This paper was supported by the Military and civilian integration project(Shanghai economic and information commission) under Grant No.201720, the Natural Science Fund of China (NSFC) under Grant Nos. 51575186, 51275173, and 50975088, Shanghai Software and IC industry Development Special Fund under Grant No. 180121, and Shanghai Science and Technology Action Plan under Grant No. 18DZ1204000, 18510745500.
References
[1] Jian W, Wei-Li L I. Design and Implementation of Visualized Workflow Modeling System Based on B/S Structure[J]. Journal of Donghua University, 2007, 24(1):75-78.
[2] Zhu S, Xu Q, Xu Y. Study of remote monitoring system of working states of metro door system[C]//IEEE International Conference on Mechatronics & Automation. IEEE, 2016.
[3] Hou P, Bai S , Ge Y, et al. Research on expert diagnosis system for mechanical fault of high voltage circuit breaker based on fuzzy matrix and neural network technology[C]//International Conference on Condition Monitoring & Diagnosis. IEEE, 2016.
[4] Sci I J, Technol, Kamath R S, et al. Development of cost effective 3D stereo visualization software suite for manufacturing industries[J]. Indian Journal of Science & Technology, 2010, 3(5):564-566.
[5] Yaoping Z, Yang. 3D Visualization Processing and Analysis of Surface Subsidence Rule of a Mined-out Area[J]. Metal Mine, 2013.
[6] Zhou W P, Sun D L, Wang J L. Fault Diagnosis of Ship Power Supply System Based on grey correlation improved BP neural network[C]//Chinese Automation Congress. IEEE, 2016:1203-1208.