International Research Journal of Natural and Applied Sciences Vol. 4, Issue 1, January 2017 Impact Factor- 5.46 ISSN: (2349-4077)
© Associated Asia Research Foundation (AARF)
Website: www.aarf.asiaEmail : [email protected] , [email protected]MORPHOMETRIC EVALUATION OF 4
THORDER DRAINAGE BASIN
OF TAPI SYSTEM
Dr. Vaishampayan Mohan Rajaram,
G.E.T`s Arts, and Science. College P.G. and Research Deptt. of Geography,
Nagaon, Tal. and Dist. Dhule.
ABSTRACT
Morphometry is the most popular technique of landform evaluation since long in the
field of Hydrology, Engineering, Geology and Geomorphology. It includes measurement of
linear areal and relief properties of landforms. It has been attempted to used various
hypothesis, concepts and determines the landform characteristics. The present paper aims to
test the null hypothesis regarding the morphometric characteristics of land form with the help
of the quantitative techniques.
Keywords: Basin Area, Bifurcation ratio, length ratio and drainage density.
Introduction
Morphometry is the most popular technique of landform evaluation since long in the
field of Hydrology, Engineering, Geology and Geomorphology. It includes measurement of
linear areal and relief properties of landforms. It has been attempted to used various
hypothesis, concepts and determines the landform characteristics. The present paper aims to
test the null hypothesis regarding the morphometric characteristics of land form with the help
of the quantitative techniques.
Study Area
The study area is located in the northwest part of Maharashtra, which extend between
Methodology
Six 4th order drainage basins have selected randomly from the given toposheets Nos.
46 G/14, 46 L/13, 46 K/16 of the Tapi river systems .Perimeter ,are, order wise length and
number have been estimated. The Basin Area, Bifurcation ratio, length ratio is been
calculated for estimation.
Result and Discussions
Bifurcation Ratio (R)
The bifurcation ratio is the ratio between numbers of stream segments of the given order (Nu)
and the number of stream segments of next higher order (Nu +1) It can be expressed as
R= Nu / Nu+1
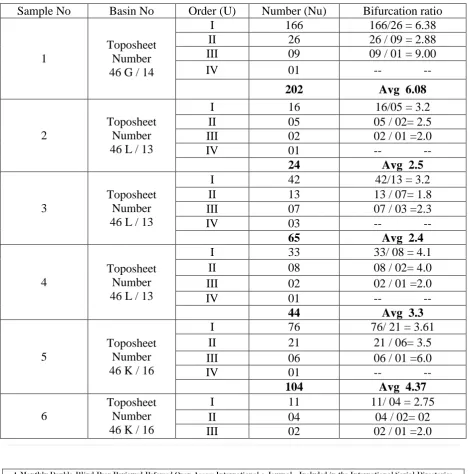
[image:2.595.64.535.289.764.2]The bifurcation ratio is estimated and tabulated as follow in Table No 1
Table 1
Sample No Basin No Order (U) Number (Nu) Bifurcation ratio
1
Toposheet Number 46 G / 14
I 166 166/26 = 6.38
II 26 26 / 09 = 2.88
III 09 09 / 01 = 9.00
IV 01 -- --
202 Avg 6.08
2
Toposheet Number 46 L / 13
I 16 16/05 = 3.2
II 05 05 / 02= 2.5
III 02 02 / 01 =2.0
IV 01 -- --
24 Avg 2.5
3
Toposheet Number 46 L / 13
I 42 42/13 = 3.2
II 13 13 / 07= 1.8
III 07 07 / 03 =2.3
IV 03 -- --
65 Avg 2.4
4
Toposheet Number 46 L / 13
I 33 33/ 08 = 4.1
II 08 08 / 02= 4.0
III 02 02 / 01 =2.0
IV 01 -- --
44 Avg 3.3
5
Toposheet Number 46 K / 16
I 76 76/ 21 = 3.61
II 21 21 / 06= 3.5
III 06 06 / 01 =6.0
IV 01 -- --
104 Avg 4.37
6
Toposheet Number 46 K / 16
I 11 11/ 04 = 2.75
II 04 04 / 02= 02
IV 01 -- --
18 Avg 2.25
The table no. indicates that bifurcation ratio is governed by geological structure of the
basin and it is more or less constant in regions of similar geological structure .Under the
normal circumstances it generally ranges between 3 and 5. The above table reveals that the
bifurcation ratio ranges between 2.25 and 6.08 .The range of bifurcation ratio is fairly well
beyond the normal range. With this higher variation of bifurcation ratio one can suggest that
the bifurcation ratio is controlled by stricter.
Stream Length Ratio
It is the ratio of the average stream length of u + 1st order to average stream length of
u th order .It can be expressed as follow
Length Ratio = Lu + 1 / Lu ---2
Generally the average stream length ratio fairly remain constant in case of lower order
stream and fluctuates around 1. It is also governed by geological structure. Average stream
length ratio have been estimated with the help of above formula no.2 and tabulated in table
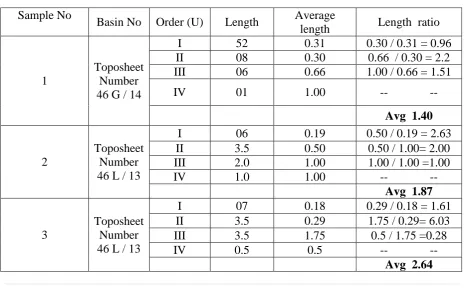
[image:3.595.66.531.451.758.2]no. 2
Table 2
Sample No
Basin No Order (U) Length Average
length Length ratio
1
Toposheet Number 46 G / 14
I 52 0.31 0.30 / 0.31 = 0.96
II 08 0.30 0.66 / 0.30 = 2.2
III 06 0.66 1.00 / 0.66 = 1.51
IV 01 1.00 -- --
Avg 1.40
2
Toposheet Number 46 L / 13
I 06 0.19 0.50 / 0.19 = 2.63
II 3.5 0.50 0.50 / 1.00= 2.00
III 2.0 1.00 1.00 / 1.00 =1.00
IV 1.0 1.00 -- --
Avg 1.87
3
Toposheet Number 46 L / 13
I 07 0.18 0.29 / 0.18 = 1.61
II 3.5 0.29 1.75 / 0.29= 6.03
III 3.5 1.75 0.5 / 1.75 =0.28
IV 0.5 0.5 -- --
4
Toposheet Number 46 L / 13
I 04 0.26 0.30/ 0.26 = 1.15
II 1.5 0.30 2.00 / 0.30= 6.66
III 04 2.00 1.00 / 2.00 =0.5
IV 01 1.00 -- --
44 Avg 2.62
5
Toposheet Number 46 K / 16
I 22 0.28 0.64 / 0.28= 2.28
II 13.5 0.64 0.91 / 0.64= 1.42
III 5.5 0.91 2.5 / 0.91 = 2.74
IV 2.5 2.5 -- --
Avg 2.14
6
Toposheet Number 46 K / 16
I 4.00 0.36 1.60 / 0.36 = 4.40
II 2.5 1.60 0.75 / 1.60 = 0.46
III 1.5 0.75 0.5 / 0.75 = 0.66
IV 0.5 0.50 -- --
Avg 1.85
The table No.2 revels the following facts
The average stream length ratio ranges in between 1.4 to 2.64. The average stream
length ratio of lower order fluctuates around one. The length ratio between IIIrd and IInd order
basin varies greatly. The facts shows that the length ratio varies unlike bifurcation ratio.
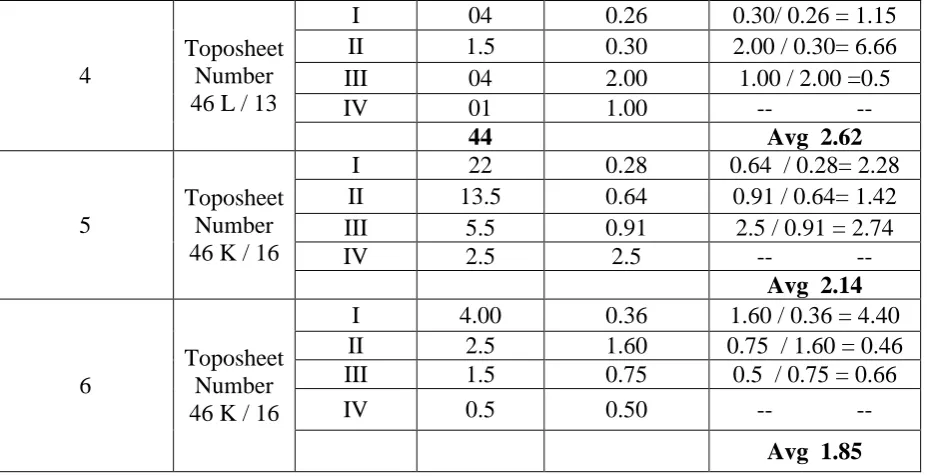
Drainage Basin Area
The drainage basin area is a total catchment area ,which is the total catchment area of
that basin drained by entire network of the same basin. The size of the basin is controlled by
lithology, structural topography and climate. The catchment area of 4th order basin has been
[image:4.595.68.532.36.274.2]measured and tabulated in the table No.3
Table 3
Sample Basin 1 2 3 4 5 6
Area (Sq.Miles) 16.87 7.70 3.75 4.50 9.68 2.00
Perimeter (Miles) 18 10 07 09 14 605
The table No.3 shows that the size of the drainage varies greatly .It ranges between 02
to 16.87 Sq.miles though they have same hierarchical order i.e 4th order .The sample No.1
have greatest catchment area in all basins as it is located in the Satpuda region.
Topographically it is mountains whereas structurally it is underlined by the cretaceous beds
or Bagh beds.Sample No.6 is located in the alluvial plain near the main river Tapi there the
structure it can seen that size of basin is controlled by geological structure and topographic
factors.
Reference
1) Clifford. D.Ollier :- The Article for „Catenas in Different climate‟ Edited by Carson
.M.A. & Kirby- Hill slope from and process. Cambridge University Press (1972) p.p.
138 to167.
2) P.K.Gupta:- Environmental Analysis water ,soil and air published by Agrobios (India)
Agro House ,Behind Nasrani cienema chopasani Road ,Jodhpur.
3) Savinder Sigh and A.Dubey(1987) :- Fluvial erosion & sediment load charactertics of
Ganga system in U.P. ,India. Geomorphology and Environmental management
Allahabad International Symposium.
4) Soil Survey Manual :- U.S. Deptt. of Agriculture (1956)
5) Dr.S.M.Bhamare (1987):- „Geomorphic Analysis of Panzara Basin “ Unpublished
Ph.D. Thesis.
6) Dr.M.R.Vaishampayan (2005):- “Palaeo – Hydrological Constraints in River