R E S E A R C H A R T I C L E
Open Access
Important work demands for reducing
sickness absence among workers with neck
or upper back pain: a prospective cohort
study
Stefan Oliv
*, Ewa Gustafsson, Adnan Noor Baloch, Mats Hagberg and Helena Sandén
Abstract
Background:The aim of this study was to investigate what exposure to work demands, physical and psychosocial, is associated with lower levels of sickness absence among workers with neck or upper back pain in different groups, by age, gender, duration of sickness absence and work ability score.
Methods:This study was a prospective study of 4567 workers with neck or upper back pain. Data on neck or upper back pain, work demand and work ability were obtained from the Swedish Work Environment survey over a 3–year period (2009–2013). Register data on sickness absence, 1 year after each survey was conducted, were obtained from the Swedish health insurance database. Analyses were performed to estimate the association between self-reported work demands and registered sick days > 14 days. The analyses were stratified for gender, age group and work ability score.
Results:Lower numbers of sick days were found for workers reporting low exposure to lifting≥15 kg and twisted or forward-leaning work postures. Lower numbers of sick days were found for workers reporting high work control and seated work. The associations were generally stronger in the older age groups for the physical work demands.
Conclusions:The findings in this study suggest that certain physical work demands and having high control over one’s work can result in lower sickness absence, especially among middle-aged and older workers with neck or upper back pain.
Keywords:Work ability, WAI, Occupation, Occupational health
Background
Neck pain is one of the most common musculoskeletal disorders, which causes sickness absence and early re-tirement [1–4]. Manual labour, awkward postures and repetitive work are commonly reported as causes for work-related neck disorders. Psychosocial factors such as high job demands, low support from supervisors and co-workers and low job control have also been reported as important contributors to musculoskeletal disorders [5–8]. Regardless of the cause, neck pain can lead to re-duced work ability, rere-duced productivity, work disability
and early retirement [9–11]. It has been shown that workers with high levels of physical work demands have a higher risk of work-related disability compared with workers in less physically demanding jobs [12, 13]. Women have a higher prevalence of neck pain compared with men, which is partly explained by differences in work exposure between men and women in that women more often perform repetitive work and report poor ergonomics to a higher degree then men [14–16]. In general, the peak prevalence of neck pain is at about age 45 years, which means that neck pain is most prevalent during working age [17]. Prevalence estimates differs across studies, a review found that the annual prevalence of neck pain in workers ranged from 27 to 48% [18]. Among workers, 11–14% report activity limitation due
© The Author(s). 2019Open AccessThis article is distributed under the terms of the Creative Commons Attribution 4.0 International License (http://creativecommons.org/licenses/by/4.0/), which permits unrestricted use, distribution, and reproduction in any medium, provided you give appropriate credit to the original author(s) and the source, provide a link to the Creative Commons license, and indicate if changes were made. The Creative Commons Public Domain Dedication waiver (http://creativecommons.org/publicdomain/zero/1.0/) applies to the data made available in this article, unless otherwise stated.
* Correspondence:Stefan.oliv@amm.gu.se
to neck pain as measured with compensation claims, but it has been suggested that this is a significant underesti-mation [19]. In Sweden approximately 23% of workers report neck pain during the last 3 months. Of those reporting neck pain 63% were women [20].
Recent studies have shown that workers with pain re-port lower work ability and also lower work performance and productivity [21, 22] compared with workers with-out pain. Self-reported work ability has also been shown to predict sickness absence in that workers who report a lower level of work ability are at higher risk for future sickness absence [23,24].
In a previous study we investigated the association be-tween physical and psychosocial work demands and work ability among workers with neck pain [25]. In that study it was found that excellent work ability was associ-ated with having lower physical work demands among older workers. In the present study we wanted to exam-ine the effect of work demands and work ability on fu-ture sickness absence.
The aim of this study was to investigate what exposure to work demands, physical and psychosocial, is associ-ated with lower levels of sickness absence among workers with neck or upper back pain in different groups, by age, gender, length of sickness absence and work ability score.
Methods
This was a follow-up study using data sourced from the Swedish Work Environment survey from 2009, 2011 and 2013, and from the Longitudinal integration database for health insurance and labour market stud-ies (LISA) database from 2010, 2012 and 2014. All Swedish residents are included in the LISA database. Individuals in these databases were linked using the Swedish personal number in Statistics Sweden’s (SCB) Microdata Online Access (MONA) system. The Work Environment survey is an addition to the annual Swedish Labour Force survey.
Source population
The Work Environment survey is conducted both by telephone interview and by postal questionnaire. During the telephone interview general questions about the work environment are asked, and also a question on work ability. A questionnaire is sent to those that agree to participate after the interview. The persons eligible for inclusion in the Work Environment survey are drawn from a representative sample of the Swedish population age 16–74 and inclusion criteria are employment and not on long-term sick or maternity leave. The Work Environment Questionnaire sent consisted of 121 ques-tions regarding various aspects of work environment.
Neck or upper back pain
Pain in the neck or upper back was measured using a self-reported question from the SCB Work Environment survey, asking about pain in the “upper back or neck” after work during the last 3 months. For this study,“pain in the neck or upper back” was defined as self-reported pain in the neck or upper back “a few days per week (1 day out of 2)” or more often [25].
Work ability
In the interview part of the Work Environment survey a question is asked about work ability. The question which is asked is called the Work Ability Score (WAS) “ As-sume that your work ability at its best has a value of 10 points. How many points would you give your current work ability?” with a score of 1–10. Studies have shown that the WAS question has good validity and reliability when compared with the Work Ability Index (WAI)
[24, 26]. In this study work ability as measured by the
WAS was categorized in four categories, poor, moderate, good excellent work ability [27]. This question was included, as it were hypothesized that sickness absence would be different in the different WAS categories.
Physical exposure
Exposure to physical work demands were measured using self-report questions from the Work Environment survey. The questions used for this study were questions regarding whole body and hand/arm vibrations, lifting > 15 kg, frequent rotations of the trunk, work in a twisted or bent position, work while leaning forwards without support, work with hand at or above shoulder level, repetitive movements and seated work. A detailed de-scription of the questions can be found in a previous publication [25]. For this study, physical exposure was classified ashigh exposurefor those that reported expos-ure “half of the time” or more and those who reported exposure less than half of the time were classified as havinglow exposureto that work demand. This exposure level has previously been used in similar studies [25,28].
Psychosocial exposure
regarding: support form supervisors and support from fellow workers. A detailed description of the questions and the index calculations can be found in a previous publication [25].
The measure for sickness absence used was obtained from the LISA database. The measure used was net sick days (n-days) > 14 days during the year following partici-pation in the Work Environment survey. (Two days on 50% sickness absence were counted as one n-day.) A more detailed description can be found in a previous publication [27].
Statistics
For all analyses in this study, SAS version 9.3 (SAS Institute, Cary, NC, USA) was used. Descriptive data on the neck or upper back pain and no neck or upper back pain groups were derived through frequency analyses. Wilcoxon Sum Rank Test was performed to estimate the association between high or low exposure to physical and psychosocial work demands and sick-ness absence as measured by n-days [29]. A difference between high and low work demands was considered significant when P< 0.05. The analyses were stratified for gender, age group and WAS. Quantile regression is a semi-parametric statistical method that investigates the difference between high and low work demands and several percentiles of sickness absence [30]. A quantile regression analysis was used to estimate the association between high or low exposure to different work demands and sickness absence (n-days) in the 90th, 95th and 99th percentiles. Coefficients from quantile regression are interpreted similarly to coeffi-cients of ordinary linear regression, except that a quantile regression coefficient indicates the change in the value at the given percentile, not the mean, of the outcome variable.
Results
Study population
A total of 29,682 workers were sent the Work Environ-ment Survey questionnaire and 18,786 replied (63% re-sponse rate). Four thousand five hundred sixty-seven workers reported neck or upper back pain after work “a few days per week (1 day out of 2)”or more often during the last 3 months. A larger proportion of women workers, 66%, compared to men workers reported neck or upper back pain (Table 1). The most common occu-pations among workers with neck or upper back pain were for women workers service, care and shop sales, and for men workers craft and related, trades, mining and construction (Table 2). Women workers had a higher mean number of n-days > 14 days compared to men workers (11 and 9 n-days, respectively). This pat-tern was also seen on the 90th and 95th percentiles. The highest number of n-days was found among workers who reported poor work ability (WAS 1–5). Higher numbers of sick days were found in older workers com-pared to younger (Table3).
[image:3.595.58.539.565.732.2]There was a difference in sick days found between the groups reporting low or high exposure to several phys-ical work demands. The groups reporting low exposure to: lifting ≥15 kg, twisted work posture, leaning forward without support and frequent trunk rotations had fewer n-days. Among men, a difference was found for low ex-posure compared to high exex-posure, to whole-body vibra-tions and working with hands above shoulder level (Tables4and5). For women, reporting high control was associated with fewer sickness absence days compared to having low control (Table 6). Those who reported high exposure to seated work had fewer registered sickness absence n-days (> 14 days) compared to the group reporting low exposure to seated work. Also, the group who reported high control over one’s work had fewer registered sickness absence n-days (> 14 days) compared
Table 1Characteristics of the source population, 18,786 workers with or without neck or upper back pain (neck pain), (18,450 reported Work Ability Score). N = number of workers
Women Men
No neck pain Neck pain No neck pain Neck pain
N= 6957 N= 3023 N= 7262 N= 1544 Age category
16–29 years 948 383 937 140 30–49 years 3285 1415 3534 711 50–64 years 2724 1225 2791 693 Work Ability Score
to the group reporting low control (Tables 4, 5 and 6). The analysis divided on age groups found differences mainly in the middle and older age groups, except for hav-ing high control, where differences were found for both the youngest and oldest age groups (Tables7and8).
The quantile regression analysis showed a difference in lower number of n-days on the 90th percentile for those workers who reported low exposure to lifting≥15 kg (14 compared to 28 n-days), twisted work posture (15 com-pared 26 n-days), leaning forward without support (14 compared to 34 n-days) and frequent trunk rotations (12 compared to 24 days). There was a lower number of n-days on the 90th percentile for those workers reporting high exposure to seated work (13 compared to 27 n-days) and for high control (13 compared to 24 n-days).
On the 95th percentile there was a lower number of sickness absence days among workers reporting low
exposure to lifting ≥15 kg (50 compared to 89 n-days), twisted work posture (54 compared 73 n-days), whole-body vibrations (71 compared to 130 n-days), leaning forward without support (51 compared to 94 n-days) and frequent trunk rotations (42 compared to 84 n-days). There was a lower number of n-days on the 90th percentile for those workers reporting high exposure to seated work (45 compared to 86 n-days) and for high control (40 compared to 83 n-days).
On the 90th percentile there was a lower number of sickness absence days among workers reporting low ex-posure to frequent trunk rotations (199 compared to 297 n-days).
Discussion
The main findings in this study suggest that low or high exposure to certain work demands, such as low exposure to lifting > 15 kg, twisted/bent work postures, high ex-posure to seated work and high control, can result in lower sickness absence for workers with neck or upper back pain. A difference, by reporting high or low expos-ure, in sickness absence was found among those who re-ported low exposure to several physical work demands and those who reported high control of their work and high exposure to seated work. These differences were mainly found in the middle and older age groups.
[image:4.595.59.539.110.291.2]In this study we used the WAS as a health measure. The group who reported excellent work ability (WAS 10) and also reported low exposure to physical work de-mands (leaning forward without support and frequent twisting) had n-days compared to those who reported high exposure. The excellent work ability group also had fewer sickness absence days if reporting high exposure to seated work. The only finding in the group with poor work ability (WAS 1–5) was that those who reported high control over their work had fewer sickness absence
Table 2Occupational groups of the source population, 18,786 workers with or without neck or upper back pain (neck pain). N = number of workers
Occupation Women Men
No neck pain Neck pain No neck pain Neck pain % (N= 6957) %(N= 3023) % (N= 7262) % (N= 1544) Service, care and shop sales workers 25 28 7 8
Technicians and associated professionals, nurses 26 25 23 17 Professionals, e.g. teachers, computer technicians 25 21 21 17 Clerks, office, warehouse workers 11 12 4 4 Plant and machine operators 2 3 14 20 Craft and related, trade workers, miners, construction workers 1 1 17 24 Managers, legislators, senior officials 5 3 8 4 Elementary occupations, janitors, cleaners, etc. 4 5 2 3 Skilled agricultural, forestry and fishery workers 1 1 2 2
Other < 1 1 2 2
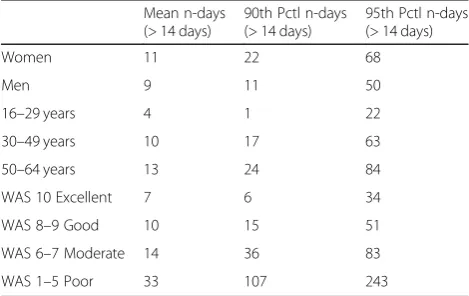
Table 3Sickness absence in one year: registered sickness-absence net days (n-days) > 14 days among the study populationN= 4567 workers with self-reported neck or upper back pain by gender, age group and work ability score (WAS). Mean number of days, number of days on the 90th and 95th percentile (Pctl).N= number of workers
Mean n-days (> 14 days)
90th Pctl n-days (> 14 days)
95th Pctl n-days (> 14 days) Women 11 22 68
Men 9 11 50
[image:4.595.56.291.583.731.2]days than those reporting low control. These findings are somewhat supported by a Finnish study [31], where it was also found that workers reporting lower levels of work ability have higher numbers of sickness absence days regardless of age, sex or occupation. In this study, the measure of neck or upper back pain consisted of a question regarding whether the worker had had pain in the “upper back or neck” after work during the last 3 months, 2 days per week or more often. A study by Holtermann et al. [4] used a 0–9 scale to describe pain
Table 4One year registered sickness-absence net days (n-days) > 14 days for groups reporting high or low physical work demand exposure
Work demand exposure Low High
N Mean n-days N Mean n-days P* Lifting≥15 kg
All 3054 9 1487 13 < 0.01
Women 2226 10 783 15 < 0.01
Men 828 8 704 11 < 0.05
16–29 years 311 3 210 6 0.62 30–49 years 1443 9 677 13 < 0.01
50–64 years 1300 12 600 16 0.01
Frequent trunk rotations
All 2325 8 2203 13 < 0.01
Women 1583 9 1421 14 < 0.01
Men 742 8 782 11 < 0.05
16–29 years 195 4 325 5 0.74 30–49 years 1188 7 928 14 < 0.01
50–64 years 942 11 950 15 < 0.05
Twisted work posture
All 3350 10 1151 13 < 0.01
Women 2271 11 711 13 0.01
Men 1079 8 440 13 < 0.01
16–29 years 321 3 195 6 0.31 30–49 years 1608 9 494 13 < 0.01
50–64 years 1421 12 462 15 0.05 Hand held vibrating tools
All 4214 11 308 12 0.90 Women 2919 11 78 16 0.81 Men 1295 9 230 11 0.37 16–29 years 486 3 33 17 0.32 30–49 years 1957 10 153 11 0.89 50–64 years 1771 13 122 12 0.45 Leaning forward without support
All 3312 9 1201 14 < 0.01
Women 2245 10 747 14 < 0.01
Men 1067 8 454 14 < 0.01
16–29 years 326 3 190 7 0.68 30–49 years 1591 9 521 15 < 0.01
50–64 years 1395 12 490 16 0.07
[image:5.595.303.540.128.552.2]Four thousand five hundred sixty-seven workers with self-reported neck or upper back pain by gender and age group. Mean number of n-days for description only.Pvalues indicate the difference indistributionof absence days between reporting high or low exposure. Wilcoxon Rank Sum Test * = two tailed; bold numbers indicate a statistically significant difference. N = number of workers
Table 5One year registered sickness-absence net days (n-days) > 14 days for groups reporting high or low physical work demand exposure
Work demand exposure Low High
N Mean n-days N Mean n-days P* Hands at shoulder level or higher
All 3782 10 736 11 0.18 Women 2597 11 395 12 0.56
Men 1185 9 341 10 < 0.05
16–29 years 398 4 121 6 0.38 30–49 years 1788 10 321 12 < 0.05
50–64 years 1596 13 294 12 0.68 Whole-body vibrations
All 4245 10 283 17 0.27 Women 2959 11 48 23 0.64
Men 1286 8 235 15 < 0.05
16–29 years 486 4 34 12 0.77 30–49 years 1978 10 134 18 0.07 50–64 years 1781 13 115 16 0.94 Repetitive movements
All 2873 10 1625 11 0.68 Women 1956 11 1021 12 0.62 Men 917 9 604 10 0.06 16–29 years 273 3 246 5 0.98 30–49 years 1405 9 693 11 0.61 50–64 years 1195 13 686 13 0.65 Seated work
All 1970 13 2558 9 < 0.01
Women 1287 14 1712 10 < 0.01
Men 683 11 846 9 < 0.01
16–29 years 262 5 256 3 0.21 30–49 years 855 12 1260 9 < 0.01
intensity, with 0 being no pain and 9 being the worst pain possible. In that study it was found that among workers with a pain intensity score≥7, 23% had long-term sickness episodes compared with 15% among those who reported a score of 4 on pain intensity.
Reporting high or low exposure to the work demands measured in this study gave different results in the dif-ferent age groups. In the youngest age group (16–24 years) we found a difference between reporting high control over one’s work and a lower number of sickness absence days compared to those who reported low con-trol. In the oldest age group (50–54 years) there were also a lower number of n-days among those reporting high control but also reporting high exposure to seated work and low exposure to frequent twisting and lifting ≥15 kg. Previous studies [31, 32] investigating sickness absence in different age groups also found the highest numbers of sickness absence among older workers, and
furthermore that both musculoskeletal impairment and self-reported work ability and stressful work were deter-minants of future sickness absence. In this study we also found that low exposure to physical work demands is as-sociated with lower numbers of sickness absence days in the middle-aged group.
The measured exposure to work demands showed a similar pattern for both women and men workers with a few exceptions. Among women, there was a difference in sickness absence days between reporting high or low control over one’s work. Among men there were lower numbers of n-days among those reporting low exposure to whole-body vibration and working with hands at shoulder level or higher, but not among women. However, there were few women who reported high exposure to these work demands, which could affect the results. As found in previous studies, women workers had generally higher numbers of sickness absence days than men. This is in line with previous studies which have found higher risk of disability pensions among women workers [2].
The quantile regression analysis was used to investi-gate the effect of work demands on different lengths of sickness absence. The analysis showed that high or low exposure to the different work demands affect the level of sickness absence mainly on the 90th and 95th per-centile but not on the 99th (except for exposure to fre-quent rotations). This can be interpreted to mean that exposure to work demands is linked to sickness absence for shorter but not long-term sickness absence. A previ-ous study divided sickness absence into three time pe-riods, early (≤14 days), medium–late (15–90 days) and late (≥90 days) for return to work, using the same data source on registered sickness absence as in this study [33]. If applied to this study, exposure to several work demands affects sickness absence for short (early) and medium long (medium–late) periods, but only one work demand (frequent rotations) affects longer (late) periods of sickness absence. This analysis also shows the differ-ence in numbers of sickness absdiffer-ence days; for instance, the group that reported low exposure to heavy lifting had 39 fewer days compared to the high exposure on the 95th percentile. The group having high control over their work had 43 fewer days of sickness absence than the group with low control.
Strengths, limitations and methodological considerations
[image:6.595.57.290.122.456.2]This study has several strengths. It is prospective, it is based on a representative sample of the Swedish working population and it includes sickness absence from official registries. Some weaknesses of the study include the use of self-reporting by means of telephone interview and questionnaire. As there is no objective measure (except sickness absence), we cannot appraise the seriousness of
Table 6Difference in distribution of one year registered sickness-absence net days (n-days) > 14 days by reporting high or low psychosocial work demand exposure
Work demand exposure Low High
N Mean n-days N Mean n-days P* Demand
All 1619 9 2930 11 0.35 Women 983 9 2032 13 0.07 Men 636 10 898 9 0.10 16–29 years 189 2 333 5 0.30 30–49 years 758 9 1364 11 0.24 50–64 years 672 11 1233 14 0.80 Support
All 2097 11 2452 11 0.29 Women 1294 12 1721 11 0.17 Men 803 9 731 10 0.64 16–29 years 212 6 310 3 0.42 30–49 years 921 10 1201 10 0.45 50–64 years 964 12 941 14 0.95 Control
All 2473 13 2076 8 < 0.01
Women 1787 14 1228 7 < 0.01
Men 686 8 848 10 0.70 16–29 years 320 6 202 2 < 0.05
the disorders or the exact level of exposure to the differ-ent work demands. No measuremdiffer-ents of the intensity of the neck or upper back pain were made. This is a limita-tion in this study, as it is known that intensity of the neck pain is a predictor for long-term sick leave [4]. There are some evidence that multisite pain can have a larger impact on sickness absence than single site pain
Table 7Difference in distribution of one year registered sickness-absence net days (n-days) > 14 days by reporting high or low physical work demand exposure
Work demand exposure Low High
N Mean n-days N Mean n-days P* Lifting≥15 kg
WAS 10 Excellent 1344 6 534 10 < 0.01
WAS 8–9 Good 1038 8 522 12 0.06 WAS 6–7 Moderate 415 14 298 14 0.10 WAS 1–5 Poor 179 36 103 29 0.83 Twisted work posture
WAS 10 Excellent 1423 6 446 9 0.41 WAS 8–9 Good 1173 9 372 13 < 0.01
WAS 6–7 Moderate 469 11 234 17 < 0.05
WAS 1–5 Poor 206 37 72 22 0.43 Handheld vibrating tools
WAS 10 Excellent 1763 7 111 8 0.50 WAS 8–9 Good 1442 9 111 12 0.56 WAS 6–7 Moderate 650 14 59 11 0.19 WAS 1–5 Poor 261 32 19 45 0.63 Leaning forward without support
WAS 10 Excellent 1426 6 444 9 < 0.01
WAS 8–9 Good 1146 8 403 14 < 0.01
WAS 6–7 Moderate 474 13 232 15 0.16 WAS 1–5 Poor 193 33 88 32 0.87 Hands at shoulder level or higher
WAS 10 Excellent 1607 7 265 7 0.40 WAS 8–9 Good 1315 10 237 10 0.18 WAS 6–7 Moderate 562 16 143 10 0.19 WAS 1–5 Poor 218 33 63 33 0.84 Whole-body vibration
WAS 10 Excellent 1776 7 99 11 0.29 WAS 8–9 Good 1451 9 105 17 0.43 WAS 6–7 Moderate 656 14 55 11 0.93 WAS 1–5 Poor 267 30 13 94 0.31 Frequent trunk rotations
WAS 10 Excellent 1057 5 817 9 < 0.05
WAS 8–9 Good 797 8 760 11 0.08 WAS 6–7 Moderate 312 10 397 16 0.07 WAS 1–5 Poor 111 33 170 33 0.90 Repetitive movements
WAS 10 Excellent 1241 7 621 6 0.42 WAS 8–9 Good 988 8 559 10 0.41 WAS 6–7 Moderate 421 13 282 14 0.53 WAS 1–5 Poor 162 31 117 36 0.20
Table 8Difference in one year registered sickness-absence net days (n-days) > 14 days by reporting high or low psychosocial work demand exposure
Work demand exposure Low High
N Mean N-days N Mean n-days P* Support
WAS 10 Excellent 798 5 1084 8 0.84 WAS 8–9 Good 716 9 847 9 0.69 WAS 6–7 Moderate 389 15 324 13 0.72 WAS 1–5 Poor 149 34 133 32 0.85 Demand
WAS 10 Excellent 638 6 1244 7 0.37 WAS 8–9 Good 563 9 1000 10 0.87 WAS 6–7 Moderate 267 10 446 16 0.23 WAS 1–5 Poor 114 28 168 36 0.25 Control
WAS 10 Excellent 982 8 900 6 0.35 WAS 8–9 Good 862 11 701 8 < 0.05
[image:7.595.281.536.439.690.2]WAS 6–7 Moderate 418 16 295 11 0.05 WAS 1–5 Poor 148 42 134 22 < 0.05 Four thousand five hundred sixty-seven workers with self-reported neck or upper back pain by Work Ability Score (WAS).Pvalues indicate the difference indistributionof sick days between reporting high or low exposure. Wilcoxon Rank Sum Test * = two tailed; bold numbers indicate a statistically significant difference. N = number of workers
Table 7Difference in distribution of one year registered sickness-absence net days (n-days) > 14 days by reporting high or low physical work demand exposure(Continued)
Work demand exposure Low High
N Mean n-days N Mean n-days P* Seated work
WAS 10 Excellent 712 9 1159 5 < 0.01
WAS 8–9 Good 688 12 872 7 < 0.01
WAS 6–7 Moderate 367 13 343 14 0.82 WAS 1–5 Poor 154 26 125 42 0.18
[34]. In this study we have only included workers who reported neck or upper back pain and we do not know if they also have pain in other body sites. We also had no information about other confounders, including socio-demographic or individual factors such as self-efficacy, which also are known factors that influence sickness ab-sence [35]. The registry measure of sickness abab-sence from the LISA registry covers all causes of sickness ab-sence, and in this study, we cannot distinguish between different causes. A methodological aspect of this study is that it took place in Sweden. Very few studies of sickness absence have investigated whether the national context plays a role in the results [36].
Conclusions
The findings in this study suggest that certain physical work demands and having high control over one’s work can re-sult in lower sickness absence, especially among middle-aged and older workers with neck or upper back pain.
Abbreviations
LISA:Longitudinal integration database for health insurance and labour market studies; MONA: Microdata online access; N-days: Net days; SCB: Statistics Sweden; WAI: Work ability index; WAS: Work ability score
Acknowledgements Not applicable.
Authors’contributions
SO, AN, HS and MH designed the study. AN and SO performed the data analysis, and MH contributed to the data interpretation. MH, HS and EG supervised the project. SO wrote the manuscript and AN, HS, EG and MH made contributions to its final form. All authors have read and approved of the manuscript.
Funding
This study was partly funded by Swedish Research Council for Health, Working Life and Welfare. The funding body have not been involved in the design, data collection, analysis, interpretation or the writing of the manuscript.
Availability of data and materials
The data used for this study is available through Statistics Sweden.
Ethics approval and consent to participate
This study received approval from the Regional Ethics Review Board in Gothenburg, Sweden (2015-04-16 Dnr. 221–15). Consent to participate were given in the Work Environment Survey.
Competing interests
The authors declare that they have no competing interests.
Received: 1 March 2019 Accepted: 23 October 2019
References
1. Fejer R, Kyvik KO, Hartvigsen J. The prevalence of neck pain in the world population: a systematic critical review of the literature. Eur Spine J. 2006; 15(6):834–48.
2. Borg K, Hensing G, Alexanderson K. Predictive factors for disability pension -an 11-year follow up of young persons on sick leave due to neck, shoulder, or back diagnoses. Scand J Public Health. 2001;29(2):104–12.
3. Hoy DG, Protani M, De R, Buchbinder R. The epidemiology of neck pain. Best Pract Res Clin Rheumatol. 2010;24(6):783–92.
4. Holtermann A, Hansen JV, Burr H, Søgaard K. Prognostic factors for long-term sickness absence among employees with neck-shoulder and low-back pain. Scand J Work Environ Health. 2010;36(1):34–41.
5. Andersen JH, Kaergaard A, Mikkelsen S, Jensen UF, Frost P, Bonde JP, et al. Risk factors in the onset of neck/shoulder pain in a prospective study of workers in industrial and service companies. Occup Environ Med. 2003;60(9):649–54. 6. Ariens GA, van Mechelen W, Bongers PM, Bouter LM, van der Wal G.
Psychosocial risk factors for neck pain: a systematic review. Am J Ind Med. 2001;39(2):180–93.
7. McLean SM, May S, Klaber-Moffett J, Sharp DM, Gardiner E. Risk factors for the onset of non-specific neck pain: a systematic review. J Epidemiol Community Health. 2010;64(7):565–72.
8. Palmer KT, Smedley J. Work relatedness of chronic neck pain with physical findings--a systematic review. Scand J Work Environ Health. 2007;33(3):165–91. 9. Ariens GA, Bongers PM, Hoogendoorn WE, van der Wal G, van Mechelen W. High physical and psychosocial load at work and sickness absence due to neck pain. Scand J Work Environ Health. 2002;28(4):222–31.
10. Alavinia SM, Molenaar D, Burdorf A. Productivity loss in the workforce: associations with health, work demands, and individual characteristics. Am J Ind Med. 2009;52(1):49–56.
11. Leijten FRM, van den Heuvel SG, Ybema JF, van der Beek AJ, Robroek SJW, Burdorf A. The influence of chronic health problems on work ability and productivity at work: a longitudinal study among older employees. Scand J Work Environ Health. 2014;40(5):473–82.
12. Tsai SP, Bhojani FA, Wendt JK. Risk factors for illness absence due to musculoskeletal disorders in a 4-year prospective study of a petroleum-manufacturing population. J Occup Environ Med. 2011;53(4):434–40. 13. Gould RIJ, Järvisalo J, Koskinen S. Dimensions of work ability: results of the
Health 2000 Survey. Helsinki: Finnish Centre of Pensions (ETK), The Social Insurance Institution (KELA), National Public Health Institute (KTL), and Finnish Institute of Occupational Health (FIOH); 2008. p. 185.
14. Strazdins L, Bammer G. Women, work and musculoskeletal health. Soc Sci Med. 2004;58(6):997–1005.
15. Cote P, van der Velde G, Cassidy JD, Carroll LJ, Hogg-Johnson S, Holm LW, et al. The burden and determinants of neck pain in workers: results of the bone and joint decade 2000-2010 task force on neck pain and its associated disorders. J Manipulative Physiol Ther. 2009;32(2 Suppl):S70–86. 16. Skillgate E, Magnusson C, Lundberg M, Hallqvist J. The age- and sex-specific
occurrence of bothersome neck pain in the general population--results from the Stockholm public health cohort. BMC Musculoskelet Disord. 2012;13:185. 17. Hoy D, March L, Woolf A, Blyth F, Brooks P, Smith E, et al. The global burden
of neck pain: estimates from the global burden of disease 2010 study. Ann Rheum Dis. 2014;73(7):1309–15.
18. Cote P, van der Velde G, Cassidy JD, Carroll LJ, Hogg-Johnson S, Holm LW, et al. The burden and determinants of neck pain in workers: results of the bone and joint decade 2000-2010 task force on neck pain and its associated disorders. Spine (Phila Pa 1976). 2008;33(4 Suppl):S60–74. 19. Haldeman S, Carroll L, Cassidy JD. Findings from the bone and joint decade
2000 to 2010 task force on neck pain and its associated disorders. J Occup Environ Med. 2010;52(4):424–7.
20. Oliv S, Noor A, Gustafsson E, Hagberg M. A Lower Level of Physically Demanding Work Is Associated with Excellent Work Ability in Men and Women with Neck Pain in Different Age Groups. Safety and Health at Work. 2017;8(4):356-63.
21. De Vries HJ, Reneman MF, Groothoff JW, Geertzen JHB, Brouwer S. Self-reported work ability and work performance in workers with chronic nonspecific musculoskeletal pain. J Occup Rehabil. 2013;23(1):1–10. 22. Langley P, Mller-Schwefe G, Nicolaou A, Liedgens H, Pergolizzi J, Varrassi G.
The impact of pain on labor force participation, absenteeism and presenteeism in the European Union. J Med Econ. 2010;13(4):662–72. 23. Roelen CAM, Heymans MW, Twisk JWR, van der Klink JJL, Groothoff JW, van
Rhenen W. Work Ability Index as Tool to Identify Workers at Risk of Premature Work Exit. Journal of Occupational Rehabilitation. 2014;24(4):747-54. 24. Ahlstrom L, Grimby-Ekman A, Hagberg M, Dellve L. The work ability index
and single-item question: associations with sick leave, symptoms, and health - a prospective study of women on long-term sick leave. Scand J Work Environ Health. 2010;36(5):404–12.
26. El Fassi M, Bocquet V, Majery N, Lair ML, Couffignal S, Mairiaux P. Work ability assessment in a worker population: comparison and determinants of work ability index and work ability score. BMC Public Health. 2013;13(1):305. 27. Oliv S, Gustafsson E, Baloch AN, Hagberg M, Sanden H. Workplace
interventions can reduce sickness absence for persons with work-related neck and upper extremity disorders: a one-year prospective cohort study. J Occup Environ Med. 2019;61:559–64.
28. Miranda H, Kaila-Kangas L, Heliövaara M, Leino-Arjas P, Haukka E, Liira J, et al. Musculoskeletal pain at multiple sites and its effects on work ability in a general working population. Occup Environ Med. 2010;67(7):449–55. 29. Wilcoxon F. Individual comparisons by ranking methods. Biometrics. 1945;
1(6):80–3.
30. Koenker R. Reference: Quantile Regression. New York: Cambridge University Press; 2005.
31. Taimela S, Läärä E, Malmivaara A, Tiekso J, Sintonen H, Justén S, et al. Self-reported health problems and sickness absence in different age groups predominantly engaged in physical work. Occup Environ Med. 2007;64(11): 739–46.
32. Götz S, Hoven H, Müller A, Dragano N, Wahrendorf M. Age differences in the association between stressful work and sickness absence among full-time employed workers: evidence from the German socio-economic panel. Int Arch Occup Environ Health. 2018;91(4):479–96.
33. Hensing G, Bertilsson M, Ahlborg G, Waern M, Vaez M. Self-assessed mental health problems and work capacity as determinants of return to work: a prospective general population-based study of individuals with all-cause sickness absence. BMC Psychiatry. 2013;13(1):259.
34. de Fernandes RCP, Burdorf A. Associations of multisite pain with healthcare utilization, sickness absence and restrictions at work. Int Arch Occup Environ Health. 2016;89(7):1039–46.
35. Lund T, Labriola M. Sickness absence in Denmark- research, results, and reflections. Scan J Work Environ Health Suppl. 2009;7(7):5–14.
36. Schuring M, Burdorf L, Kunst A, Mackenbach J. The effects of ill health on entering and maintaining paid employment: evidence in European countries. J Epidemiol Community Health. 2007;61(7):597–604.
Publisher’s Note