R E S E A R C H A R T I C L E
Open Access
Investigating differences in trunk muscle
activity in non-specific chronic low back
pain subgroups and no-low back pain
controls during functional tasks: a
case-control study
Rebecca Hemming
1*, Liba Sheeran
1, Robert van Deursen
2and Valerie Sparkes
1Abstract
Background:Trunk muscle dysfunction is often regarded as a key feature of non-specific chronic low back pain (NSCLBP) despite being poorly understood and variable with increases, decreases and no change in muscle activity reported. Differences in thoraco-lumbar kinematics have been observed in motor control impairment NSCLBP subgroups (Flexion Pattern, Active Extension Pattern) during static postures and dynamic activities. However, potential differences in muscle activity during functional tasks has not been established in these subgroups to date. Methods:A case-control study design recruited 50 NSCLBP subjects (27 Flexion Pattern, 23 Active Extension Pattern) and 28 healthy individuals. Surface electromyography determined muscle activity during functional tasks: reaching upwards, step-down, step-up, lifting and replacing a box, stand-to-sit, sit-to-stand, bending to retrieve (and returning from retrieving) a pen from the floor. Normalised (% sub-maximal voluntary contraction) mean amplitude electromyography of bilateral musculature (transversus abdominis/internal oblique, external oblique, superficial lumbar multifidus and longissimus thoracis) was analysed using Kruskal-Wallis and post-hoc Mann-Whitney U tests. Results:Transversus abdominis/internal oblique activity was significantly increased in the Flexion Pattern group compared to controls during stand-to-sit (p= 0.009) on the left side only. External oblique activity was significantly greater in the Active Extension Pattern group compared to controls during box lift (p= 0.016) on the right side only. Significantly greater activity was identified in the right Superficial lumbar multifidus during step up (p= 0.029), reach up (p= 0.013) and box replace (p= 0.007) in the Active Extension Pattern group compared to controls. However left-sided superficial lumbar multifidus activity was significantly greater in the Flexion Pattern group (compared to controls) only during stand-to-sit (p= 0.009). No significant differences were observed in longissimus thoracis activity bilaterally during any task. No significant differences between NSCLBP subgroups were observed. Conclusions:Muscle activity in these NSCLBP subgroups appears to be highly variable during functional tasks with no clear pattern of activity identified. The findings reflect inconsistencies and variability in trunk muscle activity previously observed in these NSCLBP subgroups. Further work evaluating ratios of muscle activity and changes in muscle activity throughout task duration is warranted.
Keywords:Non-specific chronic low back pain, NSCLBP, Muscle activity, Trunk, Functional movement
© The Author(s). 2019Open AccessThis article is distributed under the terms of the Creative Commons Attribution 4.0 International License (http://creativecommons.org/licenses/by/4.0/), which permits unrestricted use, distribution, and reproduction in any medium, provided you give appropriate credit to the original author(s) and the source, provide a link to the Creative Commons license, and indicate if changes were made. The Creative Commons Public Domain Dedication waiver (http://creativecommons.org/publicdomain/zero/1.0/) applies to the data made available in this article, unless otherwise stated.
* Correspondence:[email protected]
1Arthritis Research UK Biomechanics and Bioengineering Centre, School of
Healthcare Sciences, Cardiff University, 13.20 Eastgate House, 35-43 Newport Road, Cardiff, Wales CF24 0AB, UK
Background
Non-specific chronic low back pain (NSCLBP) is highly complex with a multitude of physical, cognitive and life-style factors contributing to the disorder. Often the dominant driver for pain may be linked to movement and posture behaviour indicating a mechanical basis for the disorder [1]. People with NSCLBP have been found to demonstrate differences in temporal and spatial pa-rameters of trunk muscle activity, although the nature of these differences is poorly understood with substantial variability reported [2,3].
This variability may be due to lack of definition of homogeneous NSCLBP subgroups; therefore, identifying specific NSCLBP subgroups using validated subclassifica-tion approaches is paramount [4]. One such multidimen-sional classification system (MDCS) which categorises the disorder into movement impairment and/or motor con-trol impairment (MCI) subgroups has been proposed [1]. Patients within these subgroups display high levels of fear-avoidance, and adopt subgroup-specific maladaptive pos-tures and movement strategies, potentially exacerbating the disorder [5–7]. It is proposed that NSCLBP individuals with flexion pattern MCI (FP) demonstrate an inability to activate lumbar multifidus (LM), reporting pain during flexion biased activities, whereas extension pattern MCI (AEP) individuals may present with hyperextended lower lumbar postures with dominant erector spinae and LM activity to actively‘hold’themselves in lumbar hyperexten-sion and report pain during more extended/upright) acti-vitiesO’Sullivan [1].
Previous work evaluating trunk muscle activity in MDCS subgroups in sitting demonstrated AEP individuals having spinal musculature hyperactivity compared to healthy and FP groups [6,7]. Similarly, increased abdominal muscle ac-tivity (EO and TrIO) in FP and AEP subgroups, compared with healthy individuals, during repositioning tasks in sit-ting and standing is reported [8].
This suggests that muscle hyperactivity is prevalent in the presence of pain, but differences in muscle activ-ity between NSCLBP subgroups may not be sufficient to provide a rationale for differential diagnosis. Rea-sons for this may be due to static postures not being sufficiently challenging for the trunk muscles. We hy-pothesise that different subgroups of NSCLBP would accomplish more challenging functional tasks differ-ently. To date this hypothesis has not been tested in functional tasks which could be considered more rele-vant than static postures.
This study investigated trunk muscle activity in sub-groups of NSCLBP patients and healthy individuals dur-ing functional tasks, to identify whether differences in muscle activity are task dependent or whether a consist-ent pattern of muscle activity is idconsist-entified irrespective of task performed.
This will inform an understanding of subgroup trunk muscle dysfunction, which may influence spinal loading and pain [6, 7], thus enabling refinement of motor con-trol approaches for specific subgroups of NSCLBP pa-tients [9].
The hypothesis for this case-control study is that dif-ferences in trunk muscle activity between NSCLBP sub-groups and healthy individuals will be observed during a series of functional tasks reflecting a range of flexion-dominant and extension-flexion-dominant trunk motions.
Methods
NSCLBP patients were recruited from physiotherapy waiting lists in Cardiff and Vale University Health Board, Cardiff, UK. Fifty NSCLBP and 28 healthy individuals volunteered. Sample size calculation is reported else-where [10]. Power set at priori at 0.7, alpha level of 0.05, a sample of 24 subjects per group was calculated.
Inclusion and exclusion criteria for NSCLBP and healthy individuals are outlined in Tables 1 and 2. NSCLBP subjects were classified independently by two physiotherapists (RH, LS) based on MDCS criteria [1]. Only subjects classified as FP or AEP (both clinicians in agreement) were included. To establish NSCLBP classifi-cation a comprehensive subjective and objective assess-ment was conducted. Full assessassess-ment procedures are published elsewhere [1,11]. Gender, age, anthropometric data (weight, height) were collected. Patient reported measures for pain (Visual Analogue Scale (VAS)) [12], disability (Oswestry Disability Questionnaire (ODQ)) [13], psychological distress (Distress and Risk Assess-ment Method (DRAM)) [14] and fear of movement (Tampa Scale of Kinesiophobia (TSK)) [15] evaluated baseline characteristics. Data collection was conducted at the Research Centre for Clinical Kinesiology, Cardiff University.
Data collection
Surface Electromyography (sEMG) data was collected through an 8 Channel Bortec EMG system (Octopus Cable Telemetric System, Bortec Electronics Inc., Calgary, Canada), synced with Vicon® Nexus software (Nexus 1.8.2 Vicon Motion Systems, Oxford, UK). sEMG has been shown to be a reliable tool in the assessment of paraspinal muscle in both healthy in-dividuals and LBP patients [16]. The sEMG battery pack was linked to the main amplifier through a sin-gle fixed fibre-optic cable. Snap electrode leads were attached to each electrode [17].
conductive areas and 2 cm inter-electrode distance were placed parallel to the muscle fibres of superficial Lumbar Multifidus (sLM), Longissimus Thoracis (LT), Transver-sus Abdominis/Internal Oblique (TrA/IO) and External Oblique (EO) muscles bilaterally, as per SENIAM guide-lines [18]. An earth electrode was placed over the left iliac crest. All electrode placement was conducted by an experienced musculoskeletal physiotherapist.
Differential pre-amplifiers with fixed gain of 500, input impedance of 1OGOhm, common rejection ratio set at 115 dB and a sampling frequency of 10 Hz to 1000 Hz were used [8, 17]. Visual inspection of the sEMG data was conducted via an oscilloscope view within Vicon®.
sEMG data was normalised to sub-maximal voluntary contractions (SMVC). A crook-lying double leg raise was used to achieve SMVC of the abdominal muscles and a prone lying double knee lift for the LT and sLM muscles [17]. Three SMVCs were recorded over 3 s with a 30 s rest between trials [17].
Nine functional tasks were evaluated (reach up, sitting-to-standing, standing-to-sitting, step up, step down, box lift, box replace, bending to retrieve and returning from retrieving a pen from the floor). These reflected a range of functional activities and a selection of flexion-related (e.g. bend to retrieve) and extension-related (e.g. reaching up-wards) tasks to potentially stress the direction of pain provocation hypothesised to be present in each MCI. Each task was repeated and recorded three times which is re-flective of previous study protocols identifying regional spinal differences in back pain populations in functional activities [20–22].
Data processing and analysis
Raw signals were full-wave rectified and band pass fil-tered (zero phase lag, 20 Hz cut-off frequency) using 2nd order, bidirectional Butterworth filter resulting in a lin-ear envelope for each channel [18] using a custom-developed MATLAB routine. The signal was amplified further by a gain of 2000 using a 20 Hz high pass filter to suppress any potential movement artefacts. Data was visually inspected through graphical representation in MATLAB (version R2013a). Mean amplitude sEMG was calculated for the duration of the functional task (see supplementary material for details). The start and end of each task were established through synchronisation with kinematic data collected using a Vicon® motion analysis system (details published elsewhere) [10]. Where any anomalies in the data were apparent, the raw sEMG was identified and omitted from final data analysis. Data were exported to Excel and imported into SPSS for analysis (version 20.0, IBM Corp, Armonk, NY, USA). Normalised amplitude sEMG (%) was calculated as: (processed sEMG / SMVC)*100 across each functional task.
Full details of the electrode placement, SMVC proce-dures, standardisations for task performance and sec-tions of the tasks used for sEMG analysis are included in an additional file (see Additional file1).
Statistical analysis
[image:3.595.59.530.99.216.2]Statistical analysis were performed according to normal distribution and homogeneity of variance of the %SMVC data [23]. Differences in demographic characteristics and
Table 1Inclusion and exclusion criteria for the non-specific chronic low back pain (NSCLBP) group
Inclusion criteria for the NSCLBP group Exclusion criteria for the NSCLBP group
•Aged 18–65 years
•History of chronic LBP (> 12 weeks)
•Pain in the lumbar and/or buttock region (defined as pain reported
below the level of T12 and no lower than the buttock line)
•Clear mechanical basis of the disorder aligned with specific aggravating
and easing postures and movements, with distinct symptom relief observed during movement conducted in the opposing direction of reported pain provocation (assessed subjectively and objectively)
•Clinical diagnosis of specific MCI - either FP or AEP
•Signs of serious spinal pathology (Red flags) including significant
trauma, unexplained weight loss and widespread neurologic changes
•Any vestibular, visual or neurological dysfunction affecting balance
•Current radiating symptoms (and/or neurological deficit) below the
level of the buttock crease
•Current pregnancy or breastfeeding
•History of spinal surgery, fracture or malignancy
•Inability to perform any of the functional tasks unaided
•Inability to read written English language documents and follow verbal
instructions in English
•Not fulfilling the inclusion criteria
Table 2Inclusion and exclusion criteria for the healthy group
Inclusion criteria for the healthy group Exclusion criteria for the healthy group
•Aged 18–65 years •History of LBP or any lower limb pain in the last 2 years
•Any vestibular, visual or neurological dysfunction affecting balance
•Current pregnancy or breastfeeding
•History of spinal surgery, fracture or malignancy
•Previous LBP with symptoms radiating below the level of the buttocks
•Inability to complete the tasks required
[image:3.595.53.541.651.732.2]questionnaires between FP, AEP and healthy groups were determined using: one-way ANOVA with post-hoc comparisons (Bonferroni) for age and height; independ-ent samples Kruskal-Wallis for mass and BMI and Chi2 for gender. ODQ and TSK scores were summed and av-eraged across each group to be regarded as interval-ratio data (rather than being expressed as categorical variables based upon severity e.g. mild, moderate etc). Independ-ent t-tests were therefore used to analyse ODQ, VAS and TSK scores; and Mann-Whitney U for DRAM. Ana-lyses were performed independently for left and right sides because the tasks were asymmetrical. The alpha level was set at 0.05 [23]. %SMVC data was not normally distributed therefore Kruskal-Wallis tests were used. Where differences (p < 0.05) were observed Mann-Whitney U tests established pairwise differences between groups (AEP, FP and healthy). To reduce the risk of attaining type 1 errors using multiple Mann-Whitney U tests, a Bonferroni correction was applied and the post hoc significance level set to 0.0167 [23].
Results
Fifty NSCLBP subjects (23 AEP, 27 FP) and 28 healthy individuals data were analysed. One FP participant failed to complete the patient reported measures. Demo-graphic data is in Table3. Of note significant differences were observed between groups for gender (AEP 82.6% female, FP 17.4% female). The FP group were signifi-cantly heavier (compared to AEP) and taller (compared to AEP and healthy), although BMI was comparable across groups. Participants were matched across groups for age. Back pain location was similar between NSCLBP groups with most subjects reporting central or right-sided symptoms at the time of testing.
No significant differences between AEP and FP groups in ODQ, VAS, and TSK were revealed. DRAM scores re-vealed the AEP group displayed significantly greater psy-chological distress (depressive and somatic distress combined) scores compared to FP (Table3).
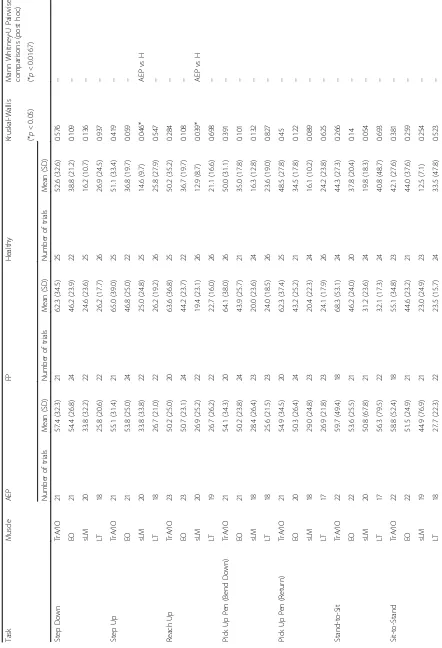
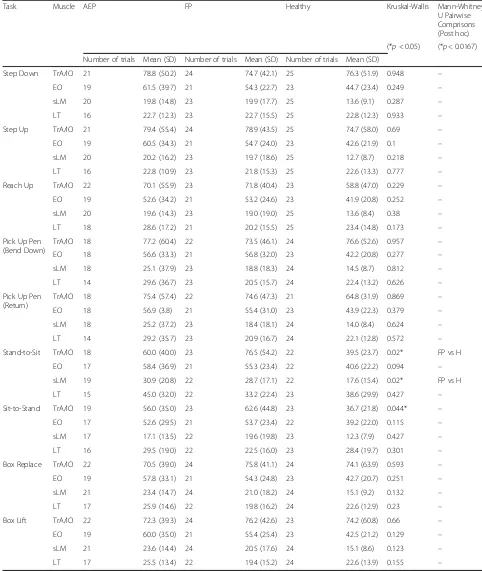
The statistical analysis for the functional tasks are shown in Tables 4 and 5. No significant between group (AEP, FP, Healthy) differences in all muscles were ob-served during step down, bending to pick up a pen, returning from picking up a pen or sit-to-stand func-tional tasks. No significant differences were observed be-tween the groups (AEP, FP, Healthy) in the LT muscles during any functional task. Compared to healthy, the AEP group showed significantly greater right-sided sLM activation during step up (p = 0.015), reach up (p = 0.013) and box replace (p= 0.007) tasks. Right EO activ-ity was significantly greater in the AEP group compared to the healthy group during the box lift (p= 0.016) task. Left-sided sLM (p= 0.009) and TrA/IO (p= 0.009) were
found to be significantly greater during stand-to-sit in FP compared to the healthy group.
There was a statistically significant difference overall between the groups (AEP, FP, Healthy) during sit-to-stand in the left TrA/IO (p = 0.044, p < 0.05) however post-hoc testing revealed no significant pairwise between group differences (AEP vs. healthy p = 0.056, FP vs. healthyp= 0.023).
Discussion
The purpose of this study was to identify whether differ-ences in muscle activity are task dependent or whether phe-notypes of muscle activity can be identified for NSCLBP subgroups irrespective of task performed. Overall, different patterns of muscle activity between tasks and subgroups were observed suggesting potentially individualised trunk muscle responses.
For the AEP group the only differences in muscle activ-ity was when compared with healthy individuals in the right-sided sLM muscles during step up, reach up and box replace tasks (p< 0.0167) and in the right EO muscle dur-ing the box lift task. For the FP group the only significant differences observed were in the left TrA/IO and sLM muscles during the stand-to-sit task. For all these compar-isons muscle activity was greater comparatively in the NSCLBP group compared to the healthy group. For the majority of tasks no significant between group differences in muscle activity were observed. Due to the number of comparisons tested, interpretation of the significant re-sults should be viewed cautiously.
The increased muscle activity demonstrated in the FP compared to the healthy group in the left TrA/IO and sLM during the stand-to-sit activity is less clearly under-stood. Since no other tasks demonstrated increased TrA/IO activity it is unclear as to whether TrA/IO activ-ity may actually differ between these subgroups. With no consistency in muscle activation between groups noted bilaterally, this further supports the reported in-herent wide individual variation in muscle activity [26].
No significant differences were observed between the AEP and FP groups for any muscle group or functional task. Generally the NSCLBP subgroups demonstrated
greater muscle activation in each muscle group (com-pared to the healthy subjects), indicating that co-contraction may be a factor for individuals in pain. Net trunk muscle activity has been previously shown to be increased during the presence of acute pain [26]. This suggests that persistent muscle activation may restrict intervertebral motion as a protective mechanism of the neuromuscular system to increase local spinal stability and thus protect dysfunctional passive spinal structures from pain provocative movement.
[image:5.595.59.537.98.548.2]Consideration must be made that the tasks were not sufficiently flexion biased to challenge the FP individuals,
Table 3Subject baseline characteristics across groups. (Note: Values are mean (SD) unless otherwise stated)
Variable AEP FP Healthy Significance
(n= 23) (n= 27) (n= 28)
Subject Demographics
Gender
Males 4 (17.4%) 21 (77.8%) 12 (42.9%) p< 0.001*
Females 19 (82.6%) 6 (22.2%) 16 (57.1%)
Age (years) 43.7 (11.2) 41.0 (10.0) 38.5 (11.2) p= 0.238
Mass (kg) 68.9 (18.0) 82.5 (14.6) 72.9 (15.2) p= 0.005*
(AEP vs. FP)
Height (cm) 164.9 (10.2) 175.9 (8.7) 169.4 (7.3) p< 0.001*
(AEP vs. FP/FP vs. H)
BMI (kg/m2) 20.8 (4.9) 23.4 (3.5) 21.5 (4.1)
p= 0.127
Pain
Site of Back Pain N(%)
Right 8 (34.8%) 5 (18.5%) – –
Left 2 (8.7%) 3 (11.1%)
Central 13 (56.4%) 19 (70.4%)
Time Since Pain Onset N(%)
3–6 months 2 (8.7%) 8 (29.6%) – –
6–12 months 7 (30.4%) 2 (7.4%) – –
1–2 years 1 (4.3%) 3 (11.1%) – –
2–3 years 0 (0%) 1 (3.7%) – –
3–4 years 2 (8.7%) 2 (7.4%) – –
4–5 years 3 (13%) 3 (11.1%) – –
5–10 years 3 (13%) 4 (14.8%) – –
10+ years 5 (21.7%) 4 (14.8%) – –
Patient Reported Measures
AEP FP
(n= 23) (n= 26)
ODQ 22.5 (11.6) 21.6 (10.0) – p= 0.773
DRAM 29.8 (12.5) 22.7 (10.9) – p = 0.027*
VAS 4.6 (1.4) 4.5 (1.4) – p= 0.986
TSK 37.5 (6.8) 37.6 (5.3) – p= 0.993
Key: FP = Flexion pattern motor control impairment, AEP = Active extension pattern motor control impairment, H = Healthy, BMI = Body Mass Index (mass (kg)/ height (m)2
Table 5Results for normalised (%SMVC) amplitude EMG of the left musculature during functional tasks
Task Muscle AEP FP Healthy Kruskal-Wallis Mann-Whitney
U Pairwise Comprisons (Post hoc)
(*p< 0.05) (*p< 0.0167)
Number of trials Mean (SD) Number of trials Mean (SD) Number of trials Mean (SD)
Step Down TrA/IO 21 78.8 (50.2) 24 74.7 (42.1) 25 76.3 (51.9) 0.948 –
EO 19 61.5 (39.7) 21 54.3 (22.7) 23 44.7 (23.4) 0.249 –
sLM 20 19.8 (14.8) 23 19.9 (17.7) 25 13.6 (9.1) 0.287 –
LT 16 22.7 (12.3) 23 22.7 (15.5) 25 22.8 (12.3) 0.933 –
Step Up TrA/IO 21 79.4 (55.4) 24 78.9 (43.5) 25 74.7 (58.0) 0.69 –
EO 19 60.5 (34.3) 21 54.7 (24.0) 23 42.6 (21.9) 0.1 –
sLM 20 20.2 (16.2) 23 19.7 (18.6) 25 12.7 (8.7) 0.218 –
LT 16 22.8 (10.9) 23 21.8 (15.3) 25 22.6 (13.3) 0.777 –
Reach Up TrA/IO 22 70.1 (55.9) 23 71.8 (40.4) 23 58.8 (47.0) 0.229 –
EO 19 52.6 (34.2) 21 53.2 (24.6) 23 41.9 (20.8) 0.252 –
sLM 20 19.6 (14.3) 23 19.0 (19.0) 25 13.6 (8.4) 0.38 –
LT 18 28.6 (17.2) 21 20.2 (15.5) 25 23.4 (14.8) 0.173 –
Pick Up Pen (Bend Down)
TrA/IO 18 77.2 (60.4) 22 73.5 (46.1) 24 76.6 (52.6) 0.957 –
EO 18 56.6 (33.3) 21 56.8 (32.0) 23 42.2 (20.8) 0.277 –
sLM 18 25.1 (37.9) 23 18.8 (18.3) 24 14.5 (8.7) 0.812 –
LT 14 29.6 (36.7) 23 20.5 (15.7) 24 22.4 (13.2) 0.626 –
Pick Up Pen (Return)
TrA/IO 18 75.4 (57.4) 22 74.6 (47.3) 21 64.8 (31.9) 0.869 –
EO 18 56.9 (3.8) 21 55.4 (31.0) 23 43.9 (22.3) 0.379 –
sLM 18 25.2 (37.2) 23 18.4 (18.1) 24 14.0 (8.4) 0.624 –
LT 14 29.2 (35.7) 23 20.9 (16.7) 24 22.1 (12.8) 0.572 –
Stand-to-Sit TrA/IO 18 60.0 (40.0) 23 76.5 (54.2) 22 39.5 (23.7) 0.02* FP vs H
EO 17 58.4 (36.9) 21 55.3 (23.4) 22 40.6 (22.2) 0.094 –
sLM 19 30.9 (20.8) 22 28.7 (17.1) 22 17.6 (15.4) 0.02* FP vs H
LT 15 45.0 (32.0) 22 33.2 (22.4) 23 38.6 (29.9) 0.427 –
Sit-to-Stand TrA/IO 19 56.0 (35.0) 23 62.6 (44.8) 23 36.7 (21.8) 0.044* –
EO 17 52.6 (29.5) 21 53.7 (23.4) 22 39.2 (22.0) 0.115 –
sLM 17 17.1 (13.5) 22 19.6 (19.8) 23 12.3 (7.9) 0.427 –
LT 16 29.5 (19.0) 22 22.5 (16.0) 23 28.4 (19.7) 0.301 –
Box Replace TrA/IO 22 70.5 (39.0) 24 75.8 (41.1) 24 74.1 (63.9) 0.593 –
EO 19 57.8 (33.1) 21 54.3 (24.8) 23 42.7 (20.7) 0.251 –
sLM 21 23.4 (14.7) 24 21.0 (18.2) 24 15.1 (9.2) 0.132 –
LT 17 25.9 (14.6) 22 19.8 (16.2) 24 22.6 (12.9) 0.23 –
Box Lift TrA/IO 22 72.3 (39.3) 24 76.2 (42.6) 23 74.2 (60.8) 0.66 –
EO 19 60.0 (35.0) 21 55.4 (25.4) 23 42.5 (21.2) 0.129 –
sLM 21 23.6 (14.4) 24 20.5 (17.6) 24 15.1 (8.6) 0.123 –
LT 17 25.5 (13.4) 22 19.4 (15.2) 24 22.6 (13.9) 0.155 –
and nor sufficiently extension biased to challenge the AEP individuals. Additionally, some functional tasks were asymmetrical, (e.g. the box replace task (see Additional file1)) where the lifting component utilised right trunk rotation). Previous work has demonstrated regional differences in TrA, IO and EO activation during trunk rotation [27] which may have contributed to the unilat-eral significant differences in muscle activity observed. Also functional tasks can be performed utilising differ-ent movemdiffer-ent strategies, thus movemdiffer-ent variability will be greater than in sitting [6].
Overall, we report differences in muscle activity in MDCS subgroups concurring with previous literature [6–8]. Increased trunk muscle activity is a key feature in the presence of pain [2, 3], however, the study suggests that muscle activity reflects individual patterns of muscle behaviour in NSCLBP cohorts, as well as the healthy subjects. Identifying potential subgroups based on muscle activation responses remains challenging.
Limitations and future work
Although sEMG is the most commonly used approach for measuring muscle activity in LBP patients [6,17,19], there are many confounding variables including ‘ cross-talk’[19] potentially affecting the data.
Although the gender split is reflective of previous sub-grouped cohorts [5, 28] (FP: 77.8% male, AEP: 82.6% female) gender could have confounded the results. To exclude this, additional analyses were run using an ANOVA with gender considered as a covariate. Overall the findings were unchanged with this secondary analysis.
Normalizing EMG data from individuals exhibiting pain may lead to an unwillingness or inability to perform maximum exertions [29] hence submaximal contractions were utilised. This is an accepted procedure for normal-ising data in painful populations [17, 30]. Future work could however seek to explore alternative approaches to normalising EMG data [29] or comparing raw EMG sig-nals. This study presents preliminary work and future, in-depth, analyses of the data, such as time series of nor-malised EMG, would be beneficial to explore.
Further, with electrode placement at the level of the L5 spinous process for multifidus, EMG recordings may be at risk of being dominated by longissimus and not multifidus activity [31]. Fine wire elecrodes would be re-quired to ensure specificity in future work.
Clinical implications
When considered in conjunction with work evaluating spinal kinematics in MDCS subgroups [10]. this data can inform rehabilitation approaches. Varying maladaptive movement strategies may predominate in different sub-groups (i.e. increased muscle co-activation in AEP; and differences in thoraco-lumbar spinal posture in FP).
Thus, targeted interventions should differ between sub-groups such as postural re-education for FP to reduce excessive kyphosis and mechanisms to reduce trunk ex-tensor muscle hyperactivity for AEP. However spinal kinematics may be a better discriminator than muscle activity for MDCS subgroups. Further work, for example use of fine wire EMG, ratios of muscle activity and muscle activity throughout the functional tasks is re-quired. Further, regional spinal kinematics should be correlated with muscle activity data to establish potential links and treatment targets.
Conclusions
This study demonstrates differing patterns in trunk muscle activity between subgroups during functional tasks, suggesting potentially individualised trunk muscle responses in the presence of pain. The findings show in-consistencies in muscle activity previously observed in MDCS subgroups [6, 8]. When considered alongside work evaluating MDCS subgroups during functional ac-tivity [10] it appears that spinal kinematics may be better at differentiating between clinical (NSCLBP) subgroups, however further work into EMG in NSCLBP subgroups during more demanding functional tasks is warranted to inform targeted interventions for these individuals.
Supplementary information
Supplementary informationaccompanies this paper athttps://doi.org/10. 1186/s12891-019-2843-2.
Additional file 1.Additional Supplementary Material including: Electrode placement; Sub-Maximal Voluntary Contraction Procedures; Functional Task Protocols; and Data Processing of Functional Tasks.
Acknowledgements
Support for the study is acknowledged from Health and Care Research Wales (formerly National Institute of Social, Health and Care (NISCHR) Wales) who provided research officers to support data collection.
Authors’contributions
RH designed the study, conducted all participant recruitment, data collection, analysis and interpretation and was the major contributor to writing the manuscript. LS, RvD and VS all contributed to the research design, analysis, interpretation of the data and writing of the manuscipt. RvD is the author of the MATLAB code to analyse the electromyography data. All authors read and approved the final manuscript.
Funding
Dr. Rebecca Hemming received funding from Arthritis Research UK as part of the Arthritis Research UK Biomechanics and Bioengineering Centre, Cardiff University. Dr. Rebecca Hemming also received funding via a Presidents Scholarship Award, Cardiff University. For the remaining authors no funding was received. The funding bodies had no role in the design of the study, data collection, analysis, interpretation of the data or in writing the manuscript.
Availability of data and materials
Ethics approval and consent to participate
Ethical approval was obtained from The Research Ethics Committee 3 Wales (10/MRE09/28) within the Arthritis Research UK Biomechanics and Bioengineering Centre, Cardiff University, UK. Written informed consent was obtained from all participants.
Consent for publication
The participant, whose images are included in the additional file, provided full written consent for publication.
Competing interests
The authors declare they have no competing interests.
Author details
1Arthritis Research UK Biomechanics and Bioengineering Centre, School of
Healthcare Sciences, Cardiff University, 13.20 Eastgate House, 35-43 Newport
Road, Cardiff, Wales CF24 0AB, UK.2Arthritis Research UK Biomechanics and
Bioengineering Centre, School of Healthcare Sciences, Cardiff University, 2F25A Cardigan House, Heath Campus, Cardiff, Wales CF14 4XN, UK.
Received: 11 December 2018 Accepted: 20 September 2019
References
1. O'Sullivan P. Diagnosis and classification of chronic low back pain disorders:
maladaptive movement and motor control impairments as underlying
mechanism. Man Ther. 2005;10:242–55.
2. Arena JG, Sherman RA, Bruno GM, Young TR. Electromyographic recordings
of low back pain subjects and non-pain controls in six different positions:
effect of pain levels. Pain. 1991;45(1):23–8.
3. Hodges PW, Moseley GL, Gabrielsson A, Gandevia SC. Experimental muscle
pain changes feedforward postural responses of the trunk muscles. Exp
Brain Res. 2003;151(2):262–71.
4. Foster NE, Hill JC, Hay EM. Subgrouping patients with low back pain in
primary care: are we getting any better at it? Man Ther. 2011;16(1):3–8.
https://doi.org/10.1016/j.math.2010.05.013.
5. Dankaerts W, O'Sullivan P, Burnett A, Straker L. Differences in sitting
postures are associated with nonspecific chronic low back pain disorders
when patients are subclassified. Spine. 2006;31:698–704.
6. Dankaerts W, O'Sullivan P, Burnett A, Straker L. Altered patterns of superficial
trunk muscle activation during sitting in nonspecific chronic low back pain
patients: importance of subclassification. Spine. 2006;31(17):2017–23.
https://doi.org/10.1097/01.brs.0000228728.11076.82.
7. O’Sullivan P. Clinical instability of the lumbar spine. In: Boyling JD, Jull GA,
editors. Grieve's modern manual therapy: the vertebral column, 3rd edition. 3rd ed. Amsterdam: Elsevier; 2004.
8. Sheeran L, Sparkes V, Caterson B, Busse-Morris M, van Deursen R. Spinal
position sense and trunk muscle activity during sitting and standing in nonspecific chronic low Back pain: classification analysis. Spine. 2012;37(8):
E486–95.
9. Fersum KV, O'Sullivan P, Skouen JS, Smith A, Kvale A. Efficacy of
classification-based cognitive functional therapy in patients with non-specific chronic low back pain: a randomized controlled trial. Eur J Pain.
2013;17(6):916–28.https://doi.org/10.1002/j.1532-2149.2012.00252.x.
10. Hemming R, Sheeran L, van Deursen R, Sparkes V. Non-specific chronic low
back pain: differences in spinal kinematics in subgroups during functional
tasks. Eur Spine J. 2017.https://doi.org/10.1007/s00586-017-5217-1.
11. O'Sullivan P. Lumbar segmental 'instability': clinical presentation and specific
stabilising exercise management. Man Ther. 2000;5:2–12.
12. Von Korff M, Deyo RA, Cherkin D, Barlow W. Back pain in primary care:
outcomes at 1 year. Spine. 1993;18(7):855–62.
13. Fairbank JC, Couper J, Davies J, O'Brien J. The Oswestry low back pain
disability questionnaire. Physiotherapy. 1980;66:271–3.
14. Main CJ, Wood PL, Hollis S, Spanswick CC, Waddell G. The distress and risk
assessment method. A simple patient classification to identify distress and
evaluate the risk of poor outcome. Spine. 1992;17(1):42–52.
15. Miller RP, Kori SH, Todd DD. The Tampa scale: a measure of Kinesiophobia.
Tampa: FL, Unpublished Report; 1991.
16. Mohseni Bandpei MA, Rahmani N, Majdoleslam B, Abdollahi I, Ali SS, Ahmad
A. Reliability of surface electromyography in the assessment of paraspinal
muscle fatigue: an updated systematic review. J Manip Physiol Ther. 2014;
37(7):510–21.https://doi.org/10.1016/j.jmpt.2014.05.006.
17. Dankaerts W, O'Sullivan PB, Burnett AF, Straker LM, Danneels LA. Reliability
of EMG measurements for trunk muscles during maximal and sub-maximal voluntary isometric contractions in healthy controls and CLBP patients. J
Electromyogr Kinesiol. 2004;14(3):333–42.https://doi.org/10.1016/j.jelekin.
2003.07.001.
18. Freriks B, Hermens HJ (1999) [SENIAM 9]: European recommendations for
surface electromyography: results of the SENIAM project. Roessingh Research and Development b.v.
19. Konrad P. The ABC of EMG: a practical introduction to kinesiological
electromyography. Boston: Noraxon EMG & Sensor Systems; 2005.
20. Mitchell T, O'Sullivan P, Burnett A, Straker L, Smith A. Regional differences in
lumbar spinal posture and the influence of low back pain. BMC Musculoskelet Disord. 2008;9(1):152.
21. Shum GL, Crosbie J, Lee RY. Three-dimensional kinetics of the lumbar spine
and hips in low back pain patients during sit-to-stand and stand-to-sit. Spine.
2007;32(7):E211–9.https://doi.org/10.1097/01.brs.0000259204.05598.10.
22. Shum GL, Crosbie J, Lee RY. Movement coordination of the lumbar spine
and hip during a picking up activity in low back pain subjects. Eur Spine J.
2007;16(6):749–58.https://doi.org/10.1007/s00586-006-0122-z.
23. Field A. Discovering statistics using SPSS: Sage publications; 2009.
24. Kent PM, Keating JL. Can we predict poor recovery from recent-onset
nonspecific low back pain? A systematic review. Man Ther. 2008;13(1):12–28.
https://doi.org/10.1016/j.math.2007.05.009.
25. van der Hulst M, Vollenbroek-Hutten MM, Schreurs KM, Rietman JS,
Hermens HJ. Relationships between coping strategies and lumbar muscle
activity in subjects with chronic low back pain. Eur J Pain. 2010;14(6):640–7.
https://doi.org/10.1016/j.ejpain.2009.10.011.
26. Hodges PW, Coppieters MW, MacDonald D, Cholewicki J. New insight into
motor adaptation to pain revealed by a combination of modelling and
empirical approaches. Eur J Pain. 2013;17(8):1138–46.https://doi.org/10.
1002/j.1532-2149.2013.00286.x.
27. Urquhart DM, Hodges PW. Differential activity of regions of transversus
abdominis during trunk rotation. Eur Spine J. 2005;14(4):393–400.
https://doi.org/10.1007/s00586-004-0799-9.
28. Astfalck RG, O'Sullivan PB, Straker LM, Smith AJ, Burnett A, Caneiro JP,
Dankaerts W. Sitting postures and trunk muscle activity in adolescents with and without nonspecific chronic low back pain: an analysis based on
subclassification. Spine. 2010;35(14):1387–95.
29. Cholewicki J, van Dieen J, Lee AS, Reeves NP. A comparison of a maximum
exertion method and a model-based, sub-maximum exertion method for
normalizing trunk EMG. J Electromyogr Kinesiol. 2011;21(5):767–73.
https://doi.org/10.1016/j.jelekin.2011.05.003.
30. Van Damme B, Stevens V, Perneel C, Van Tiggelen D, Neyens E, Duvigneaud
N, Moerman L, Danneels L. A surface electromyography based objective method to identify patients with nonspecific chronic low back pain, presenting a flexion related movement control impairment. J Electromyogr
Kinesiol. 2014;24(6):954–64.https://doi.org/10.1016/j.jelekin.2014.09.007.
31. Stokes IAF, Henry SM, Single RM (2003) Surface EMG electrodes do not
accurately record from lumbar multifidus muscles. Clinical biomechanics 18
(1):9-13. Doi:https://doi.org/10.1016/S0268-0033(02)00140-7.
Publisher’s Note