KAS PERIODIC TABLE
Khwaja Ahmad Shadab
The Institute of Chartered Financial Analysts of India, Hyderabad
Ex Member, The Indian Science Congress Association, Kolkata
ABSTRACT
KAS Periodic Table remains in the form of simple chart that reproduces and depicts the
nuclear properties of chemical elements. This tool can be used to identify the pattern of
nuclear stability and the nuclear properties of elements. This paper includes the structure
and the development of KAS Periodic Table .This chart depicts not only the trends in
nuclear properties of elements, but also reproduces their numerical values quickly. The
numerical values(produced by this chart)remain very close to the actual values(difference
less than 4%).This paper includes the examples. At a time, you can find the nuclear
properties of almost all the elements on the same chart within few minutes.
There are various Mass Models or theoretical models to predict the nuclear properties of
chemical elements. But these models can not be used in the form of a simple chart that
depicts the location of Neutron Dripline,the zone of Stable / Long-lived isotopes and the
location of Proton Dripline of a chemical element at the same time quickly. Such models
can not be used in the form of a simple device or tool to Identify the nuclear properties of
chemical elements quickly.
Inte rnational Research Journal of Natural and Applied Sciences
ISSN: (2349-4077) Impact Factor- 5.46, Volume 4, Issue 7, July 2017 Website- www.aarf.asia, Email : [email protected] , [email protected]
elements)when the number of neutrons is not given.KAS Periodic Table produces the
results with the help of number of protons of chemical elements. This is a simple tool that
functions as per the empirical relationship. This paper highlights the features of KAS
Periodic Table.
Keywords : Nuclear properties, chart, tool, nuclear stability, neutron dripline, periodic
table.
1.Introduction
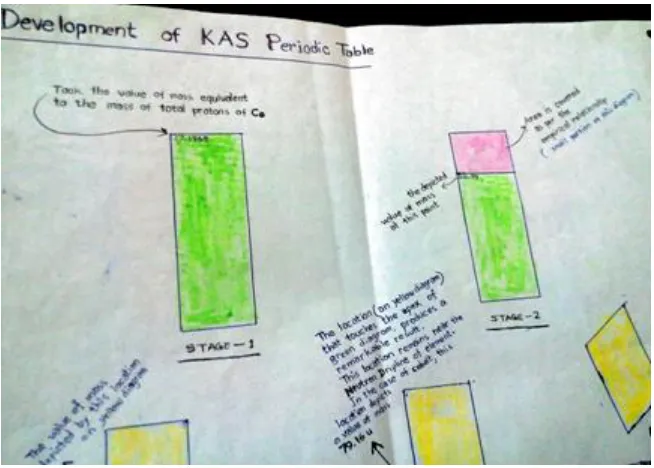
KAS Periodic Table is invented by Khwaja Ahmad Shadab.The development of KAS
Periodic Table took place in different steps.On the basis of experimental data/empirical
evidence, Khwaja Ahmad found an empirical relationship. At first,he found a way(a
method)to determine and predict the mass of stable/long- lived isotope of element with the
help of experimental and evaluated data about mass of protons, atomic mass of
stable/long-lived isotope of chemical element1 and energy levels2 .He considered the metals, non-metals, metalloids, gases ,etc. placed in the Modern Periodic Table3. This method is born from a thorough study of the experimental data ,plotting them in different ways and
looking for interconnections4. The data show a remarkable pattern.
When Khwaja Ahmad prepared a diagram(a SCALE like structure)to show this method
(the method to determine and predict the atomic masses of stable/long- lived isotopes of
chemical elements)in visual form, found other remarkable results. Such finding explored
other empirical relationship. Other properties of chemical elements(depicting the nuclear
properties of elements)are found. He used the different diagrams for making
comparison.When he tried to show this empirical relationship in visual form, a Periodic
Chart like structure came into existence. This chart is registered as KAS Periodic Table5.
Maria Goeppert Mayer4 took the idea from magic numbers/ Shell Model for atomic electrons, and tried to develop the Nuclear Shell Model. The Shell Model for atomic
atomic electrons has more experimental data/empirical evidence in its support than Shell
Model of nucleus. On the basis of these experimental data/empirical evidence, the
empiricists and researchers try to explore other properties of chemical elements.
Structure and design of KAS Periodic Table are based on the empirical relationship. With
the help of a very few numbers of coefficient, a large number of properties(depicting the
nuclear properties of elements) are determined.
The abstract about the first diagram(a SCALE like structure to show the invented method
1(a)The Image of KAS Periodic Table :
When the Fold of Multipliers(of KAS Periodic Table )re mains open, we see the
2. See the Locations to Identify the Nuclear Properties of Che mical Elements
We do not know the number of neutrons, but we are able to reproduce and identify the
following properties of elements with the help of KAS Periodic Table :
See the apex(topmost point) of CS, or the apex of Bar diagram2(covered by CS).
2.To identify the location of Stable or Long- lived isotopes:-
See the Lower side of Multiplier ,or the position of Slider(adjusted according to the
empirical relationship).
3.To identify the location that remains near the Proton Dripline(either S1p= 0,or S2p = 0) of element:-
See below the Lower side of Multiplier, or the adjusted Slider, and identify the location
that remains near the Proton Dripline as per the empirical relationship.
4.To identify the beta decay trend:-
See the location above the Lower side of Multiplier or the adjusted Slider ,and below the
Lower side of Multiplier and the adjusted Slider.
5.To identify which Compound Nuclei are involved in the Hot Fusion reaction, and which
Compound Nuclei are involved in the Cold Fusion reaction:-
In the case of superheavy elements, see the location above the Lower side of Multiplier or
the adjusted Slider ,and below the Lower side of Multiplier or the adjusted Slider.
6.To identify the r-process path:-
In the case of metal elements, see the location(on CS)that shows value of mass 58.0 u .In
the case of non- metal elements, see the location that shows value of mass 53.0 u .
7.To identify the nuclear binding energy:-
See the values of mass(depicted by CS and CS2)at the same level on CS and CS2.CS2
depicts the value for Mass Defect.
8.To identify the locations of isotopes on the basis of values of two- neutron separation
energy:-
On the basis of value of mass(printed on TNSE side),identify the nearest location on CS
for the isotope that is related to such value of mass.
See the lowest point of Printed Zone on CS. The proton Dripline of such element re mains
close to this point, or below this point.
10.To know the pattern of abundance:-
See the lowest point of Printed Zone on CS.As the distance between this point and Proton
Dripline of element increases, the abundance of element in the solar system decreases.
11.Identify the Straight Line of Nuclear Stability:-
See the uniform width of CS.
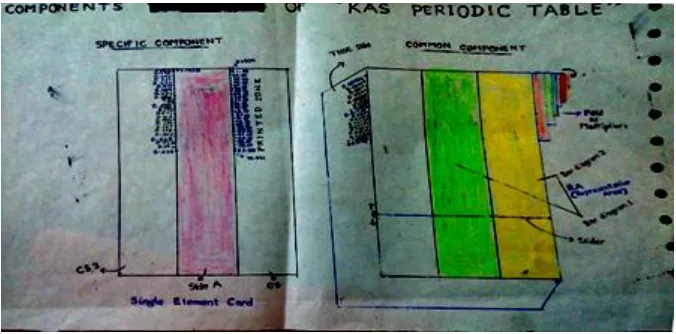
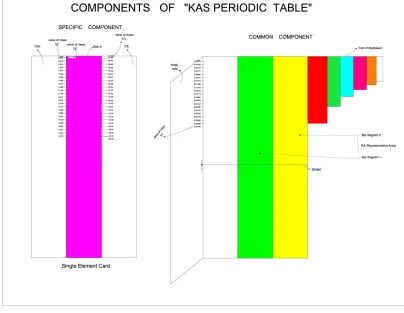
3.The Components of KAS Periodic Table
KAS Periodic Table has two major components :
1)Common Component , and 2)Specific Component.
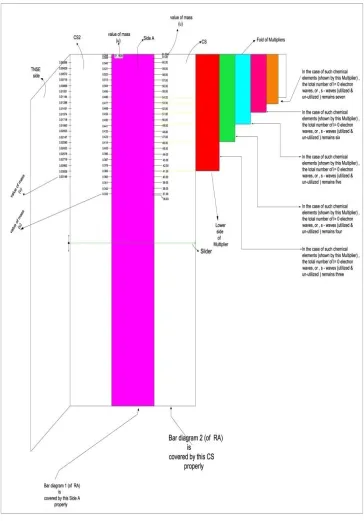
Common Component includes RA(Representative Area),Fold of Multipliers, TNSE side
and Slider.
Specific Component includes Single Element Card. The Single Element Card is composed
[image:9.612.73.411.438.605.2]of Side A,CS(Comparative Side) and CS2(Comparative Side2).
Figure 4a1
3(a)The Parts of Common Component
a)Representative Area (RA) ----
RA is composed of two bar diagrams---Bar diagram 1 and Bar diagram 2 .These bar
diagrams are used (as the parts of RA) for making comparison. See the above figure.
Side A(i.e., the part of Single Element Card) is attached to Bar diagram 1 of RA. CS(i.e.
,the part of Single Element Card) is attached to Bar diagram 2 of RA. We see that Bar
diagram 2 is covered by CS properly. The width of bar diagram is found equal to the width
of CS. The length of bar diagram remains equal to the length of CS.
Side A covers the Bar diagram 1 properly. The length of Side A remains equal to the
length of this diagram. The width of this diagram remains equal to the width of Side A. See
Figure1a1
b)Fold of Multipliers---
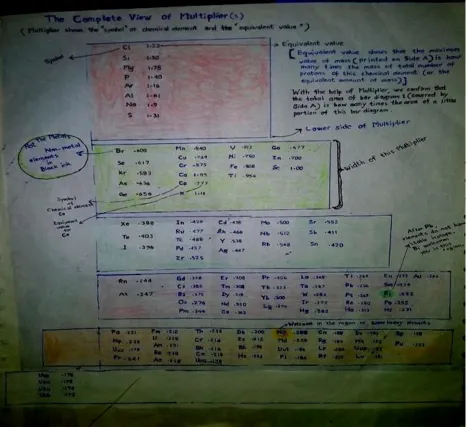
Fold of Multipliers is used as the part of Common Component. Multiplier depicts that the
total area of Bar diagram1 (covered by Side A)remains how many times the area of a little
portion of this Bar diagram.
Take some chemical elements. For example, take Lv, Ac, Db, Cn. In the case of such
chemical element, the total number of l= 0 electron waves ,or s-waves (utilized and
un-utilized)remains seven. In the Modern Periodic Table,the Period 7 includes these chemical
Figure5
Take Zn, Mn, Ti, Cu, Br. In the case of such chemical element, the total number of l= 0
electron waves ,or s-waves (utilized and un- utilized)remains four. In the Modern Periodic
Table,the Period 4 includes these chemical elements3 .For such elements,the total area of Bar diagram 1(covered by Side A) remains four times the area of a little portion of this bar
diagram. See figure 1, or figure 1a1.
In the case of Cd, Zr, Ag, Ru, Rb ,etc., the total number of l= 0 electron waves ,or s-waves
(utilized and un- utilized)remains five. In the Modern Periodic Table,the Period 5 includes
these chemical elements3 .For such elements,the total area of Bar diagram 1(covered by Side A) remains five times the area of a little portion of this bar diagram.
In the case of Ba, Gd, Cs, Lu, Ta, etc., the total number of l= 0 electron waves ,or s-waves
(utilized and un-utilized)remains six. In the Modern Periodic Table,the Period 6 includes
these chemical elements3 .For such elements,the total area of Bar diagram 1(covered by Side A) remains six times the area of a little portion of this bar diagram.
In the case of S, P, Cl, Mg ,etc., the total number of l= 0 electron waves ,or s-waves
(utilized and un- utilized)remains three. In the Modern Periodic Table,the Period 3 includes
these chemical elements3 .For such elements, the total area of Bar diagram 1(covered by Side A) remains three times the area of a little portion of this bar diagram.
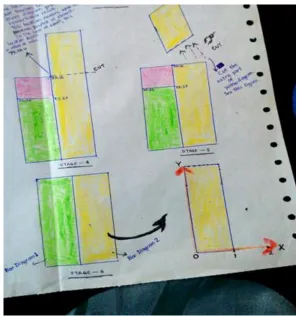
Now see the following figures.The green diagram(i.e.,Bar diagram1)depicts a value of
yellow diagram. The yellow diagram is used to show that the value of mass depicted by the
uncovered area of Bar diagram1(i.e.,the area which is not covered by the Multiplier)
remains about 0.343 times the Atomic Mass1 ( i.e., 1.0002 times the nuclear mass)of stable long- lived isotope of metal elements. In the case of Non-metal elements,the value of mass
depicted by the uncovered area of Bar diagram1 remains about 0.331 times the Atomic
[image:13.612.73.400.191.425.2]Mass of stable / long- lived isotopes.From Na to Uuo ,this pattern is found.
Figure 6
In this process,the part of yellow diagram that touches the apex of green diagram( i.e.,Bar
diagram1)gives a location that depicts the mass for heavier isotope of the element.The
half-life of such isotope is determined about few milliseconds.Such isotope remains on the
Figure 7
[image:14.612.70.368.275.591.2]Take the Atomic Magic Numbers4 . These are 2, 10,18,36,54,86,118 .Now take the Magic Numbers of nucleons4 (widely recognized in nuclear physics).These are 2,8,20,28,50,82,126.
Take the Magic Number (of protons) 28 .Now take the Atomic Magic Number 36 . After
Z=31,other chemical elements( e.g.,Ge ,As,Se,Br and Kr )are not the metal elements(i.e.,
Non-metal elements*).*See the Content number 5,'The Clarification of Terminologies' for
detail . In the case of Non- metal elements,the value of mass depicted by CS is multiplied
by 1.038 as per the empirical relationship.The values for Atomic Mass of
Stable/Long-lived isotopes of Non-metal elements are found on the upper part of CS comparatively
(towards higher energy level). We see that these five elements remain after the Magic
Number of protons 28. We can see that Z=31 remains close to the number 28. 3From Z=19 to Z=31,we find the metal elements kept in the Period 4 .
Now take the Magic Number(of protons)50.Take the Atomic Magic Number 54. After
Z=51,other chemical elements (e.g.,Te , I and Xe )are Non-metal elements(i.e.,not the
metal elements).In the case of these Non- metal elements,the values for Atomic Mass of
stable / long- lived isotopes are found on the upper part of CS comparatively (towards
higher energy level) . We see that these chemical elements remain after the Magic Number
of protons 50. We can see that Z=51 remains close to the number 50.3From Z=37 to Z=51,we find the metal elements kept in the Period 5 .The Atomic Masses of stable /
long-lived isotopes of chemical elements(from Z=32 to Z=51)can be noticed around the same
level on CS. In the case of Non- metal elements(from Z=32 to Z=36),the value of mass
depicted by CS is multiplied by 1.038 as per the empirical relationship.
Take the Magic Number(of protons) 82.Now take the Atomic Magic Number 86. After
Z=84,other chemical elements(e.g.,At and Rn)are Non- metal elements(i.e.,not the metal
elements). In the case of Non- metal elements,the values for Atomic Mass of stable /
long-lived isotopes are found on the upper part of CS comparatively (towards higher energy
level) . We see that these chemical elements remain after the Magic Number of protons
the case of Non- metal elements(from Z=52 to Z=54),the value of mass depicted by CS is
multiplied by 1.038 as per the empirical relationship.
3
From Z=87 to Z=118,we find the chemical elements kept in the Period 7. In the case of
Non-metal elements(e.g.,At and Rn),the value of mass depicted by CS is multiplied by
1.038 as per the empirical relationship. Therefore,the Atomic Masses of long-lived
isotopes of the chemical elements(from Z=85 to Z=118)can be noticed around the same
level on CS.
Take the Magic Numbers (of protons)2,8 and 20.Now take the Atomic Magic Numbers
2,10 and 18. In the case of chemical elements Z<19, the value of mass depicted by CS is
multiplied by 1.038 as per the empirical relationship . The Magic Numbers (of protons)2,8
and 20 seem different from other Magic Numbers(of protons)28,50,82 and 126.The
numbers 2,8 and 20 show different pattern.Up to the Magic Number(of protons)20,a
remarkable pattern can be noticed.
Multiplier shows symbol of chemical element and equivalent value. This equivalent value
shows that the maximum value of mass(printed on Side A)is how many times the mass of
total number of protons of this chemical element (or the equivalent value of mass).See this
Figure 9
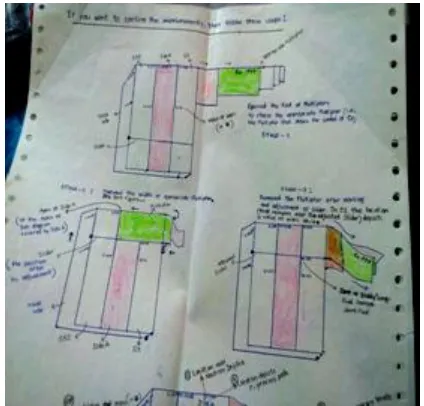
c)Slider ---
Slider is used to mark the values of mass .
In the case of Co, Mn, etc., apply the Multiplier that shows the symbols of these elements.
to make a comparison from this top point. Multiplier should cover the upper portion of
Side A. Now adjust the Slider to mark the values. The location very close to this adjusted
Slider depicts the Zone of Stable or Long- lived isotopes of the chemical element. Slider
[image:18.612.71.283.150.353.2]can move upward or downward. See this figure;
Figure 10
As we choose a chemical element for making comparison, the Bar diagram1(covered by
Side A) starts to depict a value of mass equivalent to the mass of total protons of this
Figure5a1
Figure11
by Bar diagram 1(covered by Side A) in the case of metal elements. When we choose a
chemical element for making comparison and use the appropriate Multiplier for taking
measurement of the area of little portion of Bar diagram 1(covered by Side A),Y-axis
depicts a value of mass near the adjusted Slider. X-axis depicts that such identified value
of mass remains how many times the actual or evaluated value of nuclear mass of stable or
long- lived isotope of this chemical element1 . d)TNSE side ---
Figure12
This side is added to identify the location of isotope on the basis of two-neutron separation
energy.See the above figure. See the upper portion of TNSE side. This location shows a
value of mass 0.00286 u (i.e., 2.66 MeV).On TNSE side, the value of mass increases as we
go down. The value of mass varies according to the variation in area. As we go down from
total area of TNSE side depicts a value of mass 0.001428 u (i.e., 1.33 MeV).We identify
the values of mass depicted by TNSE side. On the basis of this value of mass, identify the
nearest location on CS for the isotope that is related to such value of mass.
3(b)The Parts of Specific Component
Figure13
Specific Component includes Single Element Card. The Single Element Card is composed
of Side A, CS and CS2.
a)Side A ---
Side A depicts a value of mass equivalent to the mass of total protons of scandium
element(i.e., 21.1528 u ).The maximum value of mass(depicted by Side A)is used to make
other parts. The values of mass (depicted by CS and CS2)change according to the changing
in the value of mass depicted by Side A.
Figure14
b)Comparative Side (CS)---
The apex of CS shows a value of mass(i.e., 61.554 u). This value of mass remains 2.91
times the value of mass depicted by Side A. On CS, the value of mass decreases as we go
down. This happens due to the variation in area.The length of CS remains equal to the
length of Side A.
CS is developed to show that the value of mass depicted by the uncovered area of Side
A(i.e., the area which is not covered by the Multiplier)remains about 0.343 times the
nuclear mass of stable or long- lived isotope of metal element. The value of mass depicted
by the uncovered area of Side A remains about 0.331 times the nuclear mass of stable or
In this process, the part of CS that touches the apex of Side A gives a location that remains
near the Neutron Dripline (S1n= 0)of this chemical element7. See the above figure. The part of CS that touches the apex (topmost point)of Side A is known as the ‘apex of CS’.
Figure8 a1
The uniform width of CS(that covers the width of Bar diagram2 properly) depicts the
Straight Line of Nuclear Stability.
c)Comparative Side 2(CS2) ---
variation in area. The length of CS2 remains equal to the length of Side A. In the case of
element with short half- life, or in the case of nuclei that remain far from the zone of
stability, the value of mass(depicted by CS2)is multiplied by 0.95 .Towards the region of
heavier elements that do not have stable isotope, the values of mass(depicted by CS2)are
multiplied by 0.92 .
4.The Prope rties Identified on the Comparative Side (CS)
1.Location that remains near the Neutron Dripline( S1n = 0).
2. Location that remains near the Proton Dripline( either S1p = 0 , or S2p = 0)7.
We follow these steps to identify the location that remains near the Proton Dripline
of che mical element
Figure9 a1
Take a chemical element. For example, take actinium. See the above figure. Choose the
appropriate Multiplier(i.e., the Multiplier that shows the symbol “ Ac " ), and identify the
location that remains very close to the Zone of Stable or long- lived isotope(s).In the case
of actinium, this location depicts a value of mass 52.76 u on CS. We can see the following
Figure1 a2
Always add 2.2 u to such identified value of mass.
Mathematically;
52.76 u + 2.2 u
, or
54.96 u .
On CS, the location that depicts this value of mass (i.e., 54.96 u)remains about middle
point of two sides(i.e., one side that remains near the Neutron Dripline ,and other side that
remains near the Proton dripline of the chemical element) .Thus, we notice the other side
of CS(which remains near the Proton Dripline of this element).In the case of actinium, this
In case the value of mass depicted by other side remains less than the minimum value of
mass printed on CS, the minimum value of mass printed on CS will be considered other
side(the lowest point)that remains near the Proton Dripline of element.
3. We see the r-process path.
The location (on CS) that shows the value of mass 58.0 u depicts the r-process path in the
case of metal elements. The location (on CS)that shows the value of mass 53.0 u depicts
the r-process path in the case of non- metal elements. In the case of non- metal elements, the
values of mass(depicted by CS)are multiplied by 1.038 .
Figure13 a1
4. We identify the chemical elements that are the products of exothermal fusion.
Printed Zone covers 40% of total area of CS. The lowest point of Printed Zone depicts
minimum value of mass. See the above figure. In the case of chemical elements, which are
the products of exothermal fusion, Proton Driplines remain close to this point ,or below
this point.
See the lowest point of Printed Zone on CS.As the distance between this point and Proton
Dripline of element increases, the abundance of element in the solar system decreases.
6.We identify the beta decay trend.
7.In the case of superheavy elements, we identify which Compound Nuclei are involved in
the Hot Fusion reaction ,and which Compound Nuclei are involved in the Cold Fusion
reaction.
On CS, the location that depicts the value of mass 52.76 u co nfirms this result.
5.The Clarification of Terminologies
Mass of total number of protons
This means, (Z x 1.0072765 u) , or the equivalent value of mass.
Z= Number of protons of the element.
Total numbe r of l=0 electron waves, or s-waves(utilized and un-utilized)
The l=0 electron waves, or s-waves are known as the s-orbitals (shaped like sphere)of the
atom. Take the example of cadmium element. In the case of cadmium, the total number of
s-orbitals is five(i.e., five l=0 electron waves, or s-waves). In the Modern Periodic
Table,the Period 5 includes this chemical element.Here, the term ‘un-utilized’ means that
the s-orbital is engaged in chemical bonding or other similar activities, or the s-orbital
remains vacant.
Equivalent value
The Multiplier shows symbol of chemical element and equivalent value. This equivalent
value shows that the maximum value of mass(printed on Side A)remains how many times
the mass of total number of protons of this element(or the equivalent value of mass).
Non-metal elements
These include the non- metals/metalloids, gases, few tiny atoms(i.e., sodium, magnesium,
aluminum).
Long-lived isotopes
The half- life of such isotope(s) of an element is longer than the half- life of other isotope(s)
of the same element.
Actual value
Experimental and evaluated value.
(The letters or words of the terminology used by me may be changed or amended. But the
meaning and clarification of the terminology which are being given as description should
not be changed)
6. Results
With the help of KAS Periodic Table, we find the values that remain close to the
actual values. For example, see these results:
The experimental and evaluated data of authentic sources(e.g., NNDC,Brookhaven
National Laboratory ; Radiochemistry Society ; LBNL ; ‘The NUBASE evaluation of nuclear and decay properties’,etc.)are used to verify the results produced by KAS Periodic
Table.
1)The value of mass depicted by the apex of bar diagram(covered by CS).This location
Symbol of element , Value of mass (u) ;
S, 49.0 u ; Cl, 52.0 u ; Ce, 170.0 u ; Ni, 82.0 u ; Rb, 108.0 u ; Hg, 235.0 u ; Co, 79.0 u ; Sr,
111.0 u ; Rh, 132.0 u ; Pd, 135.0 u ; Kr, 110.0 u ; Nd, 176.0 u ; K, 56.0 u ; P, 46.0 u ; Nb,
120.0 u ; Cs, 161.0 u ; Fm, 293.0 u ; Br, 107.0 u ; Zr, 117.0 u ; Th, 264.0 u ; Sb, 150.0 u
Figure3 a1
2) The identified location on bar diagram(covered by CS)remains very close to the Zone of
Stable/Long- lived isotopes of the element :-
Mn, 54.96 u ; Ti, 48.36 u ; Co, 59.35 u ; Cu, 63.75 u ; Zn, 65.95 u ; As, 75.3 u ; Cd, 112.55
u ; In, 114.90 u ; Xe, 131.44 u ; Ba, 136.79 u ; Eu, 153.89 u ; Gd, 156.33 u ; Tb, 158.77 u ;
228.63 u ; Np, 233.65 u ; Db, 263.80 u ; Cn, 281.39 u ; Fl, 286.41 u ; Uup, 288.93 u ; Lv;
291.44 u ; Uuo, 296.46 u ; Rb,86.76 u ; Mg, 24.34 u ; Si, 28.39 u ; S, 32.45 u ; P, 30.43 u ;
V, 50.56 u ….
3) The identified location on bar diagram(covered by CS)remains near the Proton
Dripline(either S1p = 0 , or S2p = 0) of element:-
Co, 47.0 u ; Mn, 44.0 u ; V, 41.0 u ; Cl, 31.0 u ; Rb, 73.0 u ; Y, 77.0 u ; Zr, 79.0 u ; Nb,
81.0 u ; Mo, 83.0 u ; Tc, 85.0 u ; Ru, 87.0 u ; Rh, 89.0 u; Ag, 93.0 u ; Cd, 94.0 u ; In, 96.0
u ; Sn, 98.0 u ; I, 109.0 u ; Xe, 111.0 u ; Cs, 119.0 u ; Eu, 136.0 u ; Tb, 141.0 u ; Ho, 145.0
u ; Tm, 147.0 u ; Yb, 151.0 u ; Lu, 154.0 u ; Hf, 156.0 u ; Ta, 158.0 u ; W, 160.0 u ; Re,
162.0 u ; Pt, 169.0 u ; Ir, 167.0 u ; Fr, 200.0 u ; Ac, 205.0 u ; Pa, 210.0 u ; U, 212.0 u ; Np,
214.0 u ; Am, 219.0 u; Bk, 223.0 u ; Fm, 230.00 u ; Lr, 237.0 u ; Md, 233.0 u …
4) r-process path :-
Approximate r-process path goes through ----
The value of mass depicted by the location identified on bar diagram(covered by CS)---
Fe, 72.0 u ; Ge, 84.0 u ; As, 86.0 u ; Se, 89.0 u ; Br, 92.0 u ; Kr, 94.0 u ; Rb, 102.0 u ; Sr,
105.0 u ; Y, 108.0 u ; Zr, 110.0 u ; Nb, 113.0 u ; Mo, 116.0 u ; Tc, 119.0 u ; Ru, 122.0 u ;
Rh, 124.0 u ; Ag , 130.0 u ; Cd, 133.0 u ; In, 135.0 u ; Sb , 141.0 u ; Te, 136.0 u ; I , 139.0
u ; Nd, 166.0 u ; Pm, 168.0 u ; Sm, 171.0 u ; Eu,174.0 u ; Gd, 177.0 u ; Tb, 180.0 u ; Yb,
193.0 u ; Lu, 196.0 u ; Ta, 202.0 u ; Hf, 199.0 u ;…
5)Two-neutron separation energy :-
We identify the locations of isotopes on the basis of values of two- neutron separation
energy. For example, see the locations of isotopes identified on CS in the case of Tb and
Cr ---
When the value of two- neutron separation energy is about 22.66 MeV( or 0.02433 u),the
Figure1 a3
In the case of Tb, actual values of A are 140, 141, 142,143.In the case of Cr, actual values
of A are 51,52.
When the value remains about 21.33 MeV( or 0.02290 u ),the location that shows value of
mass 46.0 u on CS. In the case of Tb, actual values of A are 144,145,146.
When the value of two-neutron separation energy is about 20.0 MeV(or 0.02147 u),the
location that shows value of mass 47.0 u on CS. In the case of Tb, actual values of A are
147,148.In the case of Cr, actual value of A is 53.
When the value remains about 18.66 MeV(or 0.02003 u ),the location that shows value of
mass 48.0 u on CS. In the case of Tb, actual value of A is 148.
When the value of two-neutron separation energy is about 17.33 MeV(or 0.01860 u),the
location that shows value of mass 49.0 u on CS. In the case of Tb, actual values of A are
When the value remains about 16.0 MeV(or 0.01718 u ),the location that shows value of
mass 50.0 u on CS. In the case of Tb, actual values of A are
150,151,152,153,154,155,156,157,158.In the case of Cr, actual value of A is 55 .
. When the value of two-neutron separation energy is about 14.66 MeV(or 0.01574 u),the
location that shows value of mass 51.0 u on CS.In the case of Tb, actual values of A are
159,160,161,162.In the case of Cr, actual value of A is 56.
When the value of two-neutron separation energy is about 13.33 MeV(or 0.01431 u),the
location that shows value of mass 52.0 u on CS.In the case of Tb,actual values of A are
161,162, 163.In the case of Cr,actual values of A are 57,58.
When the value of two-neutron separation energy is about 12.0 MeV(or 0.01288 u),the
location that shows value of mass 53.0 u on CS.In the case of Tb,actual values of A are
164,165,166,167.In the case of Cr,actual value of A is 59.
When the value of two-neutron separation energy is about 10.66 MeV(or 0.01144 u),the
location that shows value of mass 54.0 u on CS.In the case of Tb,actual values of A are
168,169.In the case of Cr,actual values of A are 60,61,62.
When the value of two-neutron separation energy is about 9.33 MeV(or 0.01001 u),the
location that shows value of mass 55.0 u on CS.In the case of Tb,actual values of A are
170,171.In the case of Cr,actual values of A are 62,63,64,65.
When the value of two- neutron separation energy is about 8 MeV(or 0.00859 u),the
location that shows value of mass 56.0 u on CS.In the case of Cr,actual values of A are
65,66.
When the value of two-neutron separation energy is about 6.66 MeV(or 0.00715 u),the
location that shows value of mass 57.0 u on CS.In the case of Cr,actual value of A is 67.
6) Mass defect :-
When we use Single Element Card, the Side A shows a value of mass(i.e., 21.1528 u ).This
In the case of Tb,CS2 depicts the following value of mass that remains about 0.323 times
the actual value of mass.
The value of mass depicted by the bar diagram(cove red by CS), The value of mass
depicted by nearest location on CS2 ;
140.0 u , 0.387 u ; 141.0 u , 0.389 u ; 142.0 u , 0.392 u ; 143.0 u , 0.395 u ; 144.0 u , 0.418
u ; 145.0 u, 0.421 u ; 146.0 u, 0.424 u ; 147.0 u, 0.427 u ; 148.0 u, 0.430 u; 149.0 u, 0.433
u ; 150.0 u, 0.436 u ; 151.0 u, 0.439 u ; 152.0 u, 0.442 u ; 153.0 u, 0.444 u ; 154.0 u, 0.447
u ; 155.0 u, 0.450 u ; 156.0 u, 0.453 u ; 157.0 u, 0.456 u ; 158.0 u, 0.459 u ; 159.0 u, 0.462
u ; 160.0 u, 0.465 u ; 161.0 u, 0.468 u ; 162.0 u, 0.471 u ; 163.0 u, 0.474 u ; 164.0 u, 0.476
u ; 165.0 u, 0.479 u ; 166.0 u, 0.482 u ; 167.0 u, 0.485 u ; 168.0 u, 0.488 u ; 169.0 u, 0.491
u ; 170.0 u, 0.47 u ; 171.0 u, 0.472 u;…
In the case of Cr,CS2 depicts the following value of mass that remains about 0.875 times
the actual value of mass.
67.0 u, 0.501 u ; 66.0 u, 0.494 u ; 65.0 u, 0.511 u ; 64.0 u, 0.504 u ; 63.0 u, 0.496 u ; 62.0
u, 0.488 u ; 61.0 u, 0.480 u ; 60.0 u, 0.472 u ; 59.0 u, 0.465 u; 58.0 u, 0.457 u ; 57.0 u,
0.449 u ; 56.0 u, 0.441 u ; 55.0 u, 0.433 u ; 54.0 u, 0.425 u ; 53.0 u, 0.418 u ; 52.0 u, 0.41 u
; 51.0 u, 0.402 u ; 50.0 u, 0.394 u ; 49.0 u, 0.386 u ; 48.0 u, 0.378 u; 47.0 u, 0.370 u ; 46.0
u, 0.362 u ; 45.0 u, 0.337 u ; 44.0 u, 0.329 u ; 43.0 u, 0.322 u;…
7)Beta minus decay :-
Take the example of Tb. In the case of Tb, CS depicts a value of mass near the adjusted
Slider. It is 51.295 u. The location above this adjusted Slider depicts the beta minus decay
trend. The location depicts following value of mass on the bar diagram(covered by CS)----
160.0 u ; 161.0 u; 162.0 u; 163.0 u; 164.0 u; 165.0 u; 166.0 u ; 167.0 u; 168.0 u; 169.0 u;
170.0 u ; 171.0 u;..
Beta plus decay ---
The location below this adjusted Slider depicts the beta plus decay trend .The location
depicts following value of mass on the bar diagram(covered by CS)in the case of Tb ;
Figure2 a2
8) In the case of superheavy elements, which Compound Nucleus(CN) is involved in the
Hot Fusion reaction ,or which Compound Nucleus(CN) is involved in the Cold Fusion
reaction:-
(In the case of almost all the successful reactions, the predictions are found correct.)
a)In the case of Rf, the bar diagram(covered by CS)depicts a value of mass near the
adjusted Slider. It is 261.29 u. The location above the adjusted Slider depicts greater value
of mass(i.e., greater than 261.29 u).Generally, the mass of CN(CN involved in the Hot
Fusion reaction)remains greater than ,or equal to 261.0 u.
For illustration, see these Compound Nuclei(involved in the Hot Fusion reaction) in the
case of Rf ---
264
Rf(242Pu + 22Ne ); 264Rf( 248Cm + 16O ) ; 263Rf( 249Bk + 14N ) ; 266Rf( 244Pu + 22Ne ) ; 264
For illustration;
258
Rf( 208Pb + 50Ti ) ; 257Rf( 207Pb + 50Ti ); 256Rf( 206Pb + 50Ti ) ; 254Rf( 204Pb + 50Ti ) ; 256
Rf(48Ti + 208Pb);..
b) In the case of Lr, the identified value of mass is 258.77 u . Generally, the mass of
CN(CN involved in the Hot Fusion reaction)remains greater than, or equal to 258.0 u. For
illustration;
261
Lr( 243Am + 18O ) ; 259Lr( 243Am + 16O ) ; 263Lr(248Cm + 15N) ; 265Lr ; 260Lr ( 246Cm + 14N ) ; 258Lr ( 244Cm + 14N ) ; 263Lr ; 262Lr ( 252Cf + 10B ) ; 260Lr ( 249Cf + 11B ) ;…
Generally,the mass of CN(CN involved in the Cold Fusion reaction)remains less than, or
equal to 258.0 u.
For illustration;
255
Lr( 205Tl + 50Ti ) ; 257Lr ( 209Bi + 48Ca ) ; 253Lr( 208Pb + 45Sc ) ; 255Lr ; 253Lr( 203Tl + 50Ti );..
c)In the case of Uus, the identified value of mass is 293.95 u . Generally,the mass of
CN(CN involved in the Hot Fusion reaction)remains greater than, or equal to 293.0 u.For
illustration;
297
Uus( 249Bk + 48Ca ) ;..
d)In the case of Hs, the identified value of mass is 271.34 u . Generally,the mass of
CN(CN involved in the Hot Fusion reaction)remains greater than, or equal to 271.0 u. For
illustration;
274
Hs( 226Ra + 48Ca ) ; 271Hs( 249Cf + 22Ne ) ; 274Hs( 238U + 36S ) ; 272Hs( 238U + 34S ) ; 274Hs( 248
Cm + 26Mg ) ;..
Generally, the mass of CN(CN involved in the Cold Fusion reaction)remains less than, or
equal to 271.0 u.
For illustration;
266
e)In the case of Ds, the identified value of mass is 276.36 u . Generally,the mass of CN(CN
involved in the Hot Fusion reaction)remains greater than ,or equal to 276.0 u. For
illustration;
280
Ds(232Th + 48Ca ) ; 278Ds( 244Pu + 34S);..
Generally,the mass of CN(CN involved in the Cold Fusion reaction)remains less than ,or
equal to 276.0 u.
For illustration;
272
Ds (64Ni + 208Pb ) ; 270Ds ( 62Ni + 208Pb );…
f) In the case of Bh, the identified value of mass is 268.83 u . Generally,the mass of
CN(CN involved in the Hot Fusion reaction)remains greater than, or equal to 268.0 u. For
illustration;
271
Bh( 22Ne + 249Bk ) ; 269Bh( 238U + 31P ) ; 269Bh( 26Mg + 243Am );…
Generally,the mass of CN(CN involved in the Cold Fusion reaction)remains less than, or
equal to 268.0 u.
For illustration;
263
Bh( 55Mn + 208Pb ) ; 263Bh( 54Cr + 209Bi ) ; 261Bh( 52Cr + 209Bi ) ;…
g) In the case of Mt, the identified value of mass is 273.85 u . Generally,the mass of
CN(CN involved in the Hot Fusion reaction)remains greater than, or equal to 273.0 u. For
illustration;
Generally,the mass of CN(CN involved in the Cold Fusion reaction)remains less than, or
equal to 273.0 u.
For illustration;
267
Mt( 58Fe + 209Bi ) ; 267Mt( 59Co + 208Pb );….
h) In the case of Rg, the identified value of mass is 278.88 u . Generally,the mass of
i) In the case of Uut, the identified value of mass is 283.90 u . Generally,the mass of
CN(CN involved in the Hot Fusion reaction)remains greater than, or equal to 283.0 u. For
illustration;
285
Uut( 237Np + 48Ca ) ;….
j) In the case of Uup, the identified value of mass is 288.93 u . Generally,the mass of
CN(CN involved in the Hot Fusion reaction)remains greater than, or equal to 288.0 u. For
illustration;
289
Uup(238U + 51V) ; 291Uup( 243Am + 48Ca ) ;…
k) In the case of Fl, the identified value of mass is 286.41 u . Generally,the mass of
CN(CN involved in the Hot Fusion reaction)remains greater than, or equal to 286.0 u. For
illustration;
290
Fl( 48Ca + 242Pu ) ; 292Fl( 48Ca + 244Pu ) ;..
Generally,the mass of CN(CN involved in the Cold Fusion reaction)remains less than, or
equal to 286.0 u. For illustration;
284
Fl( 76Ge + 208Pb ) ;..
l) ) In the case of No, the identified value of mass is 256.26 u . Generally,the mass of
CN(CN involved in the Hot Fusion reaction)remains greater than, or equal to 256.0 u. For
illustration;
258
No( 232Th + 26Mg ) ; 260No(238U + 22Ne) ; 258No(236U + 22Ne) ; 258No(238U + 20Ne) ; 257
No(235U + 22Ne) ; 260No(242Pu + 18O) ; 257No(241Pu + 16O ) ; 257No(239Pu + 18O) ; 258
No(243Am + 15N) ; 257No(243Am + 14N) ; 256No(241Am + 15N) ; 262No ; 261No(248Cm + 13C) ; 260No(248Cm + 12C) ; 259No(246Cm + 13C) ; 258No(246Cm + 12C) ; 257No(244Cm + 13C) ; 256
No(244Cm + 12C) ; 260No ; 262No ; 261No ; …
Generally,the mass of CN(CN involved in the Cold Fusion reaction)remains less than, or
equal to 256.0 u. For illustration;
256
No(208Pb + 48Ca) ; 252No(208Pb + 44Ca) ; 255No(207Pb + 48Ca ); 254No(206Pb + 48Ca) ; 252
m) In the case of Cn, the identified value of mass is 281.39 u . Generally,the mass of
CN(CN involved in the Hot Fusion reaction)remains greater than, or equal to 281.0 u. For
illustration;
286
Cn(238U + 48Ca) ; 281Cn(233U + 48Ca) ; …
Generally,the mass of CN(CN involved in the Cold Fusion reaction)remains less than ,or
equal to 281.0 u. For illustration;
276
Cn(208Pb + 68Zn) ; 272Cn(184W + 88Sr) ; 278Cn(208Pb + 70Zn) ;…
n) ) In the case of Sg, the identified value of mass is 266.31 u . Generally,the mass of
CN(CN involved in the Hot Fusion reaction)remains greater than, or equal to 266.0 u. For
illustration;
267
Sg(18O + 249Cf) ; 268Sg(30Si + 238U ) ; 270Sg(22Ne + 248Cm) ;…
Generally,the mass of CN(CN involved in the Cold Fusion reaction)remains less than ,or
equal to 266.0 u. For illustration;
262
Sg((54Cr + 208Pb) ; 261Sg(54Cr + 207Pb) ; 260Sg(51V + 209Bi) ; 260Sg(52Cr + 208Pb) ;… o) In the case of Lv, the identified value of mass is 291.44 u . Generally,the mass of
CN(CN involved in the Hot Fusion reaction)remains greater than, or equal to 291.0 u. For
illustration;
292
Lv(238U + 54Cr) ; 296Lv(248Cm + 48Ca) ; 293Lv(245Cm + 48Ca) ;…
Generally,the mass of CN(CN involved in the Cold Fusion reaction)remains less than, or
equal to 291.0 u. For illustration;
290
Lv(208Pb + 82Se) ;…
p) In the case of Db, the identified value of mass is 263.80 u . Generally,the mass of
CN(CN involved in the Hot Fusion reaction)remains greater than, or equal to 263.0 u. For
263
Db(232Th + 31P ) ; 265Db(238U + 27Al) ; 263Db(236U + 27Al) ; 265Db(243Am + 22Ne) ; 263
Db(241Am + 22Ne) ; 267Db(248Cm + 19F) ; 267Db(249Bk + 18O) ; 265Db(249Bk + 16O) ; 265
Db(250Cf + 15N) ; 264Db(249Cf + 15N) ; 267Db(254Es + 13C) ;…
Generally,the mass of CN(CN involved in the Co ld Fusion reaction)remains less than, or
equal to 263.0 u. For illustration;
259
Db(209Bi + 50Ti) ; 258Db(209Bi + 49Ti) ; 257Db(209Bi + 48Ti) ; 259Db(208Pb + 51V) ; 258
Db(207Pb + 51V) ; 259Db(205Tl + 54Cr) ;…
7.Conclusion
We find that the graphical representation makes the process easy and fast.The structure of
KAS Periodic Table is simple.With the help of this chart,we identify the nuclear properties
of chemical elements quickly without knowledge of high level of mathematics,or any deep
technical skill.Even a semi-skilled person can use this chart. At a time,we can find the
nuclear properties of almost all the elements on the same chart quickly.This saves time,cost
and labor.Other empirical relationship can be explored.This chart shows the relationship
among chemical elements and the clear pattern of nuclear stability. In the case of super
heavy elements,this chart can be used as a marker to identify which compound nucleus is
involved in the Hot Fusion reaction,or which compound nucleus is involved in the Cold
Fusion reaction.
KAS Periodic Table can be used in lieu of Segre Chart.
Acknowledgme nts
For your direct or indirect support ,I shall be grateful to you :
a)Members of the Indian Science Congress Association;
b)Dr. Mark Leach,Curator(The INTERNET Database of Periodic Tables);
c)Department of Science & Technology,Government of India;
References
1.Audi,G.; Wapstra,A. H.; Thibault,C.;Blachot and Bersillon,O.(2003). The NUBASE
evaluation of nuclear and decay properties.
2.Orchin,Milton; Macomber,Roger S.; Pinhas,Allan;Wilson,R.Marshall(2005). Atomic
Orbital Theory.
3. Radiochemistry Society : Periodic Table of the Elements.
4.Maria Goeppert Mayer(Nobel Lecture ,December 12,1963).The Shell model.
5.Ministry of Human Resource Development, Government of India.
6.Proceedings of the 102nd Indian Science Congress, 2015.Section of physical sciences. 7.National Nuclear Data Center(NNDC),ENSDF Database.
8.Broecker, W.S.(1985). Relative Elemental Abundance in our Sun.
About the inventor of KAS Periodic Table
Khwaja Ahmad Shadab
(Delegate , ISC 2015 ; Ex Member, The Indian Science Congress Association) Qualification : MBA , UGC-NET/JRF (Management)
Occupation : Management Consultant , Developer of Management Games and Models,