APPENDIX
A.
STRATEGIES
A.1
Background traders
Rmin 0 0 0 0 0 0 500 0 0 2500 5000 5000
Rmax 125 125 250 500 1000 1000 1000 1500 2500 10000 10000 15000
[image:1.612.123.492.115.152.2]η 0.8 1 1 1 0.8 1 0.4 0.6 1 1 1 1
Table 1: ZIR strategy combinations included in empirical game-theoretic analysis.
A.2
Market makers
K 100 100 100 100 100 100 100 100
ω 64 128 256 256 512 512 1024 2048
[image:1.612.192.419.209.243.2]ξ 100 100 50 100 50 100 100 100
Table 2: Market maker (MM) strategy combinations included in empirical game-theoretic analysis.
B.
EQUILIBRIA
B.1
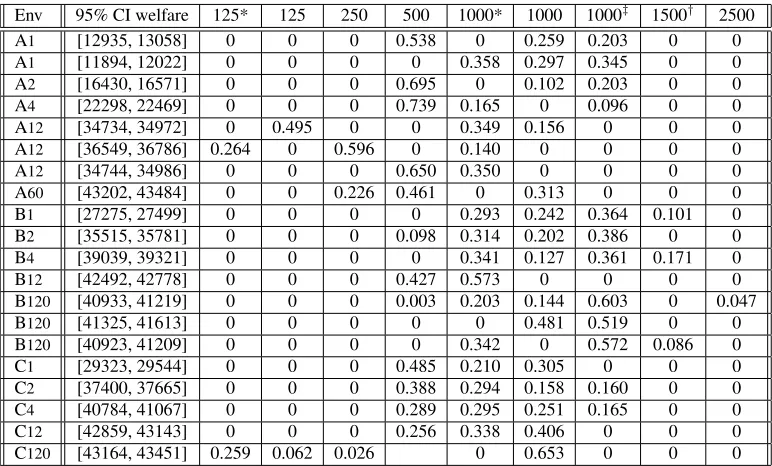
Games without MM
Env 95% CI welfare 125* 125 250 500 1000* 1000 1000‡ 1500† 2500 A1 [12935, 13058] 0 0 0 0.538 0 0.259 0.203 0 0 A1 [11894, 12022] 0 0 0 0 0.358 0.297 0.345 0 0 A2 [16430, 16571] 0 0 0 0.695 0 0.102 0.203 0 0 A4 [22298, 22469] 0 0 0 0.739 0.165 0 0.096 0 0 A12 [34734, 34972] 0 0.495 0 0 0.349 0.156 0 0 0 A12 [36549, 36786] 0.264 0 0.596 0 0.140 0 0 0 0 A12 [34744, 34986] 0 0 0 0.650 0.350 0 0 0 0 A60 [43202, 43484] 0 0 0.226 0.461 0 0.313 0 0 0 B1 [27275, 27499] 0 0 0 0 0.293 0.242 0.364 0.101 0 B2 [35515, 35781] 0 0 0 0.098 0.314 0.202 0.386 0 0 B4 [39039, 39321] 0 0 0 0 0.341 0.127 0.361 0.171 0 B12 [42492, 42778] 0 0 0 0.427 0.573 0 0 0 0 B120 [40933, 41219] 0 0 0 0.003 0.203 0.144 0.603 0 0.047 B120 [41325, 41613] 0 0 0 0 0 0.481 0.519 0 0 B120 [40923, 41209] 0 0 0 0 0.342 0 0.572 0.086 0 C1 [29323, 29544] 0 0 0 0.485 0.210 0.305 0 0 0 C2 [37400, 37665] 0 0 0 0.388 0.294 0.158 0.160 0 0 C4 [40784, 41067] 0 0 0 0.289 0.295 0.251 0.165 0 0 C12 [42859, 43143] 0 0 0 0.256 0.338 0.406 0 0 0 C120 [43164, 43451] 0.259 0.062 0.026 0 0.653 0 0 0
Table 3: Symmetric equilibria for games without market makers,N = 66, calculated from the 6-player DPR approximation. The numeric column headings giveRmaxvalues for the ZIR strategies. All employRmin= 0with the exception of the double dagger (‡)
value which usesRmin = 500. All employη= 1, except for the starred values which useη= 0.8, the dagger (†) value which uses
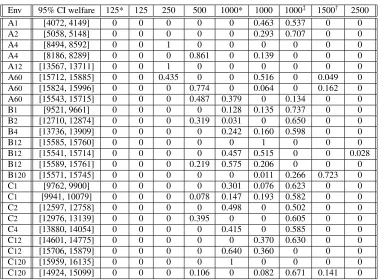
[image:1.612.112.498.330.563.2]Env 95% CI welfare 125* 125 250 500 1000* 1000 1000‡ 1500† 2500 A1 [4072, 4149] 0 0 0 0 0 0.463 0.537 0 0 A2 [5058, 5148] 0 0 0 0 0 0.293 0.707 0 0
A4 [8494, 8592] 0 0 1 0 0 0 0 0 0
[image:2.612.116.494.229.509.2]A4 [8186, 8289] 0 0 0 0.861 0 0.139 0 0 0 A12 [13567, 13711] 0 0 1 0 0 0 0 0 0 A60 [15712, 15885] 0 0 0.435 0 0 0.516 0 0.049 0 A60 [15824, 15996] 0 0 0 0.774 0 0.064 0 0.162 0 A60 [15543, 15715] 0 0 0 0.487 0.379 0 0.134 0 0 B1 [9521, 9661] 0 0 0 0 0.128 0.135 0.737 0 0 B2 [12710, 12874] 0 0 0 0.319 0.031 0 0.650 0 0 B4 [13736, 13909] 0 0 0 0 0.242 0.160 0.598 0 0 B12 [15585, 15760] 0 0 0 0 0 1 0 0 0 B12 [15541, 15714] 0 0 0 0 0.457 0.515 0 0 0.028 B12 [15589, 15761] 0 0 0 0.219 0.575 0.206 0 0 0 B120 [15571, 15745] 0 0 0 0 0 0.011 0.266 0.723 0 C1 [9762, 9900] 0 0 0 0 0.301 0.076 0.623 0 0 C1 [9941, 10079] 0 0 0 0.078 0.147 0.193 0.582 0 0 C2 [12597, 12758] 0 0 0 0 0.498 0 0.502 0 0 C2 [12976, 13139] 0 0 0 0.395 0 0 0.605 0 0 C4 [13880, 14054] 0 0 0 0 0.415 0 0.585 0 0 C12 [14601, 14775] 0 0 0 0 0 0.370 0.630 0 0 C12 [15706, 15879] 0 0 0 0 0.640 0.360 0 0 0 C120 [15959, 16135] 0 0 0 0 1 0 0 0 0 C120 [14924, 15099] 0 0 0 0.106 0 0.082 0.671 0.141 0
B.2
Games with MM
[image:3.612.94.726.75.335.2]Env 95% CI surplus 95% CI welfare 125* 125 250 500 1000* 1000 1000‡ 1500† 2500 var 128 25650 256 51250 512 A1 [13135, 13623] [14808, 14929] 0.268 0 0.369 0.363 0 0 0 0 0 0 0 1 0 0 0 A2 [16687, 17318] [18489, 18632] 0.323 0.106 0.147 0.424 0 0 0 0 0 0 0 1 0 0 0 A4 [22125, 22914] [24434, 24606] 0 0 0.549 0.451 0 0 0 0 0 0 0 1 0 0 0 A12 [34291, 35361] [37449, 37694] 0 0 0.554 0.440 0 0.006 0 0 0 0 0 1 0 0 0 A60 [40288, 41810] [43155, 43443] 0 0 0 0 0.761 0.239 0 0 0 1 0 0 0 0 0 B1 [28828, 29301] [29175, 29400] 0 0 0 0.316 0.270 0.151 0.263 0 0 0 0 0 0 0 1 B2 [36411, 36947] [37088, 37354] 0 0 0 0.281 0.346 0.280 0.093 0 0 0 0 0 0 0 1 B2 [37122, 37725] [37915, 38179] 0 0 0 0.496 0.379 0.125 0 0 0 0 0 0 0 1 0 B4 [40262, 41204] [41120, 41403] 0 0 0 0 0.556 0.444 0 0 0 0 0 0 1 0 0 B12 [41683, 42846] [43058, 43346] 0 0 0 0 0.711 0.289 0 0 0 0 0 0 1 0 0 B12 [41871, 42956] [43014, 43300] 0 0.109 0 0 0 0.891 0 0 0 0 0 0 1 0 0 B120 [40342, 41595] [42662, 42949] 0 0 0 0 0.307 0 0.274 0.419 0 0 0 0 1 0 0 B120 [41584, 42981] [43552, 43840] 0 0.063 0.188 0 0 0 0 0.749 0 0 0 1 0 0 0 B120 [41719, 43029] [43502, 43790] 0 0 0.206 0 0 0 0 0.794 0 0 0 0.784 0 0 0.216 B120 [41988, 43308] [43497, 43785] 0 0 0.206 0 0 0 0 0.794 0 0 0 0.783 0 0.002 0.215 B120 [42074, 43463] [43695, 43983] 0 0 0 0 1 0 0 0 0 0 0 1 0 0 0 B120 [41354, 43023] [43313, 43600] 0 0 0 0 0.776 0 0.103 0.121 0 0 1 0 0 0 0 C1 [29877, 30221] [30733, 30953] 0 0 0.187 0.476 0.188 0.149 0 0 0 0 0 0 0 0 1 C2 [38207, 38896] [40052, 40316] 0 0 0.387 0.613 0 0 0 0 0 0 0 1 0 0 0 C4 [39622, 40359] [41253, 41534] 0 0 0 0 0.484 0.516 0 0 0 0 0 0.414 0.586 0 0 C12 [41096, 41881] [43344, 43632] 0 0.205 0 0.014 0.781 0 0 0 0 0 0 0 1 0 0 C120 [41292, 42172] [43290, 43577] 0 0 0.222 0 0 0.626 0.152 0 0 0 0 0.925 0.075 1 0
Table 5: Role-symmetric equilibria for games with market makers,N = 66, calculated from the (6,1)-player DPR approximation. The numeric column headings giveRmax
Env 95% CI surplus 95% CI welfare 125* 125 250 500 1000* 1000 1000‡ 1500† 2500 var 128 25650 256 51250 512 A1 [4574, 4834] [5557, 5632] 0.403 0 0.597 0 0 0 0 0 0 0 0 0 0 0 1 A2 [6109, 6527] [7042, 7132] 0 0.226 0.428 0.346 0 0 0 0 0 0 0 1 0 0 0 A4 [7934, 8304] [8958, 9067] 0 0 0.286 0.714 0 0 0 0 0 0 0 0 0 1 0 A12 [12147, 12965] [14342, 14492] 0 0.752 0 0.248 0 0 0 0 0 0 0 1 0 0 0 A60 [13847, 14822] [16388, 16563] 0 0 0.507 0 0.454 0.039 0 0 0 0 0.022 0.978 0 0 0 B1 [11100, 11510] [11886, 12025] 0 0 0.257 0.631 0 0 0.112 0 0 0 0 0 0 0.568 0.432 B2 [13005, 13460] [14032, 14195] 0 0 0 0.696 0 0 0.304 0 0 0 0 0 0 0 1 B4 [13806, 14326] [14682, 14857] 0 0 0 0.221 0 0.436 0.343 0 0 0 0 0 0 0 1 B12 [14855, 15430] [16000, 16174] 0 0 0.270 0 0.730 0 0 0 0 0 0 0 0 1 0 B12 [14588, 15488] [16226, 16404] 0 0 0.108 0 0.833 0 0 0 0.059 0 0 0 1 0 0 B120 [14750, 15719] [16456, 16631] 0 0 0.390 0 0 0 0 0.610 0 0 0 0.995 0 0.005 0 C1 [10766, 11037] [11612, 11749] 0 0 0 0.801 0.199 0 0 0 0 0 0 0 0 0 1 C1 [11092, 11403] [12113, 12251] 0 0 0.261 0.739 0 0 0 0 0 0 0 0 0 1 0 C2 [13676, 14039] [14828, 14996] 0 0 0.026 0.974 0 0 0 0 0 0 0 0 0 1 0 C4 [15044, 15594] [16143, 16317] 0 0 0.219 0.781 0 0 0 0 0 0 0 0.238 0.762 0 0 C12 [14715, 15345] [16293, 16468] 0 0 0 0 0.421 0.579 0 0 0 0 0 0 1 0 0 C120 [15009, 15695] [16577, 16753] 0 0 0 0 0.395 0.563 0 0.042 0 0 0 1 0 0 0
B.3
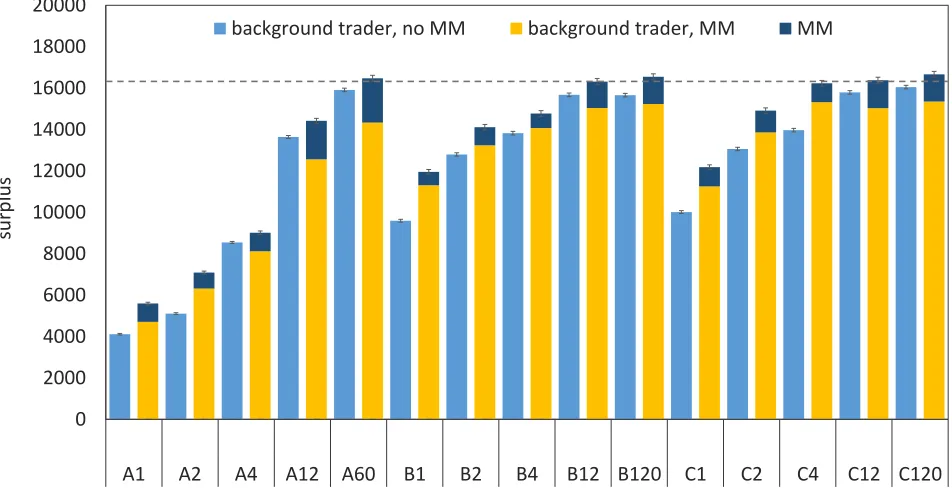
Surplus comparison, with and without MM
0
10000
20000
30000
40000
50000
A1
A2
A4
A12
A60
B1
B2
B4
B12 B120
C1
C2
C4
C12 C120
surp
lus
[image:5.612.71.547.72.324.2]background trader, no MM
background trader, MM
MM
Figure 1: Comparison of background-trader surplus (with and without market makers) and MM profit forN= 66. The dotted line is the optimal social welfare available (44155). Error bars indicate the 95% confidence interval for total welfare in the maximum-welfare role-symmetric Nash equilibrium in each environment, with and without MM. Each bar is compiled from 10,000 samples.
0
2000
4000
6000
8000
10000
12000
14000
16000
18000
20000
A1
A2
A4
A12
A60
B1
B2
B4
B12 B120
C1
C2
C4
C12 C120
surp
lus
background trader, no MM
background trader, MM
MM
[image:5.612.69.545.389.633.2]