Objectives.Developing countries with higher health care spending have greater overall utilization of maternal health services than do countries with lower spend-ing. However, the rich tend to disproportionately use these services. We assessed whether redistributive government policies in the context of higher levels of health spending were associated with more-equitable use of skilled birth attendants (doctors, nurses, or midwives) between rich and poor.
Methods.We used data from Demographic and Health Surveys of 45 developing countries and disaggregated by wealth quintile. Multivariable regression analy-ses were used to asanaly-sess the joint effect of higher health care expenditures, the wealth distribution of women’s fifth-grade education (a proxy for redistributive policy environment within the central government) and the overall proportion of women with fifth-grade education (a proxy for female literacy and an indica-tor of governments’ commitment to girls’ education).
Results.We found that utilization of skilled birth attendants was more equi-table when higher health expenditures were accompanied by redistributive ed-ucation policies.
Conclusions.Higher health care expenditures should be accompanied by re-distributive policies to reduce the gap in utilization of skilled birth attendants be-tween poorer and richer women in developing countries. (Am J Public Health.
2008;98:142–147. doi:10.2105/AJPH.2006.104265)
Equity of Skilled Birth Attendant Utilization in Developing
Countries: Financing and Policy Determinants
|
Margaret E. Kruk, MD, MPH, Marta R. Prescott, MPH, and Sandro Galea, MD, DrPHMillennium Development Goal 5, 1 of 8 global development goals agreed to by 190 world leaders in 2000, calls for a 75% reduc-tion in maternal mortality between 1990 and 2015.1,2Maternal mortality is defined as the death of a woman while pregnant or within 42 days of termination of pregnancy from any cause related to the pregnancy.3The lifetime risk of dying in pregnancy or shortly after delivery stands at 1 in 30 000 in Sweden and 1 in 16 in sub-Saharan Africa—perhaps the largest differential between rich and poor countries of any health statistic.4Reduction of maternal mortality by 75% in the highest-burden regions such as sub-Saharan Africa will require a rapid and massive scale up of health systems including the provision of uni-versal skilled birth attendance (by a doctor, nurse, or midwife), referral for complications, and widespread availability of emergency ob-stetric care, such as Caesarian section.5
There is growing focus on the skilled birth attendant, particularly the trained midwife, as the cornerstone of renewed global efforts to reduce maternal mortality.6However, access to skilled birth attendants is limited, particu-larly in countries with the highest maternal mortality. Only 32% of births in sub-Saharan Africa and 35% in South and Southeast Asia—the regions with the highest maternal mortality—are attended by a doctor, nurse, or midwife; this is in stark contrast to universal or near universal use of skilled birth atten-dants in the developed world.6Average uti-lization of skilled attendants was slightly less than 50% in a sample of 40 developing countries that reported standardized data, with much lower levels in rural areas.6
Although utilization of health services is a function of both patient demand and supply, in situations in which health budgets are very low, poor availability of services is a major constraint to utilization. The World Health Or-ganization (WHO) Commission on Macroeco-nomics and Health determined that providing access to a basic package of essential services
costs approximately $35 per capita per year.7
In 2003, only 12 of 46 countries in the WHO Africa region spent this amount or more.8
Higher absolute levels of health spending in-crease overall utilization of health services.9–12
In previous work that used data from 40 de-veloping countries, we have shown that coun-tries with both higher total health spending and higher proportions of government spend-ing on health have greater overall utilization of maternal health services including skilled birth attendants and Caesarian section.13
The international community is increas-ingly interested in effective ways to
strengthen health systems and improve avail-ability and utilization of health services through greater official development assis-tance for health. After decades of declining official development assistance, with the im-petus of the Millennium Development Goals, 16 of 25 donor countries have pledged to in-crease their official development assistance to the international target of 0.7% of gross domestic product by 2015.14Donor countries
have also set up an international policy dialogue on funding and policies required to
achieve the health Millennium Development Goals, including Goal 5.15
Although additional health care spending may help to reduce average maternal mortality ratios in developing countries, thereby decreas-ing the inequity between rich and poor coun-tries, there is increasing concern that this spending may increase inequities between rich and poor groups within the country. For exam-ple, observers in developed and developing countries cite the “inverse care law,” which states that the availability of medical care is often not determined by medical need but by other considerations including socioeconomic status.16This results in a situation in which the
poor who tend to have poorer health out-comes—for example, mortality of children under age 5 in the poorest 20% versus the richest 20% of children was nearly twice as high across 56 countries17—have the least
ac-cess to health services.18–22This is likely a
of Health, as well as factors outside the health system including poor education, transport links, and the status of women.23–26The mounting evidence of inequities in health care has led to discussions in the health policy com-munity and among policymakers in developing countries about the need to adopt a pro-poor approach that explicitly targets the most vulner-able groups in health resource allocations.16
Although evidence suggests that the rich within countries capture more of the benefits of health spending than do the poor, this is not inevitable. Equity in utilization of services between the rich and poor varies among countries at similar levels of health spending but with different policies on redistribution of health care resources. For example, in a sam-ple of 21 industrialized countries, the 2 with-out a policy of universal coverage (United States and Mexico) had the greatest pro-rich inequities in physician visits when adjusted for health need.27Pro-poor policies including conditional cash transfers to the poor to en-courage the use of health services can also reduce historic inequities in health outcomes such as child mortality, as has been demon-strated in several Latin American countries.28
One approach to assessing a country’s com-mitment to redistribution is to examine the equity of utilization of essential services in sectors traditionally considered to be the re-sponsibilities of governments, such as health and education. For the purposes of this paper, redistributive policies are defined as those that achieve equal or higher utilization of ser-vices for poorer compared with richer groups. More-equitable distribution in fifth grade completion, for example, may indicate com-mitment to redistribution within the educa-tion ministry and possibly within the govern-ment as a whole. A redistributive central government policy framework may in turn in-fluence whether health dollars reach the poor. We investigated the extent to which redis-tributive education policies modify the impact of higher health spending on the utilization of skilled birth attendants among the poorest compared with the least poor women in 45 developing countries. The concentration index of fifth grade completion, which measures the degree of inequality in education as a function of wealth, was used as a proxy for the degree of redistribution in education policy.
METHODS
Variables and Data Sources
The dependent variable in this analysis was the utilization of skilled birth attendants by the poorest versus the richest population quintile expressed as a ratio. Wealth quintiles were de-fined as the lowest 20% and the wealthiest 20% of the population ranked on an asset index (e.g., indoor toilet, running water, type of flooring). Utilization of a skilled birth attendant was defined as the percentage of live births that were attended by a doctor, nurse, or mid-wife within 3 years of the date of the survey. A perfectly equitable ratio would be 1, with less equitable ratios (less utilization by the poor than the rich) taking a value below 1. Compar-ison of the health outcomes and health service utilization of lowest to highest income quintiles is standard in the literature.18,22,29The data for
the dependent variable were taken from World Bank Health, Nutrition and Population Round II Reports, which present wealth-disaggregated health statistics.30
These statistics were calculated by MEASURE DHS from the Demographic and Health Surveys (DHS) on the basis of respon-dents’ possession of certain assets (e.g., indoor toilet, running water). These responses were then converted into an asset index that ap-proximates the wealth of that household through principal component analysis.31This
methodology has been widely used to con-duct equity analysis of standard survey data.22,32–34MEASURE DHS is a project
funded by US Agency for International De-velopment and other donors to perform sur-veys in developing countries that can inform policy. Demographic and Health Surveys are administered to a nationally representative sample of 5000 to 30 000 households and use a standard survey instrument to permit comparison of data across countries. The sur-veys used were conducted between 1990 and 2001. In the case of more than 1 survey per country, the most recent survey was used.
Our key independent variable was total health expenditure in 2000 international dollars at purchasing power parity rates. The WHO defines total health expenditure by fi-nancing agent as general government expen-diture plus private expenexpen-diture. General gov-ernment health expenditure comprises
spending by all government entities and in-cludes social insurance schemes and extra-budgetary spending on autonomous health institutions such as university hospitals. This category also includes donor funding that is channeled through the government (e.g., through sector-wide approaches) but excludes off-budget donor funding that is spent directly on discrete projects.35Private health expendi-ture comprises out-of-pocket expendiexpendi-tures or those made by private social insurance, other private insurance, not-for-profit institutions in-cluding nongovernmental organizations, and private firms and corporations.35The data for per capita health expenditures for the years 1998–2004 were taken from the WHO’s na-tional health accounts database.8Because health expenditure data was not routinely tracked by the WHO before 1998, we ac-cessed the World Bank’s World Development Report 1993, which focused on health care fi-nancing, for earlier health expenditure data.36 Other independent variables included pro-portion of the population below national pov-erty line, proportion of women aged 15 to 49 years in the household who completed fifth grade, the concentration index of women who completed fifth grade, and lastly, a 3-way in-teraction term that included the proportion of women who completed fifth grade, distribu-tion of women who completed fifth grade, and total health expenditure.
We included proportion of the population below national poverty line in our models to differentiate between countries with the similar average level of national wealth but different distributions of income. This is a similar ap-proach to that of Anand and Barnighausen.37 The data for percentage of population below national poverty line was obtained from the World Bank’s World Development Indicators online database. Poverty lines are nationally determined cutoffs and so represent different income levels in different countries. National estimates are based on population-weighted estimates from household surveys.30
Second, provision of primary education is highly subject to government policy and the extent to which women complete fifth grade is a measure of the government’s investment in and policies regarding primary education and its outreach to girls. We used the concen-tration index of fifth-grade completion as an indication of the extent of the government’s redistributive or pro-poor policy orientation. The concentration index is a calculation of the cumulative distribution of an outcome (in this case, fifth-grade completion) as a function of the cumulative distribution of the popula-tion ranked by wealth. An index of 0 implies perfect equity, with indices below 0 indicating higher fifth-grade completion rates among the poor and indices above 0 indicating higher rates of completion among the better off. As noted earlier, a more-equitable distribution of primary schooling may suggest a more redis-tributive or pro-poor policy environment within the central government. The propor-tion of women who completed fifth grade and the concentration index of women who com-pleted fifth grade were all taken from the World Bank’s Health, Nutrition, and Popula-tion Country Round II Reports, the same source as for the dependent variable.30
As per Evans et al., we did not include gross domestic product per capita in our final models, because this measure of wealth is highly correlated with absolute amount of health spending, and we found that including it did not change the fundamental associa-tions between independent and dependent variables.40
Based on an a priori hypothesis that alloca-tion of health funds is influenced by the pol-icy environment in which funding decisions are made, we created an interaction term that combined funding and proxy variables for the extent of redistributive policies. We created a 3-way interaction term that used total health expenditure per capita, proportion of women who completed fifth grade, and the concen-tration index of women’s fifth-grade comple-tion. Interaction terms expressed the degree to which 2 or more independent variables exerted a joint influence on the dependent variable, in this case, the ratio of maternal health service utilization by the poor versus the rich. In practice, this means that the rela-tionship between health spending and the
equity of service utilization differs at different average education levels and different distri-butions of education.
Statistical Analysis
We examined an initial set of 56 countries available from the World Bank’s Health, Nu-trition and Population reports that disaggre-gated the utilization variables of interest by wealth quintiles. Nine countries for which values were not available for all independent variables were not included in the analysis. We further eliminated Dominican Republic and Ethiopia because of unreliable values for the concentration index, thus ending with a 45-country sample. (A list of the countries and the years of their surveys is available as a supplement to the online version of this ar-ticle at http://www.ajph.org.) With the excep-tion of Turkey, which is a higher-middle– income country, these countries are all classi-fied by the World Bank as low- or lower-middle–income countries with incomes less than $3465 as calculated by the Atlas method, an approach used to convert local currency to US dollars with a correction for currency fluctuations.41
Data for several of the independent vari-ables of interest were not available for all the years of the DHS surveys used in the analy-sis. Health expenditure data were only avail-able for 1990 (World Bank data) and then from 1998 onward (WHO data). Therefore, for countries with surveys done in 1990 or from 1998 onward, we used data on total health expenditures from the matching year. However, for 16 countries with surveys done between 1991 and 1997, we used an average of 1990 and 1998 health expenditure values for this variable. This method is similar to that used by Wang.42All health expenditures were adjusted to a base year of 2000 to per-mit comparability.
We examined each variable’s distribution and descriptive statistics including means, medians, and ranges. To improve the linear relationship between per capita health expen-diture and our outcomes of interest, we trans-formed this indicator by using a natural log function. We determined bivariate associa-tions between all independent variables and dependent variables. We first created models that included all independent variables except
the interaction term and the concentration of education to isolate the influence of health care expenditure on equity of utilization of skilled birth attendants (lowest quintile to highest quintile ratio) as well as absolute lev-els of utilization by each of the wealth quin-tiles. We then created our final models for the dependent variable of interest (the ratio of utilization of skilled birth attendants in the lowest to the highest income group) that in-cluded all of the independent variables (in-cluding the 3-way interaction term). All mod-els were tested to ensure they did not violate standard assumptions of linear regression with partial regression plots to assess linearity of independent predictors in the full model, quantile to quantile plots, and plots of residu-als to assess homoscedasticity. We used SAS version 9.1 (SAS Institute Inc, Cary, NC) for the analysis.
RESULTS
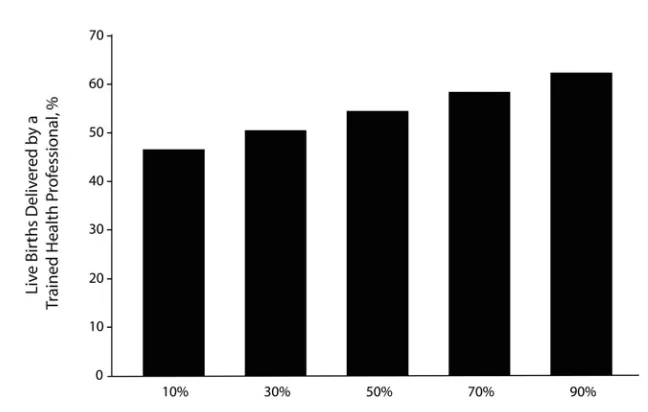
Summary data in Table 1 show the country sample to have overall low health expendi-tures (mean 117.56 year-2000 international dollars at purchasing power parity rates). Table 1 also shows that on average, women in the wealthiest income group had a substan-tially higher rate of utilization of skilled birth attendants than did women in the poorest in-come group. The mean concentration index of education was 0.30, which indicated mod-erate inequity of fifth-grade completion in the country sample. Figure 1 shows graphically that aggregate population utilization rates of skilled birth attendants tended to rise with rising health expenditures across the coun-tries in the sample.
health expenditures, proportion of women who completed fifth grade, and the concentration index of women who completed fifth grade, are shown in Table 2. The variable that emerged as significant in this analysis was the interac-tion term. Total health expenditure per capita was significantly and positively associated with equity of utilization of skilled birth attendants, but this cannot be interpreted separately, be-cause it is included in the interaction term.
The final models explained 58.9% of the vari-ance in the outcome.
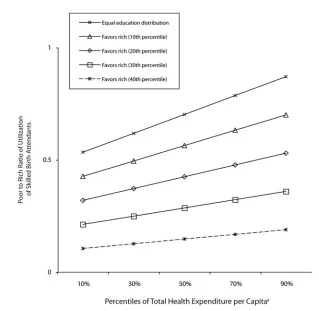
To illustrate the effect of the interaction term on the equity of utilization of skilled birth attendants, we constructed a graph (Figure 2) that shows the modeled results of increased health expenditure at different dis-tributions (concentration indices) of educa-tion. Average population level of fifth grade completion was held constant to permit a
2-dimensional picture. Figure 2 shows that as equity of education rises (concentration index nears zero or perfect equity), the lowest quin-tile to highest quinquin-tile ratio of utilization of skilled birth attendants increases more rapidly (higher slope) with increasing health expendi-ture. At the highest level of government ex-penditures modeled, there were statistically significant differences in equity of skilled birth attendant utilization between the 40th and 20th (and lower) and 30th and 10th per-centiles as well as between the 20th percentile and the distribution that represented equal education among wealth groups. Differences between consecutive scenarios (e.g., 30th and 20th percentiles) were not significant.
DISCUSSION
Previous work has shown that, in the ag-gregate, access to health services in develop-ing countries improves with higher health spending.9–12The so-called “inverse care law,” which contends that the poor who often have the greatest health needs often receive the fewest health services, also has been amply demonstrated.19,22
Our analysis also shows, however, that re-distributive education policy changes this trend and increases equity of utilization of skilled birth attendants. Given that primary education is in most countries funded and provided by the government, we used the dis-tribution of education among socioeconomic groups as a proxy for the extent of redistribu-tive policies within the government. We found that at any given level of health care spending poor women’s use of skilled birth attendants varies substantially, depending on the equity of distribution in education. For instance, in countries with health expenditures at the 50th percentile, the ratio of the poorest quintile’s use of skilled attendants compared with that of the richest quintile can be as low as 0.15 or as high as 0.70. Conversely, as countries spend more on health, the use of skilled birth attendants rises across wealth quintiles. How-ever, the poorest groups only accrue substantial benefits when the policy environment favors redistribution. For example, among countries with equal education distribution, the equity of access to attendants rises dramatically with rising health care spending, whereas in those
a
[image:4.612.51.375.87.293.2]In 2000 international dollars at purchasing power parity rates.
FIGURE 1—Proportion of births with a skilled birth attendant, by percentiles of health expenditures, in 45 developing countries: Demographic and Health Surveys, 1990–2001.
TABLE 1—Descriptive Statistics for Key Variables Used in Analysis of 45 Developing Countries: Demographic and Health Surveys, 1990–2001
Mean (SD) Median Minimum Maximum
Independent variables
Total health expenditure per capitaa 117.56 (103.67) 70.50 22.27 485.00
Proportion of the population below national poverty line, % 42.98 (16.18) 40.00 11.70 72.90
Proportion of women who completed fifth grade, % 52.22 (28.12) 50.00 6.90 99.50
Concentration index of women who completed fifth grade 0.30 (0.23) 0.24 0.001 0.87
Proportion of births assisted by a skilled birth attendant, % 52.02 (26.10) 46.90 12.10 99.00
Dependent variables
Proportion of births assisted by a skilled birth 32.45 (29.10) 19.80 2.60 99.20
attendant—lowest quintile, %
Proportion of births assisted by a skilled birth 83.63 (16.37) 88.50 42.10 100.00
attendant—highest quintile, %
[image:4.612.56.379.414.572.2]TABLE 2—Results of Multivariate Regression Analysis of the Effect of Independent Variables on the Ratio of Utilization of Skilled Birth Attendants Between the Poorest and Richest Quintiles in 45 Developing Countries: Demographic and Health Surveys, 1990–2001
Ratio of Utilization of Skilled Birth Attendant
Independent Variable of Lowest to Highest Wealth Quintile (b)
Total health expenditure per capita 0.13649 (.028)
Proportion below national poverty line –0.00105 (.572)
Proportion of women who completed fifth grade 0.00152 (.708)
Concentration index of women who completed fifth grade –0.22744 (.583)
Three-way interaction among fifth grade education, concentration –0.00591 (.002)
index of education, and total health expenditure per capita
Adjusted R2 0.5886
a
[image:5.612.59.376.511.627.2]In 2000 international dollars at purchasing power parity rates.
FIGURE 2—Poor to rich ratio of skilled birth attendants, by percentile of health expenditure, in 45 developing countries: Demographic and Health Surveys, 1990–2001.
relationship between funding levels and eq-uity of utilization of these services.
The mechanisms by which distribution of education influences the equity of health ser-vice utilization are likely manifold. In a country where the distribution of education is pro-poor (low concentration index), poor women may have increased access to skilled delivery care for 2 reasons. The first is that governments that allocate more education funding and other re-sources to rural and other areas where the poor live would be more likely do the same with health care funding, improving availability of services to poorer women. In addition, a more pro-poor distribution of education would mean that more poor women complete pri-mary education, which would make them more likely to seek skilled birth attendants, because education is an important predictor of health-seeking behavior.37–39Country-level policy analysis would be required to gain insight into the pathways underlying the relationship be-tween funding and redistributive policies to achieve equitable provision of services.
Limitations
There were several important limitations in this study. The sample size was small, and the analysis should be repeated as new reproduc-tive health surveys and better national health accounts data become available. Data for some independent variables were not available for the specific years of some DHS surveys in the sample. Although several year-matching meth-ods did not produce meaningfully different re-sults, exact year matching would have been optimal. Given that the distribution of educa-tion, which gives insight into the decisions of 1 government ministry, is an imperfect approxi-mation of the degree of redistributive govern-ment policies in a country, the analysis would be strengthened by the inclusion of other mea-sures for redistributive policies, ideally from other sectors. Unfortunately this was precluded by lack of data. Other factors not examined here, such as women’s empowerment, may also influence access to services by the poor. Perhaps most importantly, the data available only permit cross-sectional analyses; longitudi-nal work is needed to permit inference about how changes in government expenditure on health and pro-poor policies improve equity of health services utilization.
with regressive education achievement, there is minimal improvement in equity with similar increases in spending.
The optimal scenario is one that combines higher health care expenditures and equitable policies. We modeled the situation of a country with a perfectly equal educational distribution
Conclusions
This work supports the thesis that higher lev-els of health expenditure do not automatically mean substantially greater use of skilled birth attendants by poor women. Poor women’s ac-cess to education, which is in the domain of government policy and reflects a redistributive policy environment, is an important influence on improving the equity of access. Thus, as de-veloping countries work to expand health ser-vices to reach the Millennium Development Goals, more health funding should be accom-panied by strong redistributive policies if those health services are to reach the poor.
About the Authors
Margaret E. Kruk is with the Department of Health Man-agement and Policy, School of Public Health, University of Michigan, Ann Arbor, and the Averting Maternal Death and Disability Program, Columbia University, New York, NY. Marta Prescott and Sandro Galea are with the Depart-ment of Epidemiology, School of Public Health, University of Michigan. Ann Arbor.
Requests for reprints should be sent to Margaret E. Kruk, University of Michigan School of Public Health, Department of Health Management and Policy, 109 Ob-servatory Rd, SPH II M3166, Ann Arbor, MI, 48109 (e-mail: [email protected]).
This article was accepted April 22, 2007.
Contributions
M. E. Kruk and S. Galea jointly formulated the study de-sign and planned the data analysis. M. Prescott led the data analysis and contributed to the study conceptual-ization. All authors participated in interpreting the re-sults. M. E. Kruk led the writing of the article with con-tributions from both coauthors.
Acknowledgments
This work was partly supported by the Averting Mater-nal Death and Disability Program at the Mailman School of Public Health, Columbia University, New York, NY. The Averting Maternal Death and Disability Program is funded by the Bill and Melinda Gates Foundation.
Human Participant Protection
No institutional review board approval was required for this study.
References
1. Road Map Towards the Implementation of the United Nations Millennium Declaration. Report of the Secretary-General.New York, NY: United Nations; Sep-tember 6, 2001. A/56/326.
2. United Nations. UN Millennium Development Goals.
Available at: http://www.un.org/millenniumgoals. Ac-cessed February 22, 2007.
3. Maternal Mortality in 2000: Estimates Developed by WHO, UNICEF and UNFPA.Geneva, Switzerland: World Health Organization; 2004.
4. Ronsmans C, Graham WJ, The Lancet Maternal
Survival Series steering group. Maternal mortality: who, when, where, and why. Lancet.2006;368:1189–1200. 5. Campbell OM, Graham WJ, The Lancet Maternal Survival Series steering group. Strategies for reducing maternal mortality: getting on with what works. Lancet.
2006;368:1284–1299.
6. Koblinsky M, Matthews Z, Hussein J, et al. Going to scale with professional skilled care. Lancet.2006; 368:1377–1386.
7. Commission on Macroeconomics and Health.
Macroeconomics and Health: Investing in Health for Eco-nomic Development. Geneva, Switzerland: World Health Organization; 2001.
8. World Health Organization. World Health Organi-zation Statistical Information System: Core Health Indi-cators. Available at: http://www3.who.int/whosis/core/ core_select_process.cfm. Accessed May 18, 2006. 9. Palmer N, Mueller DH, Gilson L, Mills A, Haines A. Health financing to promote access in low income settings—how much do we know? Lancet.2004;364: 1365–1370.
10. Prata N, Greig F, Walsh J, West A. Ability to pay for maternal health services: what will it take to meet WHO standards? Health Policy.2004;70:163–174. 11. Wang L. Determinants of child mortality in LDCs: empirical findings from demographic and health sur-veys. Health Policy.2003;65:277–299.
12. Wagstaff A. Poverty and health sector inequalities.
Bull World Health Organ. 2002;80:97–105. 13. Kruk ME, Galea S, Prescott M, Freedman LP. Health care financing and utilization of maternal health services in developing countries. Health Policy Plan.
2007;22:303–310.
14. UN Millennium Project website. Available at: http://unmillenniumproject.org/involved/action07.htm. Accessed January 13, 2006.
15. Summary of Discussion and Action Points.Second High-Level Forum on the Health MDGs; December 2–3, 2004; Abuja, Nigeria.
16. Gwatkin DR, Bhuiya A, Victora CG. Making health systems more equitable. Lancet.2004;364:1273–1280. 17. Gwatkin D, Rutstein S, Johnson K, Suliman EA, Wagstaff A. Initial Country-Level Information About Socio-economic Differences in Health, Nutrition, and Population.
2nd ed. Washington, DC: The World Bank; 2003.
18. Chowdhury ME, Ronsmans C, Killewo J, et al. Eq-uity in use of home-based or facility-based skilled ob-stetric care in rural Bangladesh: an observational study.
Lancet.2006;367:327–332.
19. Chowdhury M, Bhuiya A, Mahmud S, Abdus Salem A, Karim F. Who Gets Vaccinated in Bangladesh? The Immunization Divide. Dhaka, Bangladesh: Bangladesh Health Equity Watch; 2000.
20. Habicht J, Kunst AE. Social inequalities in health care services utilisation after eight years of health care reforms: a cross-sectional study of Estonia, 1999. Soc Sci Med.2005;60:777–787.
21. Onwujekwe O. Inequities in healthcare seeking in the treatment of communicable endemic diseases in Southeast Nigeria. Soc Sci Med.2005;61:455–463. 22. Victora CG, Wagstaff A, Schellenberg JA, Gwatkin D, Claeson M, Habicht JP. Applying an equity lens to child health and mortality: more of the same is not enough.
Lancet.2003;362:233–241.
23. Ahmed SM, Adams AM, Chowdhury M, Bhuiya A. Changing health-seeking behaviour in Matlab,
Bangladesh: do development interventions matter?
Health Policy Plan.2003;18:306–315.
24. Ensor T, Cooper S. Overcoming barriers to health service access: influencing the demand side. Health Pol-icy Plan.2004;19:69–79.
25. Ensor T, Dave-Sen P, Ali L, Hossain A, Begum SA, Moral H. Do essential service packages benefit the poor? Preliminary evidence from Bangladesh. Health Policy Plan.2002;17:247–256.
26. Rannan-Eliya R, Somanathan A. Access of the very poor to health services in Asia: evidence on the role of health systems from Equitap [report]. London, England: Department for International Development, Health Systems Resource Centre; 2005.
27. van Doorslaer E, Masseria C, Koolman X, OECD Health Equity Research Group. Inequalities in access to medical care by income in developed countries. CMAJ.
2006;174:177–183.
28. Gwatkin DR. The Current State of Knowledge About Targeting Health Programs to Reach the Poor. Washing-ton, DC: The World Bank; 2000.
29. Gwatkin DR. How much would poor people gain from faster progress towards the Millennium Develop-ment Goals for health? Lancet.2005;365:813–817. 30. Health, Nutrition and Population Country Round II Reports.Washington, DC: World Bank; 2006. 31. Measure DHS STATcompiler [online database]. Available at: http://www.measuredhs.com/statcompiler. Accessed January 17, 2006.
32. Kishor S, Johnson K. Reproductive health and do-mestic violence: are the poorest women uniquely dis-advantaged? Demography.2006;43:293–307. 33. Filmer D, Pritchett LH. Estimating wealth effects without expenditure data—or tears: an application to educational enrollments in states of India. Demography.
2001;38:115–132.
34. Mahmud Khan M, Hotchkiss DR, Berruti AA, Hutchinson PL. Geographic aspects of poverty and health in Tanzania: does living in a poor area matter?
Health Policy Plan.2006;21:110–122.
35. World Health Organization. NHA Glossary. Avail-able at: http://www.who.int/nha/glossary/en/Webmini_ Glossary.pdf. Accessed May 8, 2006.
36. World Bank. World Development Report 1993: In-vesting in Health.New York, NY: Oxford University Press; 1993.
37. Anand S, Barnighausen T. Human resources and health outcomes: cross-country econometric study.
Lancet.2004;364:1603–1609.
38. Subbarao KY, Raney L. Social gains from female education: a cross-national study. Econ Dev Cult Change.
1995;44:105–128.
39. Caldwell JC. Health transition: the cultural, social and behavioural determinants of health in the Third World. Soc Sci Med.1993;36:125–135.
40. Evans DBA, Tandon A, Murray CJ, Lauer JA. Comparative efficiency of national health systems: cross national econometric analysis. BMJ.2001;323: 307–310.
41. World Bank. Country Classification.Available at: http://web.worldbank.org. Accessed January 12, 2006.