R E S E A R C H A R T I C L E
Open Access
Effectiveness of a theory-based
multicomponent intervention
(Movement
Coaching)
on the promotion of total and
domain-specific physical activity: a
randomised controlled trial in low back
pain patients
Andrea Schaller
1,2*, Katja Petrowski
3, Timo-Kolja Pfoertner
4and Ingo Froboese
5Abstract
Background:The promotion of physical activity is a major field in rehabilitation and health promotion but evidence is lacking on what method or strategy works best. Ensuing from this research gap, the present study
compared the effectiveness of a comprehensive theory based multicomponent intervention(Movement Coaching)
to a low intensity intervention in low back pain patients.
Methods:A monocenter randomized controlled trial with three measuring points (T0 = baseline, T1 = six month
follow-up, T2 = twelve month follow-up) was conducted.N= 412 chronic low back pain patients participated. The
Movement Coachinggroup (n = 201) received a comprehensive multicomponent intervention with small-group intervention, phone- and web 2.0-intervention. The low intensity control (n = 211) received two oral presentations that were available for download afterwards. Main outcome was total physical activity measured by Global Physical Activity Questionnaire at 12 month follow-up. Additionally, workplace, leisure time and transportation activities were compared. A split-plot anova was conducted for evaluating repeated measure effects and between group effects. Results:At six and twelve month follow-up there were no statistically significant between group differences in total (T1: p = 0.79; T2: p = 0.30) as well as domain-specific physical activity (workplace (T1: p = 0.16; T2: p = 0.65),
leisure time (T1: p = 0.54; T2: p = 0.89), transportation (T1: p = 0.29; T2: p = 0.77) betweenMovement Coachingand
the control group. In both groups, workplace physical activity showed the highest proportion of total physical
activity. From baseline to twelve month follow-up the results showed a decline in total physical activity (Movement
Coaching:p = 0.04; control group: p = 0.50).
Conclusions:The comprehensiveMovement Coachingintervention was not found to be more effective than a low
intensity intervention in promoting total and domain-specific physical activity in chronic low back pain patients. Trial registration:This study is registered at German Clinical Trials Register (DRKS)-ID: DRKS00004878.
Keywords:Low back pain, Physical activity promotion, Inpatient rehabilitation, Randomized controlled trial
* Correspondence:[email protected] 1
IST-Hochschule University of Applied Sciences, Erkrather Str. 220 a-c, 40233 Düsseldorf, Germany
2Institute of Health Promotion and Clinical Movement Science, German Sport
University Cologne, Am Sportpark Muengersdorf 6, 50933 Cologne, Germany Full list of author information is available at the end of the article
© The Author(s). 2017Open AccessThis article is distributed under the terms of the Creative Commons Attribution 4.0
Background
Physical activity is an independent risk factor for non-communicable diseases [1–3]. Population-based surveys assessing physical activity behavior in Germany indicate that only around 25% to 56% of adult men and 16% to 38% of adult women meet the World Health Organiza-tion’s recommendations on physical activity [4–6]. Data show that especially people with chronic health conditions are considered to be insufficiently physically active [7, 8]. In consequence, the promotion of physical activity is a major field in rehabilitation and health promotion.
The literature shows that comprehensive and high-quality interventions achieve the most significant long-term increases in physical activity behaviour [9]. The didactics of information delivery should be based on valid behavior change methods (e.g., social cogni-tive theory and the transtheoretical (or stages of be-havior) model [10], setting clear and realistic goals and use simple and specific messages [11]. Though face-to-face interventions are considered the most ef-fective approach [11], long-term interventions such as telephone-based interventions, internet-based interven-tions and mailed support are considered to increase sus-tainability [9, 11]. Current research discusses, whether individually tailored interventions are more effective than standard interventions [12, 13].
Assuming that comprehensive, theory based and tai-lored interventions are more effective at promoting physical activity than standard interventions [9], the aim
of the present study was to compare two different inter-ventions: A theory-based multicomponent intervention
(Movement Coaching)comprising three different compo-nents (face-to-face contact, tailored telephone aftercare and internet-based aftercare) and a low-intensity and low cost intervention merely comprising two general presentations on physical activity without theoretical foundation. Owing to the high prevalence of chronic low back pain patients in inpatient orthopaedic rehabilitation in Germany this indication was chosen as a relevant sample for the study.
The research questions assessed were: (1) IsMovement Coachingmore effective in promoting total physical ac-tivity than the low-intensity intervention? (2) Are there differences in leisure time, workplace and/or transporta-tion physical activity between Movement Coaching and low-intensity intervention? (3) What are the predictors of an increase in physical activity?
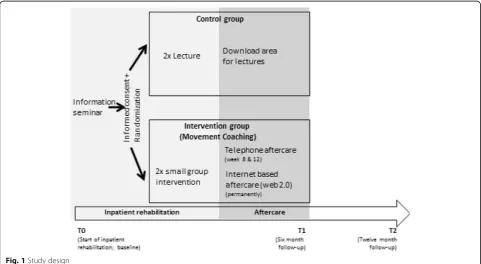
Methods Study design
The study was conducted as a single centre randomised controlled trial with three measuring points (see Fig. 1): T0 = start of inpatient rehabilitation (baseline), T1 = six month follow-up, T2 = twelve month follow-up.
Data were collected by means of a questionnaire on physical activity, sociodemographic and indication-related variables. Following the informational meeting
about the study, patients answered the baseline
[image:2.595.57.539.462.726.2]questionnaire at the beginning of inpatient rehabilitation (T0). The outcome data at six months (T1) and twelve months (T2) were collected using a postal questionnaire. The study was conducted in compliance with the Helsinki Declaration and was approved by the Ethics Committee of the German Sport University Cologne. The study is registered in the German Clinical Trials Register (DRKS00004878). The study protocol for this research project has already been described elsewhere [14].
Study population
Eligibility criteria included: (1) age 18 to 65 years; (2) starting an inpatient medical rehabilitation treatment due to low back pain. Exclusion criteria included: (1) cognitive impairments; (2) insufficient understanding of the German language; (3) previous surgery within the last three months; (4) posttraumatic conditions (e.g., low back pain following an accident); Written informed consent forms were obtained by all partici-pants. Patients were recruited from May 2013 to April 2014. The twelve months follow-up was com-pleted in April 2015.
As far as possible, the study was conducted single-blinded. Patients were informed about two different physical activity promotion programs. These two pro-grams were labelled Movement Coaching A and Move-ment Coaching B. Thus, the patients did not know if they were randomised into the intervention group (Movement Coaching)or into the control group (low tensity intervention). The therapist conducted both in-terventions and was therefore not blinded.
Intervention
The intervention (Movement Coaching) was designed as a multicomponent approach comprising three dif-ferent components: face-to-face contact (small group intervention, three times during inpatient rehabilita-tion), tailored telephone aftercare (8 weeks and 12 weeks after rehabilitation) and an internet-based aftercare (web 2.0 platform; available up to six months after rehabilitation).
The theoretical foundation of the multicomponent intervention was the “Rubicon Model of Action Phases” [15]. Additionally, contextual needs were considered within the concept of the intervention [16]. The main objectives and the theoretical foundations of Movement Coachingwas already published [14].
The face-to-face interventions comprised 60 min each and focused on the formation of intention. The individually tailored telephone aftercare focused on supporting the adoption and maintenance of physical activity in daily routine. Thereby, the contextual needs of the participant (e.g. social acceptance,
sociality, look health) were considered. The web 2.0 internet platform obtained further information on health-enhancing physical activity and offered social support by providing a forum to communicate with other participants and the Coach.
Movement Coaching as well as the control interven-tion were provided by a trained sport scientist with ex-pertise in rehabilitation and health management.
Control group
The control intervention was designed as a low intensity intervention merely comprising two general presenta-tions on health-enhancing physical activity (30 min each) during inpatient rehabilitation which could be down-loaded from a homepage during aftercare.
Differences and similarities of the two intervention strategies as well as the evaluation of the six months follow-up data can be found elsewhere [17].
Randomization
A randomization schedule was drawn up with a com-puterized random number generator. To ensure con-cealment of the treatment allocation, an independent administrative assistant from refonet (rehabilitation re-search network of the German Pension Fund Rhineland) performed and controlled the randomization.
Outcome measures
We chose total physical activity (MET-min/week) as our primary outcome as it was the aim of the inter-vention Movement Coaching to promote physical ac-tivity in all settings of everyday life (workplace, leisure time, transport).
rho = 0.67 to 0.81) [19]. Compared to objective phys-ical activity (accelerometer data), the Global Physphys-ical Activity Questionnaire provided low-to-moderate val-idity and generally acceptable evidence of reliability [22]. As secondary outcomes, the subscales leisure time (MET-min/week), workplace (MET-min/week) and transportation physical activity (MET-min/week) were assessed.
Further variables
Anthropometric and sociodemographic variables include
gender, age (years), body mass index (BMI) and level of education (“lower secondary school” / “higher level of education than lower secondary school”).
Indication-related variables included duration of Low back pain at the beginning of inpatient rehabili-tation (≤12 months / >12 months) and pain intensity during the last four weeks measured by a question from the SF-36 questionnaire (“How much bodily pain have you had during the past 4 weeks?”; answer-ing on a scale from 1 to 6) [23].
Handling missing data
A base case analysis was performed using data restricted to those patients who replied to the postal six months and the twelve months follow-up questionnaire. In this respect, compliance with the intervention was not considered.
For full case analysis, an intention-to-treat analysis imputing missing data of the outcome variables for the patients that did not reply the questionnaire was performed. Since the effectiveness of physical activity promotion is considered controversial [24–26], we
de-cided to take a conservative approach in the
intention-to-treat analysis and imputed based on the principle last observation carried forward (ITTLOCF):
if six months follow-up data were missing, it was as-sumed that the data of the outcome variables were the same as at baseline. If twelve months follow-up data were missing and six months follow-up data were available, it was assumed that the data of the outcome variables at twelve months follow-up were the same as at six months follow-up. If six and twelve month follow-up data were missing, it was assumed that the data of the outcome variables at both meas-uring points were the same as at baseline.
Sample size calculation
To calculate the sample size, we assumed a difference of 360 MET-min/week between the two groups at six and twelve month follow-up, respectively. This corre-sponds to 90 min physical activity with moderate in-tensity which, from the perspective of rehabilitation practitioners, is assumed to be a relevant difference
in order to gain a health enhancing effect of physical activity.
We estimated the variance for the sample size cal-culation from the results of a survey of physical activ-ity in the German population [6]. Sample size was calculated based on a significance level of α = 0.05; power (1-β) = 0.80 and an estimated variance of 1.04. We increased the sample size by 5% because of the high probability for applying a non-parametric test, and we estimated a total of 277 patients for the com-parison of two independent groups. By estimating a loss to follow-up of 35% during the twelve months period, we calculated a total sample size of 372 pa-tients, 186 patients per group, respectively.
Statistical analyses
Means ± standard deviations (SD) and frequency tables (n; %) were calculated to describe the base-case sample at baseline including demographics and anthropometric characteristics. Data were tested on normal distribution by Kolmogorov-Smirnov-Test. Due to the skewed distri-bution of physical activity data, the median, 25% quartile and 75% quartile were also presented. Beyond, the phys-ical activity data were logarithmized to the base of 10 for further analysis.
Differences in the baseline characteristics between the intervention group (Movement Coaching) and the con-trol group (low intensity intervention) were tested using the Mann–Whitney U-test (age, BMI, intensity of pain, leisure time physical activity, workplace physical activity, transport physical activity, total physical activity) and the chi-squared test (gender, education level, duration of low back pain).
For dropout analysis the differences between the pa-tients who replied both, the six months and the twelve months postal follow-up questionnaires, and those patients who did not reply both follow-up
ques-tionnaires the sociodemographic and
indication-specific variables as well as the baseline variables of the outcome were included as independent variables in the equation of a binary logistic regression model for adjusted evaluation.
follow up variables and the baseline physical activity variables (T2-T0). Subsequently, we divided into three groups: “increase of physical activity” (T2-T0 > 0), “no change in physical activity” (T2-T1 = 0), “decrease of physical activity” (T2-T0 < 0). All participants showing “no change in physical ac-tivity” (T2-T1 = 0) were excluded. In our regression model, the change in physical activity (“increase of physical activity” vs. “decrease of physical activity”) was the dependent variable. We included sociodemo-graphic and indication-related variables as well as baseline physical activity in the model.
For all statistical tests, significance level was set at
p< 0.05. The Greenhouse-Geisser values were reported in order to correct violation of sphericity in repeated measure (question 1 and question 2). All analyses were run with IBM SPSS Statistics 24.
Results
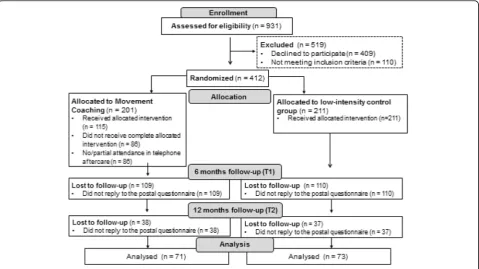
Overall, 912 patients were assessed for eligibility, whereof 412 patients (44%) gave informed consent to the study participation and completed the baseline ques-tionnaire. In the patients enrolled for eligibility, there were no differences in sex between participants and non-participants (p = 0.18) but the study participants were in average younger than the non-participants (p= 0.04). The most frequent reasons mentioned for not participating in the study were concerns in data
protection (n = 99) and insufficient knowledge of the German language [27].
Overall, 35% of the Movement Coaching and 35% of the control group completed both, the six months and the twelve months follow-up questionnaire. Therefore, it was possible to analyse 144 questionnaires. Figure 2 shows the CONSORT flow diagram illustrating the pro-gress through the phases of the present study.
Sample description
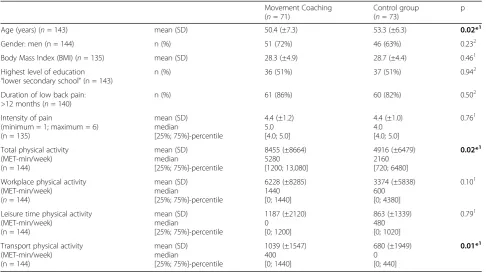
A detailed sample description of the full baseline sample already was given in Schaller et al. [17]. Table 1 shows the baseline variables of the present evaluation including the patients that replied to both, the six and twelve month follow-up questionnaire (base case). The base case sample consisted of 97 men and 47 women. The patients in the intervention group(Movement Coaching)
were significantly younger (p= 0.02) and reported more total (p = 0.02) and transportation physical activity (p= 0.01) than the patients in the control group.
Drop-out analysis
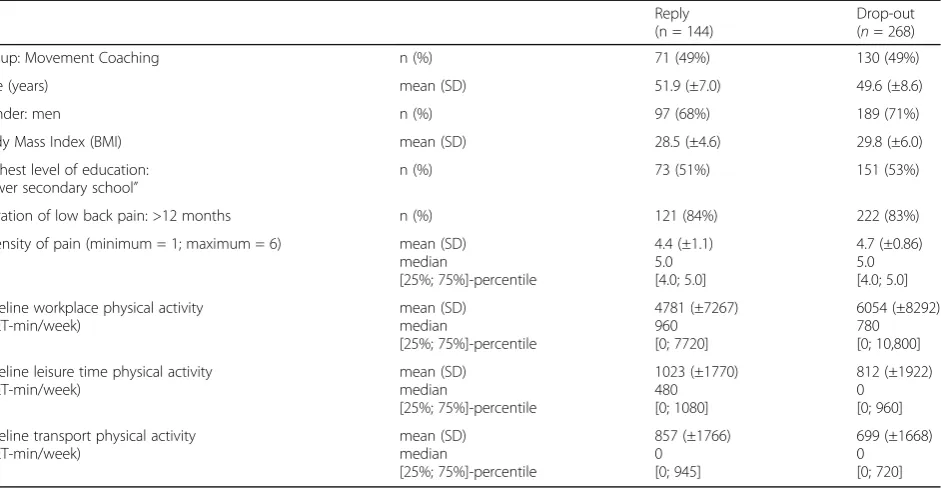
Younger age (p < 0.00; OR = 0.95) and lower leisure time activity (p= 0.03; OR = 0.85) was significantly asso-ciated with a higher chance of not replying to the two postal follow-up questionnaires (see Table 2).
The descriptive baseline variables of the group that re-plied to both questionnaires (reply) and the group that
[image:5.595.59.539.448.717.2]only replied one or none of the follow-up questionnaires (drop out) are presented in Table 3.
Descriptive results and between group effects
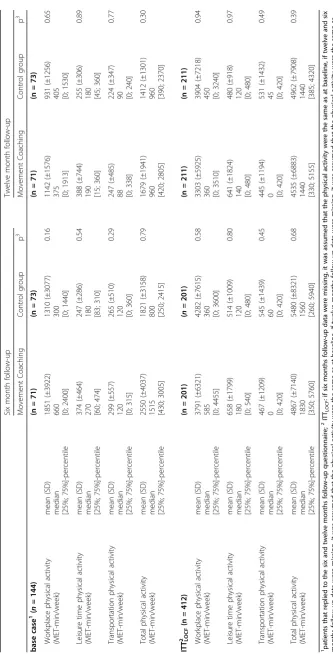
For the descriptive results on physical activity at six and twelve month follow-up see Table 4. Neither at six
month follow-up nor at twelve month follow-up differ-ences in total physical activity or domain-specific
phys-ical activity between Movement Coaching and the
control were significant (Table 4).
[image:6.595.56.543.98.370.2]Figure 3 presents the distribution of the domain spe-cific physical activities at the three measuring points. In
Table 1Baseline characteristics of the sample that responded both, the six months and twelve months follow-up questionnaires
Movement Coaching (n= 71)
Control group (n= 73)
p
Age (years) (n= 143) mean (SD) 50.4 (±7.3) 53.3 (±6.3) 0.02*1
Gender: men (n = 144) n (%) 51 (72%) 46 (63%) 0.232
Body Mass Index (BMI) (n= 135) mean (SD) 28.3 (±4.9) 28.7 (±4.4) 0.461
Highest level of education “lower secondary school”(n = 143)
n (%) 36 (51%) 37 (51%) 0.942
Duration of low back pain: >12 months (n= 140)
n (%) 61 (86%) 60 (82%) 0.502
Intensity of pain
(minimum = 1; maximum = 6) (n = 135)
mean (SD) median
[25%; 75%]-percentile
[image:6.595.54.542.496.717.2]4.4 (±1.2) 5.0 [4.0; 5.0]
4.4 (±1.0) 4.0 [4.0; 5.0]
0.761
Total physical activity (MET-min/week) (n = 144)
mean (SD) median
[25%; 75%]-percentile
8455 (±8664) 5280 [1200; 13,080]
4916 (±6479) 2160 [720; 6480]
0.02*1
Workplace physical activity (MET-min/week)
(n= 144)
mean (SD) median
[25%; 75%]-percentile
6228 (±8285) 1440 [0; 1440]
3374 (±5838) 600 [0; 4380]
0.101
Leisure time physical activity (MET-min/week)
(n = 144)
mean (SD) median
[25%; 75%]-percentile
1187 (±2120) 0
[0; 1200]
863 (±1339) 480 [0; 1020]
0.791
Transport physical activity (MET-min/week) (n = 144)
mean (SD) median
[25%; 75%]-percentile
1039 (±1547) 400 [0; 1440]
680 (±1949) 0
[0; 440]
0.01*1
1
Mann-Whithney-U-Test;2
Pearson-Chi-Quadrat; *significant at significance levelp< 0.05
Table 2Factors influencing dropout
N= 412 Beta SE (β) p OR
Group
“Movement Coaching”vs.“control group” −
0.01 0.24 0.98 0.99
Age (years) −0.05 0.02 < 0.01* 0.95
Gender: male vs. female 0.13 0.26 0.63 1.14
Body Mass Index (BMI) 0.03 0.02 0.20 1.03
Highest level of education
“higher education”vs.“lower secondary school”
−0.32 0.25 0.21 0.73 Duration of low back pain:
“>12 months”vs.“≤12 months”
0.09 0.34 0.80 1.10
Intensity of pain
(minimum = 1; maximum = 6)
0.20 0.13 0.13 1.22
Baseline workplace physical activity
(LgMET-min/week) −
0.04 0.06 0.50 0.96
Baseline leisure time physical activity
(LgMET-min/week) −
0.17 0.08 0.03* 0.85
Baseline transport physical activity
(LgMET-min/week) −
0.05 0.08 0.55 0.96
1
Adjusted binary logistic regression model (0 = reply; 1 = no reply)
*
both groups, workplace physical activity showed the highest proportion of total physical activity at each measuring point (see Fig. 3).
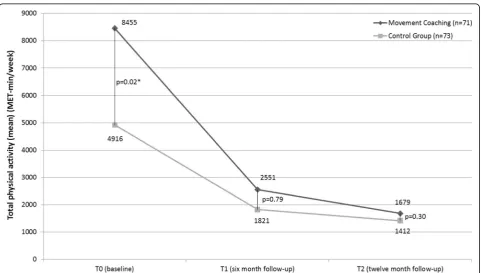
The decline in total physical activity did not signifi-cantly differ between the intervention and the control group. At six (p = 0.79) and twelve month follow-up (0.30) no statistically significant difference between total physical activity in Movement Coaching and the control group could be confirmed (Fig. 4).
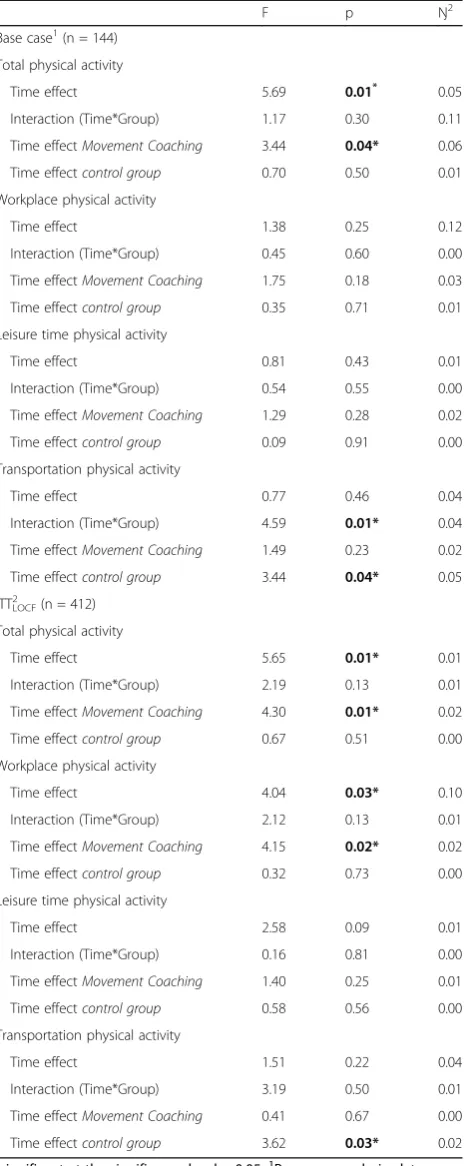
Repeated measure effects
Though group interaction was not statistically significant (p= 0.30) the decline inMovement Coachingfrom base-line to twelve month follow-up (p = 0.04) was statisti-cally significant, whereas the decline in the control group could not be statistically confirmed (p= 0.50). Re-garding domain-specific physical activity no statistically significant changes in course of time could be observed. Intention-to-treat analysis confirmed the result of the base case analysis in regard to the primary outcome total physical activity (Table 5).
Exploratory subgroup analysis
While 29 (23%) participants showed an increase of total physical activity from baseline to twelve month follow-up (T2), 94 (75%) showed a decrease of physical activity (Table 6). Regarding the domain-specific physical activity levels, again, the number of participants showing a de-crease of physical activity in a specific life area was
higher. Comparing the domains, leisure time physical ac-tivity showed the highest number of participants report-ing an increase of physical activity level from baseline to twelve month follow-up (T2) (46 (30%) vs. workplace: 34 (24%), transport: 41 (28%)).
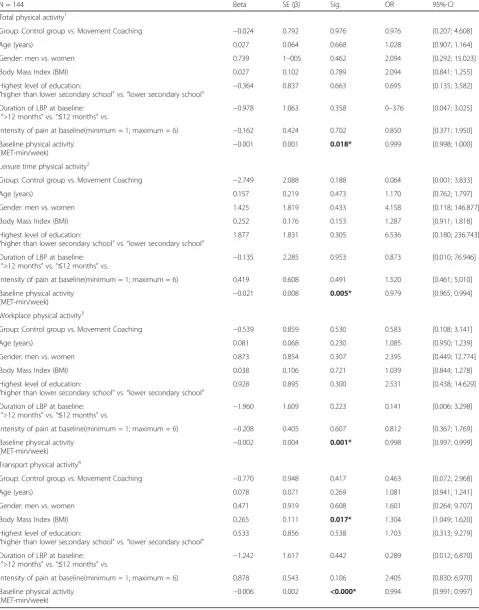
The sociodemographic and indication-specific vari-ables were included in a regression model (see Table 7). The model on change in total physical activity explained 52% of the variation (R2 = 0.52) and the models on domain-specific physical activity explained 70% (work-place physical activity) to 93% (leisure time physical ac-tivity). In all models, baseline physical activity was statistically significantly associated with change in phys-ical activity. None of the sociodemographic and indication-related variables included in the regression model showed an association with change in total phys-ical activity. Regarding domain-specific physphys-ical activity, results showed one single statistically significant associ-ation: a higher body mass index was associated positively
with an increase in transport physical activity
(OR = 1.304; 95% confidence interval: [1.049; 1.620];
p= 0.017). Discussion
[image:7.595.68.539.110.354.2]The results of the present study showed that Movement Coaching was not more effective in promoting total physical activity and domain-specific physical activity compared to a low-intensity control intervention (ques-tion 1 and ques(ques-tion 2). A noticeable aspect of the
Table 3Drop out analysis: Baseline variables of the patients that replied to the six and twelve month follow-up questionnaire (reply) and dropouts
Reply (n = 144)
Drop-out (n= 268)
Group: Movement Coaching n (%) 71 (49%) 130 (49%)
Age (years) mean (SD) 51.9 (±7.0) 49.6 (±8.6)
Gender: men n (%) 97 (68%) 189 (71%)
Body Mass Index (BMI) mean (SD) 28.5 (±4.6) 29.8 (±6.0)
Highest level of education: “lower secondary school”
n (%) 73 (51%) 151 (53%)
Duration of low back pain: >12 months n (%) 121 (84%) 222 (83%)
Intensity of pain (minimum = 1; maximum = 6) mean (SD) median
[25%; 75%]-percentile
4.4 (±1.1) 5.0 [4.0; 5.0]
4.7 (±0.86) 5.0 [4.0; 5.0]
Baseline workplace physical activity (MET-min/week)
mean (SD) median
[25%; 75%]-percentile
4781 (±7267) 960 [0; 7720]
6054 (±8292) 780 [0; 10,800]
Baseline leisure time physical activity (MET-min/week)
mean (SD) median
[25%; 75%]-percentile
1023 (±1770) 480 [0; 1080]
812 (±1922) 0
[0; 960]
Baseline transport physical activity (MET-min/week)
mean (SD) median
[25%; 75%]-percentile
857 (±1766) 0
[0; 945]
699 (±1668) 0
Fig. 3Relative distribution of workplace, leisure time and transportation activities at
[image:9.595.58.542.88.365.2] [image:9.595.58.540.430.703.2]present study is that, in both groups, total physical activ-ity declined significantly during the twelve months follow-up period. Subgroup analyses on predictors of an increase of physical activity from baseline to twelve month follow-up predominantly identified a negative as-sociation between a higher baseline physical activity and a decrease in physical activity during the twelve month period. Besides, a higher body mass index was associated positively with an increase in transport physical activity (question 3).
Even though the results of the present study cannot contribute evidence on a superior strategy in physical ac-tivity promotion it provides novelty to the field of phys-ical activity promotion.
The consideration of physical activity in different areas of life (workplace, leisure time, transportation) provides important implications for the future field of practice concerning physical activity promotion. In retrospect, for example, the comparatively low level of education in our sample would have needed further consideration for tailoring the intervention. As a low level of education tends to be associated with higher workplace activity [28] as well as a lower physical activity during leisure time [28–30] the question arises, whether interventions promoting physical activity targeting persons with low level of education should rather focus on leisure time physical activity instead of total physical activity. The World Health Organization guidelines recommend at least 150 min of moderate-intensity or 75 min of vigorous-intensity aerobic physical activity throughout the week, what corresponds to 600 MET-min/week. The recommendations relate not only to sports, but also in-clude explicitly other leisure time activities, workplace and transport activity [31]. Even though more than 50 % of the sample achieve the recommendations based on total physical activity (see Table 4), workplace physical activity contributed the largest share of physical activity performed. In contrast, the results on leisure time phys-ical activity (see Table 4) indicated that less than 25% of the sample were engaged in leisure time physical activity during leisure time that was consistent with the World Health Organization’s recommendations to achieve health benefits. Ensuing from the highly different pro-portions of workplace and leisure time physical activity in total activity, a discussion about the same effects of workplace, leisure time and transportation physical ac-tivity on health should be started. Therefore, further studies on the association of physical activity in different areas of life and health status are of utmost importance.
[image:10.595.59.297.121.705.2]The decline in physical activity in both groups is as-tonishing at first glance and seems to contradict current research showing moderate evidence for the increase of physical activity through different interventions [9, 25]. A possible explanation for the decline in physical activity
Table 5Repeated measure effects: within subject significance values and group interaction (base case and intention-to-treat analysis (ITT))
F p Ŋ2
Base case1(n = 144)
Total physical activity
Time effect 5.69 0.01* 0.05
Interaction (Time*Group) 1.17 0.30 0.11
Time effectMovement Coaching 3.44 0.04* 0.06
Time effectcontrol group 0.70 0.50 0.01
Workplace physical activity
Time effect 1.38 0.25 0.12
Interaction (Time*Group) 0.45 0.60 0.00
Time effectMovement Coaching 1.75 0.18 0.03
Time effectcontrol group 0.35 0.71 0.01
Leisure time physical activity
Time effect 0.81 0.43 0.01
Interaction (Time*Group) 0.54 0.55 0.00
Time effectMovement Coaching 1.29 0.28 0.02
Time effectcontrol group 0.09 0.91 0.00
Transportation physical activity
Time effect 0.77 0.46 0.04
Interaction (Time*Group) 4.59 0.01* 0.04
Time effectMovement Coaching 1.49 0.23 0.02
Time effectcontrol group 3.44 0.04* 0.05
ITTLOCF2 (n = 412)
Total physical activity
Time effect 5.65 0.01* 0.01
Interaction (Time*Group) 2.19 0.13 0.01
Time effectMovement Coaching 4.30 0.01* 0.02
Time effectcontrol group 0.67 0.51 0.00
Workplace physical activity
Time effect 4.04 0.03* 0.10
Interaction (Time*Group) 2.12 0.13 0.01
Time effectMovement Coaching 4.15 0.02* 0.02
Time effectcontrol group 0.32 0.73 0.00
Leisure time physical activity
Time effect 2.58 0.09 0.01
Interaction (Time*Group) 0.16 0.81 0.00
Time effectMovement Coaching 1.40 0.25 0.01
Time effectcontrol group 0.58 0.56 0.00
Transportation physical activity
Time effect 1.51 0.22 0.04
Interaction (Time*Group) 3.19 0.50 0.01
Time effectMovement Coaching 0.41 0.67 0.00
Time effectcontrol group 3.62 0.03* 0.02
*
might be the difficulties in measuring physical activity by a questionnaire. Literature shows a low correlation of objectively and subjectively measured physical activity [32, 33]. More particularly, a study from van Weering et al. (2011) showed that low back pain patients appear to have even more problems in estimating their physical ac-tivity levels than healthy people [34]. The assumption of an unrealistic self-assessment is supported by an add-itional study with the same sample comparing subjective and objective physical activity. Thereby, no significant correlations between subjective and objective results could be proved and self-reported data showed an over-estimation of 46 min/day (vigorous intensity) to 78 min/ day (moderate intensity) [35]. The second possible ex-planation could be the setting of the intervention, an in-patient rehabilitation center. As the facilitation of self-competence is an integral component of rehabilitation, it is reasonable to assume that patients might have im-proved their self-assessment during the intervention period. By implication, they probably overestimated their physical activity levels at the beginning of inpatient re-habilitation even more.
The results of our exploratory analyses might under-line this assumption as we showed that higher baseunder-line physical activity levels were associated with a decrease in physical activity during the twelve month period. Be-yond, several studies supported the assumption that the overestimation of physical activity might be associated to a higher body mass index [36–38] what might be sup-ported by the association of body mass index and the in-crease of transport physical activity shown in our results. Hence, regarding the practical implications it needs to be considered, that our additional exploratory evaluation only gives information on factors associated with an in-crease in physical activity: no information on the amount of increase and its relevance on health can be given.
Overall, our study includes a number of important strengths. One such strength was the domain-specific measurement of physical activity. Besides this, choosing a low intensity intervention as a control group instead of a non-intervention control group was undoubtedly a strength of the present study. Since it was already as-sumed that the promotion of physical activity exerts an influence, the study went further and compared different
approaches. Based on this, discussions on resource allo-cation in physical activity promotion might be opened. Yet, another methodological strength was the random-ized controlled study design providing high internal validity of results and mostly regarded as the “golden standard”for evaluation in health care.
[image:11.595.54.539.112.180.2]Nevertheless, the present study has several limitations. Certainly, the main limitation of the present study is the high drop-out. This has several consequences regarding the interpretation of the results. First, the findings should be interpreted with caution due to the fact that we did not achieve the calculated sample size and there-fore the study is underpowered to detect the assumed between group differences at six and twelve month follow-up, respectively. Second, due to the associated problem of imputing missing values, especially the re-sults regarding the decline of physical activity during the course of the study should be interpreted very cau-tiously. Third, a potential bias resulting from the non-reply to the postal six and twelve month follow-up ques-tionnaires needs to be taken into account. We were not successful to increase the response rate during the con-duction of the study, eeven though we integrated a re-peated sending of the questionnaire if the participant did not reply within two weeks as well as incentives (all par-ticipants who sent back the postal six/twelve month follow-up questionnaires went into a draw to win a tab-let computer and a voucher for a wellness-weekend). A further limitation is, although, the randomised con-trolled design assures a high internal validity this study design, that it is exposed to several problems in rehabili-tation practice, like the patients recognising that they were receiving different types of treatment. Therefore, the authors cannot completely exclude the possibility of bias resulting from the exchange of information between the patients. To substantiate the robustness of the re-sults missing values were imputed conservatively and an intention-to-treat analysis with last observation carried forward was calculated. This confirmed the robustness of the results in regard to the primary outcome total physical activity. However, the dropout rate in the present study is comparable to other studies evaluating multicomponent lifestyle interventions [39, 40]. A third limitation is the use of a self-reported physical activity
Table 6Change in physical activity: number of participants reporting increase, decrease and no change in physical activity from baseline to twelve month follow-up (T2-T0)
Increase1 No change2 Decrease3
Total physical activity (n = 144) n (%) 29 (23%) 2 (2%) 94 (75%)
Leisure time physical activity (n = 144) n (%) 46 (30%) 23 (15%) 83 (55%)
Workplace physical activity (n = 144) n (%) 34 (24%) 41 (28%) 69 (48%)
Transport physical activity (n = 144) n (%) 41 (28%) 43 (29%) 65 (44%)
1“
increase of physical activity”(T2-T0 > 0);2“
no change in physical activity”(T2-T1 = 0);3“
Table 7Associated factors with an increase of physical activity
N = 144 Beta SE (β) Sig. OR 95%-CI
Total physical activity1
Group: Control group vs. Movement Coaching −0.024 0.792 0.976 0.976 [0.207; 4.608]
Age (years) 0.027 0.064 0.668 1.028 [0.907; 1.164]
Gender: men vs. women 0.739 1–005 0.462 2.094 [0.292; 15.023]
Body Mass Index (BMI) 0.027 0.102 0.789 2.094 [0.841; 1.255]
Highest level of education:
“higher than lower secondary school”vs.“lower secondary school”
−0.364 0.837 0.663 0.695 [0.135; 3.582]
Duration of LBP at baseline:
“>12 months”vs.“≤12 months”vs. −
0.978 1.063 0.358 0–376 [0.047; 3.025]
Intensity of pain at baseline(minimum = 1; maximum = 6) −0.162 0.424 0.702 0.850 [0.371; 1.950] Baseline physical activity
(MET-min/week)
−0.001 0.001 0.018* 0.999 [0.998; 1.000]
Leisure time physical activity2
Group: Control group vs. Movement Coaching −2.749 2.088 0.188 0.064 [0.001; 3.833]
Age (years) 0.157 0.219 0.473 1.170 [0.762; 1.797]
Gender: men vs. women 1.425 1.819 0.433 4.158 [0.118; 146.877]
Body Mass Index (BMI) 0.252 0.176 0.153 1.287 [0.911; 1.818]
Highest level of education:
“higher than lower secondary school”vs.“lower secondary school”
1.877 1.831 0.305 6.536 [0.180; 236.743]
Duration of LBP at baseline: “>12 months”vs.“≤12 months”vs.
−0.135 2.285 0.953 0.873 [0.010; 76.946]
Intensity of pain at baseline(minimum = 1; maximum = 6) 0.419 0.608 0.491 1.520 [0.461; 5.010]
Baseline physical activity (MET-min/week)
−0.021 0.008 0.005* 0.979 [0.965; 0.994]
Workplace physical activity3
Group: Control group vs. Movement Coaching −0.539 0.859 0.530 0.583 [0.108; 3.141]
Age (years) 0.081 0.068 0.230 1.085 [0.950; 1.239]
Gender: men vs. women 0.873 0.854 0.307 2.395 [0.449; 12.774]
Body Mass Index (BMI) 0.038 0.106 0.721 1.039 [0.844; 1.278]
Highest level of education:
“higher than lower secondary school”vs.“lower secondary school”
0.928 0.895 0.300 2.531 [0.438; 14.629]
Duration of LBP at baseline: “>12 months”vs.“≤12 months”vs.
−1.960 1.609 0.223 0.141 [0.006; 3.298]
Intensity of pain at baseline(minimum = 1; maximum = 6) −0.208 0.405 0.607 0.812 [0.367; 1.769] Baseline physical activity
(MET-min/week)
−0.002 0.004 0.001* 0.998 [0.997; 0.999]
Transport physical activity4
Group: Control group vs. Movement Coaching −0.770 0.948 0.417 0.463 [0.072; 2.968]
Age (years) 0.078 0.071 0.269 1.081 [0.941; 1.241]
Gender: men vs. women 0.471 0.919 0.608 1.601 [0.264; 9.707]
Body Mass Index (BMI) 0.265 0.111 0.017* 1.304 [1.049; 1.620]
Highest level of education:
“higher than lower secondary school”vs.“lower secondary school”
0.533 0.856 0.538 1.703 [0.313; 9.279]
Duration of LBP at baseline: “>12 months”vs.“≤12 months”vs.
−1.242 1.617 0.442 0.289 [0.012; 6.870]
Intensity of pain at baseline(minimum = 1; maximum = 6) 0.878 0.543 0.106 2.405 [0.830; 6.970]
Baseline physical activity (MET-min/week)
−0.006 0.002 <0.000* 0.994 [0.991; 0.997]
measurement. Besides a potential bias due to social de-sirable answers and recall bias, validity of physical activ-ity questionnaires needs to be questioned [33]. However, self-administered physical activity questionnaires are the most commonly used as this is the most inexpensive method to use in large-scale studies [41] and no differ-ences in measurement or recall bias between the two groups in the present study were expected.
Conclusion
Our study brings up the important question if less is more in regard to physical activity promotion as our re-sults could not statistically confirm the superiority of the comprehensive multicomponent intervention (Move-ment Coaching) compared to the low intensity control intervention. On the one hand, this contradicts the as-sumption that comprehensive and high-quality interven-tions achieve the most significant long-term increases in physical behaviour [9]. On the other hand, other studies comparing one intervention to another intervention in-stead of a non-intervention control group could not proof the superiority of a specific intervention strategy in physical activity promotion neither [12, 13, 42–45]. As the importance of physical activity promotion in pre-vention and rehabilitation is beyond discussion further research not only on the effectiveness but also cost-effectiveness of different interventions promoting phys-ical activity is needed.
Endnotes
1
The metabolic equivalent (MET) is a physiological measure expressing the expended energy of physical ac-tivities. MET is defined as the ratio of the rate of energy consumption during a specific physical activity to a ref-erence metabolic rate.
Abbreviations
BMI:Body Mass Index; e.g.: exempli gratie/for example; Lg: logarithm; MET: metabolic equivalent;min: minutes; SD: standard deviations; T0: baseline; T1: six month follow-up; T2: twelve month follow-up
Acknowledgements
The authors also thank Aggertalklinik in Engelskirchen, Germany for cooperation and the patients for participating.
Funding
The study was funded by the German Statutory Pension Insurance Rhineland.
Availability of data and materials
The datasets used and/or analysed during the current study are available from the corresponding author on reasonable request.
Authors’contributions
AS conceived the study and design, drafted the manuscript, performed the statistical analysis and edited the manuscript. KP and TKP contributed to editing of manuscript drafts, data analysis and interpretation. IF drafted all versions of the manuscript. All authors read and approved the final manuscript.
Ethics approval and consent to participate
The study was conducted in compliance with the Helsinki Declaration and was approved by the Ethics Committee of the German Sport University Cologne (reference number: 56/12). Written informed consent to participate in this study in the study was provided by all participants.
Consent for publication Not applicable.
Competing interests
All authors declare that they have no competing interests.
Publisher’s Note
Springer Nature remains neutral with regard to jurisdictional claims in published maps and institutional affiliations.
Author details
1IST-Hochschule University of Applied Sciences, Erkrather Str. 220 a-c, 40233
Düsseldorf, Germany.2Institute of Health Promotion and Clinical Movement Science, German Sport University Cologne, Am Sportpark Muengersdorf 6, 50933 Cologne, Germany.3Department of Psychology and Psychotherapy, University Witten/Herdecke, Alfred-Herrhausen-Straße 50, 58448 Witten, Germany.4Institute for Medical Sociology, Health Services Research, and Rehabilitation Science (IMVR), University of Cologne, 50933 Cologne, Germany.5Center for Health through Sport and Movement, German Sport University Cologne, 50933 Cologne, Germany.
Received: 27 June 2017 Accepted: 25 October 2017
References
1. Centers for Disease Control and Prevention. Physical activity and health: a report of the surgeon general. Atlanta: US Department of Health and Human Services, Centers for Disease Control and Prevention, National Center for chronic disease prevention and. Health Promotion. 1996; 2. World Health Organization (WHO). Global Status Report on
Noncommunicable Diseases 2010. Geneva: World Health Organization; 2011. 3. Warburton DE, Nicol CW, Bredin SS. Health benefits of physical activity: the
evidence. CMAJ. 2006;174:801–9. doi:10.1503/cmaj.051351.
4. Krug S, Jordan S, Mensink GBM, Müters S, Finger J, Lampert T. Körperliche Aktivität: Ergebnisse der Studie zur Gesundheit Erwachsener in Deutschland (DEGS1). Bundesgesundheitsblatt Gesundheitsforschung Gesundheitsschutz. 2013;56:765–71. doi:10.1007/s00103-012-1661-6.
5. Lampert T, Mensink G, Müters S. Körperlich-sportliche Aktivität bei Erwachsenen in Deutschland. Ergebnisse der Studie "Gesundheit in Deutschland aktuell 2009". Bundesgesundheitsblatt Gesundheitsforschung Gesundheitsschutz. 2012;55:102–10. doi:10.1007/s00103-011-1401-3. 6. Froboese I, Wallmann B. DKV-Report„Wie gesund lebt Deutschland?“2012.
2012. http://www.dkv.com/gesundheit-dkv-report-leben-106107.html. Accessed 27 Nov 2014.
7. World Health Organization. (WHO). Global health risks: mortality and burden of disease attributable to selected major risks. Geneva, Switzerland: world health. Organization. 2009;
8. Williams NH. Promoting physical activity in primary care. BMJ. 2011;343: d6615. doi:10.1136/bmj.d6615.
9. Müller-Riemenschneider F, Reinhold T, Nocon M, Willich SN. Long-term effectiveness of interventions promoting physical activity: a systematic review. Prev Med. 2008;47:354–68. doi:10.1016/j.ypmed.2008.07.006. 10. Ribeiro MA, Martins M, Carvalho C. The role of physician counceling in improving adherence to physical activity among the general population. Sao Paulo Med J. 2007;125:115–21.
11. Vuori IM, Lavie CJ, Blair SN. Physical activity promotion in the health care system. Mayo Clin Proc. 2013;88:1446–61. doi:10.1016/j.mayocp.2013.08.020. 12. Marcus BH, Lewis BA, Williams DM, Dunsiger S, Jakicic JM, Whiteley JA, et al.
A comparison of internet and print-based physical activity interventions. Arch Intern Med. 2007;167(9):944. doi:10.1001/archinte.167.9.944. 13. Bock BC, Bess HM, Pinto BM, Forsyth LH. Maintenance of physical activity
following an individualized motivationally tailored intervention. Ann Behav Med. 2001;23
low back pain patients. BMC Musculoskelet Disord. 2014;15:391. doi:10.1186/ 1471-2474-15-391.
15. Achtziger A, Gollwitzer PM. Motivation und Volition im Handlungsverlauf. In: Heckhausen J, Heckhausen H, editors. Motivation und Handeln. Heidelberg: Springer-Lehrbuch; 2006. p. 277–302.
16. Deci EL, Ryan RM. The“what”and“why”of goal pursuits: human needs and the self-determination of behavior. Psychol Ing. 2000;11:227–68.
17. Schaller A, Dintsios Ch.-M., Icks A, Reibling N, Froboese I. Promoting Physical Activity in Low Back Pain Patients: Six Months Follow-up of a Randomized Controlled Trial Comparing A Multicomponent Intervention and a Low Intensity Intervention. Clin Rehabil. 2016:in print.
18. Armstrong T, Bull F. Development of the World Health Organization global physical activity questionnaire (GPAQ). J Public Health. 2006;14:66–70. doi: 10.1007/s10389-006-0024-x.
19. Bull FC, Maslin TS, Armstrong T. Global physical activity questionnaire (GPAQ): nine country reliability and validity study. J Phys Act Health. 2009;6: 790–804.
20. Surveillance and Population-Based Prevention, Department of Chronic Diseases and Health Promotion. Global Physical Activity Questionnaire (GPAQ). http://www.who.int/entity/chp/steps/resources/GPAQ_Analysis_ Guide.pdf?ua=1. Accessed 17 Dec 2015.
21. World Health Organization (WHO). Global Physical Activity Surveillance. http://www.who.int/chp/steps/GPAQ/en/. Accessed 13 Apr 2017. 22. Herrmann SD, Heumann KJ, Ananian D, Cheryl A, Ainsworth BE. Validity and
reliability of the global physical activity questionnaire (GPAQ). Meas Phys Educ Exerc Sci. 2013;17:221–35. doi:10.1080/1091367X.2013.805139. 23. Bullinger M, Kirchberger I, Ware J. Der deutsche SF-36 Health Survey:
Übersetzung und psychometrische Testung eines krankheitstibergreifenden Instruments zur Erfassung der gesundheitsbezogenen Lebensqualität. Z f Gesundheitswiss. 1995;3:21–36.
24. Orrow G, Kinmonth A, Sanderson S, Sutton S. Effectiveness of physical activity promotion based in primary care: systematic review and meta-analysis of randomised controlled trials. BMJ. 2012;344:e1389. doi:10.1136/bmj.e1389. 25. Foster C, Hillsdon M, Thorogood M, Kaur A, Wedatilake T. Interventions for
promoting physical activity. Cochrane Database Syst Rev. 2005:CD003180. doi:10.1002/14651858.CD003180.pub2.
26. Lobelo F, Stoutenberg M, Hutber A. The exercise is medicine Global Health initiative: a 2014 update. Br J Sports Med. 2014; doi:10.1136/bjsports-2013-093080.
27. Schaller A, Grieben C. Froboese I. A multilevel approach promoting physical activity among chronic low back pain patients: participation and acceptance 10th Annual Meeting and 5th Conference of HEPA Europe 2014;August. 27–29:70–1.
28. Froboese I, Wallmann-Sperlich B. Der DKV Report„Wie gesund lebt Deutschland?“2016. Düsseldorf: Deutsche Krankenversicherung (DKV); 2016. 29. O'Donoghue G, Perchoux C, Mensah K, Lakerveld J, van der Ploeg H,
Bernaards C, et al. A systematic review of correlates of sedentary behaviour in adults aged 18-65 years: a socio-ecological approach. BMC Public Health. 2016;16:163. doi:10.1186/s12889-016-2841-3.
30. Lampert T, Ungleichheit MAG u s. Eine Herausforderung für Forschung und Politik. G+G Wissenschaft. 2008;8:7–16.
31. World Health Organization (WHO). Global recommendations on physical activity for health.; 2010.
32. Gaede-Illig C, Alfermann D, Zachariae S, Menzel C. Körperliche Aktivität erfassen–ein Vergleich vom IPAQ-SF und dem SenseWear Pro Armband. DZSM. 2014; doi:10.5960/dzsm.2014.130.
33. Prince SA, Adamo KB, Hamel ME, Hardt J, Connor Gorber S, Tremblay M. A comparison of direct versus self-report measures for assessing physical activity in adults: a systematic review. Int J Behav Nutr Phys Act. 2008;5:56. doi:10.1186/1479-5868-5-56.
34. van Weering M, Vollenbroek-Hutten M, Hermens HJ. The relationship between objectively and subjectively measured activity levels in people with chronic low back pain. Clin Rehabil. 2011;25:256–63. doi:10.1177/ 0269215510380828.
35. Schaller A, Rudolf K, Arndt F, Froböse I. Assessing physical activity in low back pain patients after inpatient rehabilitation: a comparison of a direct versus a self-report measure. Phys Rehab Kur Med. 2015:1–8. doi:10.1055/s-0041-111035.
36. Visser M, Brychta RJ, Chen KY, Koster A. Self-reported adherence to the physical activity recommendation and determinants of misperception in older adults. J Aging Phys Act. 2014;22:226–34. doi:10.1123/japa.2012-0219.
37. Watkinson C, van Sluijs EMF, Sutton S, Hardeman W, Corder K, Griffin SJ. Overestimation of physical activity level is associated with lower BMI: a cross-sectional analysis. Int J Behav Nutr Phys Act. 2010;7:68. doi:10.1186/ 1479-5868-7-68.
38. van Sluijs E, Griffin SJ, Poppel v, Nm M. A cross-sectional study of awareness of physical activity: associations with personal, behavioral and psychosocial factors. Int J Behav Nutr Phys Act. 2007;4:53. doi:10.1186/1479-5868-4-53. 39. Golsteijn RHJ, Peels DA, Evers SM, Bolman C, Mudde AN, de VH, Lechner L.
Cost-effectiveness and cost-utility of a web-based or print-delivered tailored intervention to promote physical activity among adults aged over fifty: an economic evaluation of the active plus intervention. Int J Behav Nutr Phys Act. 2014;11:75. doi:10.1186/s12966-014-0122-z.
40. van Wier MF, Dekkers J, Bosmans JE, Heymans MW, Hendriksen IJM, Pronk NP, et al. Economic evaluation of a weight control program with e-mail and telephone counseling among overweight employees: a randomized controlled trial. Int J Behav Nutr Phys Act. 2012;9:112. doi:10.1186/1479-5868-9-112.
41. Golsteijn R, Peels DA, Evers S, Bolman C, Mudde AN, de VH, Lechner L. Cost-effectiveness and cost-utility of a web-based or print-delivered tailored intervention to promote physical activity among adults aged over fifty: an economic evaluation of the active plus intervention. Int J Behav Nutr Phys Act. 2014;11:122. doi:10.1186/s12966-014-0122-z.
42. Bönisch R, Stemmler M, Bremer F, Schweidtmann W, Ohnesorge W, Muthny F. Förderung der Motivation zur körperlichen Aktivität durch telefonische und schriftliche Nachsorge für kardiologische Reha-Patienten - eine randomisierte Kontrollgruppenstudie. Phys Rehab Kur Med. 2013;23:102–9. doi:10.1055/s-0032-1331219.
43. Swinburn BA, Walter LG, Arroll B, Murray WT, Russel DG. The green prescription study: a randomized controlled trial of written exercise advice provided by general practitioners. Am J Public Health. 1998;88:288–91. 44. Romé A, Persson U, Ekdahl C, Gard G. Physical activity on prescription (PAP):
costs and consequences of a randomized, controlled trial in primary healthcare. Scand J Prim Health Care. 2009;27:216–22. doi:10.3109/ 02813430903438734.
45. Sevick MA, Napolitano MA, Papandonatos GD, Gordon AJ, Reiser LM, Marcus BH. Cost-effectiveness of alternative approaches for motivating activity in sedentary adults: results of project STRIDE. Prev Med. 2007;45:54–61. doi:10. 1016/j.ypmed.2007.04.008.
• We accept pre-submission inquiries
• Our selector tool helps you to find the most relevant journal • We provide round the clock customer support
• Convenient online submission • Thorough peer review
• Inclusion in PubMed and all major indexing services • Maximum visibility for your research
Submit your manuscript at www.biomedcentral.com/submit