© 2016, IRJET | Impact Factor value: 4.45 | ISO 9001:2008 Certified Journal
| Page 498
Generating Cross level Rules: An automated approach
Ashok
1, Sonika Dhingra
11
HOD, Dept of Software Engg.,Bhiwani Institute of Technology, Bhiwani, India
1M.Tech Student, Dept of Software Engg.,Bhiwani Institute of Technology, Bhiwani, India
Abstract:A method to discover cross level links between binary attributes in a large ERP data set is proposed. For this we first mine rules at the lowest level and then apply our proposed guidelines to generate cross level rules. Initially Association rules are mined from large data sets using Apriori algorithm. We observe two things. Firstly, rules mined are very large in number and secondly the disadvantages to using confidence as an interestingness measure are seen here. We propose using LBA algorithm. This offers us the advantage of using lift instead of confidence.Once rules are mined, we propose guidelines to generate cross level rules. We implement the LBA algorithm and cross level rule generation guidelines and automate the whole process.The proposed methodologyis illustrated by an industrial application from the automotive industry with more than 90 000 Products each described by more than 30 rare attributes.
Keywords:Data Warehouse, Association Rules, Cross level, Multilevel, Lift
1.
Introduction
:
It has been observed that the company uses different ERP systems in its different locations to store sales data. In other words, there is no common platform where the entire sales data from the different locations can be stored. Implementing a Data Warehouse, DW, provides a common platform for storing this data.
Facts and dimensions form the core of any DW. Each row in a Fact table represents a single event associated with a business process. The information contained within a fact table is typically numeric data. Whereas Facts correspond to events, Dimensions correspond to people, items, or other objects. Dimension tables contain properties about each subject. For example, a Product dimension may contain properties like Product Code, Product Name, Product Price, and Product Category.
While a DW helps decision makers take decisions based on past data, data mining techniques helps in finding future
trends based on past data. Thus, DW data is highly conducive to mining.
Association rules used within a dataset for knowledge discovery and to discover hidden patterns between items in a set could utilize either descriptive or predictive models [1]. As far as the structure of association rules is concerned, we find they have two components across the implication: Left Hand Side (LHS) and Right Hand Side (RHS). The LHS is the antecedent (an item found in the transactions) and the RHS is the consequent (an item that is found in combination with the former).
Several algorithms have been proposed to extract association rules by [2]. The Apriori algorithm proposed by [2] is based on finding frequent support and generation association rule by confidence.The algorithm used Support and confidence as two measures used to find frequent patterns and association rules defined by [1]. Furthermore, it uses pruning technique to find a frequent and association rules.
Two popular approaches to mine association rules at multiple levels are GAR [3] and MLAR[4, 5]. With GAR, deciding on minsup seems to be the difficult issue. Evidently, if its set too high then rules having low level items may not be mined. Setting it too low would result in many association rules. MLAR sets different minsup values for different levels of the hierarchy. With respect to their extension to cross level association rules, MLAR does not support.
© 2016, IRJET | Impact Factor value: 4.45 | ISO 9001:2008 Certified Journal
| Page 499
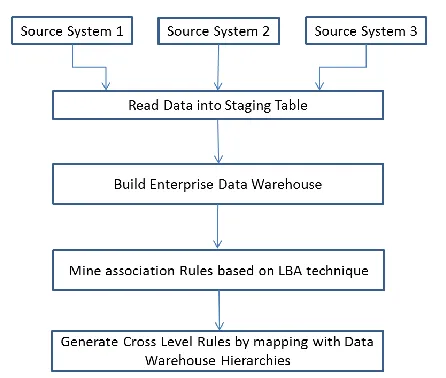
Our overall proposal is as follows:Fig 1: Overall proposed process
Our process starts by extracting data from different source systems into stating tables. For this various transformation processes are applied to staging data in order to standardize it. Finally, cleaned data is loaded into the Data Warehouse.
We implement Link based association rule mining algorithm to mine association rules. LBA takes lift as a parameter into consideration while mining association rules. This differs from the more traditional Apriori ones that take support and confidence into consideration.
Data in the DW is mapped to the lowest leaf level node of a hierarchy. For example, consider a hierarchy of Products having bread, butter at the lowest level,baked products and dairy products at the next level and Food as the top most level. Now, in our system we found that invoice is generated for bread and butter. In other words, invoice is for the lowest level of the hierarchy. This observation led us to develop guidelines to generate cross level association rules from DW hierarchies.
The paper is organized as follows. In the next section we report our process for populating our DW. Subsequently in section 3, we discuss our implementation of LBA and present the results. In section 4, we propose our guidelines for cross level association rules. Section 5 presents our tool
CLRMiner
and its architecture. Finally, we present our conclusion.2.
Building a Data Warehouse
Various Data Warehouse, DW, architectures exist. One of the first architectures was proposed by [6] and [7, 8]. However, subsequently several architectures have been proposed. A summary is shown below:
1. Independent Data Mart architecture: Data is extracted from source systems and stored in staging area where data is cleansed, uniformized. This cleansed data is used to develop independent data marts. These data marts can contain atomic or summarized information. The end user (management) accesses the data mart using various applications.
2. Data Mart Bus architecture[7, 8] with linked dimensional data marts: As with the previous architecture, data is brought from the source systems into a staging area. Data is used to develop dimensionalized data marts with conformed dimensions. Again the data marts can contain atomic or summarized information. The end user accesses the data for decision making using several applications. 3. Hub and Spoke architecture[6]: Data from the source
systems is got into the staging area from where a normalized relational warehouse is constructed. This normalized relational warehouse is the central hub and contains atomic data. The end user can access the atomic data. From the normalized relational warehouse, dependent data marts can be derived that contains summarized or atomic data.
4. Centralized DW architecture: The staging area is populated with data from the source systems. A normalized relational warehouse is constructed and the data is essentially atomic with some summarized data.
5. Federated architecture: Here, legacy DWs, data marts are used and integrated at the logical/physical level based on common data elements. The end user accesses the integrated warehouse for decision making.
[image:2.612.52.275.119.308.2]© 2016, IRJET | Impact Factor value: 4.45 | ISO 9001:2008 Certified Journal
| Page 500
We adopt Inmon’s [6] hub and spoke architecture. Thedata from source systems is extracted using ETL and the DW is built. From the DW, multiple data marts are extracted. These data marts are used by the end user.
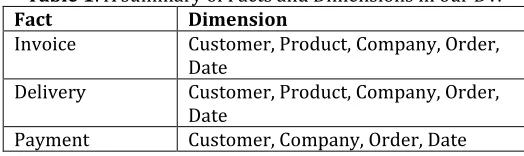
[image:3.612.334.566.88.252.2]Before describing our ETL process, we first present the overview of the conceptual schema. As can be seen in Table 1, there are three facts invoice, delivery and payment. Against each fact the corresponding dimensions are also shown in the Table. Notice, Customer, Product, Company, Order, Date are conformed dimensions. Also, Payment Fact does not have Product as a dimension.
Table 1: A summary of Facts and Dimensions in our DW Fact Dimension
Invoice Customer, Product, Company, Order, Date
Delivery Customer, Product, Company, Order, Date
Payment Customer, Company, Order, Date
Dimension of Table 1 have hierarchies associated with them. Table 2 show hierarchies for Customer, Product and Date
Table 2: Dimensions with their hierarchies Dimensions Hierarchy
Customer Group, Subgroups Product Group , Subgroups Date Year, Quarter, Month
Week, Day
This is multi-step process. The overall process is shown below in Fig 2. As can be seen the left most column of Fig 2shows the target ERP systems as data sources. Data in its raw form is to be extracted from these systems. For this we propose to use Microsoft’s SSIS tool. The necessary packages will be created. Using these packages data will be dumped into the staging database for cleansing.
Fig 2: ETL architecture for Data Warehouse development
The staging database is itself divided into three layers. In fact, the first stage is built to receive the data sent from the SSIS package. Activities like standardization, application of conformity rules etc. will be done in the second and third layers of the staging database. This is shown in the second column of Fig 2.
The output of the third layer of the staging database is cleaned data and in a format that is acceptable to the DW. Thus, as shown in the third column of Fig 2, the DW is populated.
This part is fully automated with a scheduler. Scheduler runs daily as per scheduled time.
3. Association Rule Mining
Before generating association rules, we first review the definitions of the various measures of interestingness.
Confidence rule is measure of correlation between X and Y denoted by Confidence (X => Y).”The Confidence rule is calculated as the ratio between the support of the union between X and Y subsets and support of X” proposed by [10]
Confidence (X => Y) = Supp X∪Y/Supp(X)
Support is an indication of the number of times items appear in the database transactions set. “The Supp(X) is calculated by counting the number of proportion transactions (P) with in the dataset” by [11]
Support (X) => P (X ∪ Y)
[image:3.612.29.291.263.341.2]© 2016, IRJET | Impact Factor value: 4.45 | ISO 9001:2008 Certified Journal
| Page 501
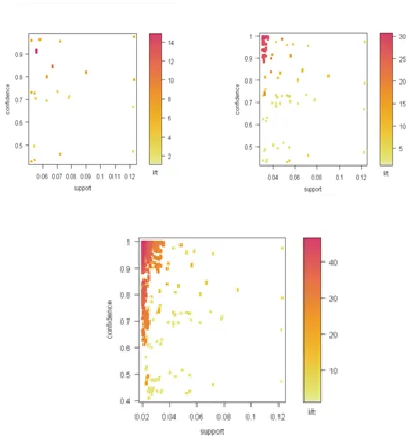
rule as shown in Fig 3. The number of rules generated isshown in Table 3.
Fig 3: Scatter plot of association rules a) with support of 0.05 b) with support of 0.03 c) with support of 0.02
Table 3: Number of rules generated for confidence 40% and varying support
Support Confidence No. of Rules
0.05 0.4 28
0.03 0.4 171
0.02 0.4 5612
We observe from Table 3 that with a higher support of 0.05, too few rules were generated. Reducing support to 0.02, the numbers of rules generated are very high. This means that it is difficult to get meaningful rule from this set. Further, we find the reported problems of using confidence as a measure in our rules.
We apply LBA (Lift Based Algorithm) in order to overcome the disadvantages of Apriori. The LBA algorithm, proposed by [12], uses only support with Lift to extract an association rule. LBA algorithm solves the problem of impact of LHS on RHS in association rules by determining the type of correlation between LHS and RHS.
LBA relies on association rule aggregates for pruning activity. It implies that any two opposite association rules
A→B and B→A have the same lift value or Lift (A→B) = lift (B→A). There is no need to calculate the lift value for each rule because it reduces the time needed to calculate the association rule to half.
LBA (Lift Based Algorithm) proposed by [12] algorithm works as follows:
1) Insert MinSupport.
2) Choose Correlation of Association rule:
a) If choice Positive correlation of Association rules, Insert α. (In this choice lift value > 1+ α)
b) If choice Negative correlation of Association rules, Insert β. (In this choice lift value < 1- β)
c) If choice Independent correlation of Association rules, Insert α and β. (In this choice lift value is between (1- β and 1+ α).
d) Else insert α and β.
3) Press accepts to execute operation (to scan database). 4) Get a frequent item for 1, 2 and three item by sequentially
Check for per value in item:
a) If >= MinSupport added to frequent items b) Else Ignore.
1) Generate candidate association rules from frequent items.
2) Calculate the lift value for each candidate association rules to classify as like:
Lift =Support (LHS ∪ RHS) / (Support LHS) ∗ (Support RHS)
Where A, B, C are the items to generate an association rule. 5) Generate Association Rule for the choosing Correlation of Association rule.
6) If not found result (not found association rules), go to step 1 to edit MinSupport or edit the type of correlation).
[image:4.612.52.259.149.368.2]© 2016, IRJET | Impact Factor value: 4.45 | ISO 9001:2008 Certified Journal
| Page 502
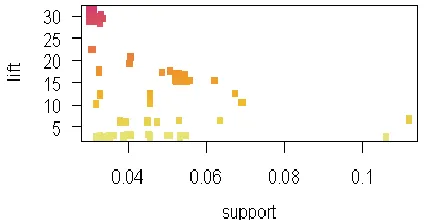
Fig 4:Scatter plot of association rules after applying LBAalgorithm
We conclude that using LBA offers the following advantages. It gives user the power to decide on factors while extracting association rules and their impact on each other. LBA algorithms directly extract association rule and type of correlation without using confidence. We also find that association rules are generated faster.
4.
Obtaining cross level rules from DW
hierarchies
Consider the following single levelhierarchy; Item1 and Item2 are children of ItemParent.
For mining cross level rules, we propose the following guidelines:
I. If Items on the LHS of the implication are children of a parent P while items on RHS are not: Replace LHS with Parent P
Consider a rule {I1, I2 ->I3} where I1, I2 are children of parent P and I3 is not
Cross level rule generated is
{P} ->I3
As a more complicated example, consider a rule {I1, I2, I4 ->I3} where I1, I2 are children of parent P and I3 and I4 are not children
Cross level rule generated is
{P, I4} ->I3
II. Items on the LHS of the implication are children of a parent P and items on RHS are also children of P: Do Not replace set of children with Parent P
Consider a rule {I1, I2 ->I3} where I1, I2, I3 are children of parent P, No cross level rule is generated.
For a multi-level hierarchy like the one shown below:
The following cross level rules are generated
{ItemParent1} ->I3
{Item1, Item2} ->ItemParent2
{Parent1} ->I3
{Item1, Item2} ->Parent2
{ItemParent1} ->Parent2
{Parent1} ->ItemParent2
{Item1, Item2} ->Parent2
5.
CLRMiner (Cross level Rule Miner) an
automated tool
[image:5.612.50.265.142.252.2] [image:5.612.385.513.243.314.2]© 2016, IRJET | Impact Factor value: 4.45 | ISO 9001:2008 Certified Journal
| Page 503
The architecture of our tool is shown in Fig 5. There aretwo components, the Link Based Association Rule Generator and the Cross Level Rule Mapper. The former generates association rules based on Link based on LBA algorithm. The input to the generator is data in the DW. The rules thus generated are stored in the Rules base of Fig 5. The Cross Level Rule mapper has two inputs, the hierarchy from the DW and the rules from the rule base. Based on the guidelines of section IV, cross level rules are stored back in the rule base.
The cross level mapper of Fig 5, applies these guidelines and generates rules. A screen shot of the working is shown below.
In cross level rule mapper possible hierarchies are displayed on left hand side of screen. And rules from the rule base displayed on right side of screen. User selects a rule. .Based on available hierarchies and rules, Cross level rule mapper generate cross level rules and displayed on child window. From child window user selectsdesired rules and after click on approve button selected rules are saved in our Rule base of Fig 5.
6.
Conclusion
:We developed an automated approach to generate cross level association rules. Our starting point was creation of a Data Warehouse. We implemented this using a three level staging area model. Finally, cleaned data is loaded into the Data Warehouse.
Cross level rule generation was done in two steps. First LBA algorithm was applied to generate rules at the lowest level of the hierarchy. After this, we applied our proposed guidelines to generate cross level rules. A tool,
CLRMiner
, was developed that automated the two step process.References
:[1] Soysal, Ömer M. "Association rule mining with mostly associated sequential patterns." Expert Systems with applications 42.5 (2015): 2582-2592. [2] R. Srikant and R. Agrawal, “Mining generalized association rules”, Proc. of the 21st VLDB Conf., Zurich, Switzerland, pp.407–419, Sept. 1995 [3] Agrawal, Rakesh, and RamakrishnanSrikant. "Fast
algorithms for mining association rules." Proc. 20th int. conf. very large data bases, VLDB. Vol. 1215. 1994.
[4] J. Han and Y. Fu, “Discovery of multiple-level association rules from large databases”, Proc. 21st VLDB Conference, Zurich, Switzerland, pp.420– 431, Sept. 1995
[5] J. Han and Y. Fu, “Mining multiple-level association rules in large databases”, IEEE Trans. on Knowledge and Data Engineering, Vol.11, No.5, pp.798–805, Sept. 1999
[6] Inmon, W. H. (2005). Building the data warehouse. John wiley& sons
[7] Kimball, R. (1997). A dimensional modeling manifesto. DBMS, 10(9), 58-70.
[8] Kimball, R., & Ross, M. (2011). The data warehouse toolkit: the complete guide to dimensional modeling. John Wiley & Sons
[9] Ariyachandra, T., & Watson, H. J. (2006). Which data warehouse architecture is most successful?. Business Intelligence Journal, 11(1), 4. [10] Makani, Zaid, Sana Arora, and
PrashastiKanikar. "A Parallel Approach to
Combined Association Rule Mining." International Journal of Computer Applications 62.15 (2013). [11] Chen, Xiao-mei, Chang-ying Wang, and
Han Cao. "Association Rules Mining Based on Minimal Generator of Frequent Closed Itemset." Ecosystem Assessment and Fuzzy Systems Management. Springer International Publishing, 2014. 275-282.