© 2016, IRJET | Impact Factor value: 4.45 | ISO 9001:2008 Certified Journal | Page 187
Performance and exergy analysis of vapour compression refrigeration
system using various alternative of R134a.
Raja Kumar Gond
1, Ravindra Pratap Chaudhary
2, Mohammad Amir Khan
3, Gaurav Jain
41
Student, Dept. of Mechanical engineering, JSSATE, Noida, Uttar Pradesh, India
2Student, Dept. of Mechanical engineering, JSSATE, Noida, Uttar Pradesh, India
3Student, Dept. of Mechanical engineering, JSSATE, Noida, Uttar Pradesh, India
4
Assistant Professor, Dept. of Mechanical Engineering, JSSATE, Noida, Uttar Pradesh, India
---***---Abstract -
An analysis of energy and exergy on a traditional vapour compression refrigeration system using R152a, R290, R600, R600a, R123 and R717 was done theoretically for different typical ratios and their result was compared with standard refrigerant R134a. The result deduced that these alternative refrigerant R600, R600a, R717 and R152a had higher COP and efficiency (exergetic) than R134a for evaporative temperature which range from 248 K to 283 K and condensation temperature 318 K with superheating 10 Kand subcooling 5 K. R600 was found to be a suitable
replacement among others. Other parameter namely refrigerant type, degree of subcooling and superheating on exergetic efficiency, COP, RE, VRC, PTR, total exergy destruction were also investigated for different evaporative temperature.
Key Words: Alternative refrigerants, exergy analysis,
Refrigeration, HC, HFC, HCFC, GWP, ODP.
List of symbols
EXw useful work done on/by system Ѱi Exergy at inlet
Ѱo Exergy at outlet ηII Second law efficiency Qk Heat transfer rate ṁ mass flow rate To Ambient Temperature
Tk temperature of the heat source/sink F factor of safety
List of subscripts
comp Compressor con Condenser dest Destruction eva evaporator isen isentropic
list of abbreviations
VRC Volumetric refrigeration capacity
PTR Power per ton of refrigeration RE Refrigeration Effect
GWP global warming potential ODP ozone depletion potential
1.INTRODUCTION
© 2016, IRJET | Impact Factor value: 4.45 | ISO 9001:2008 Certified Journal | Page 188 their performance for domestic refrigerators. According to
their thermodynamic cycle analysis, the propane/isobutane blend in the composition range from 0.2 to 0.6 mass fraction of propane yields an increase in the coefficient of performance (COP) of up to 2.3% compared to CFC12. Granryd [5] mentioned the possibilities and problems of using hydrocarbons as working fluids in refrigeration equipment. In spite of their flammability specification, it is shown in his paper that alternative refrigerants can be obtained by means of hydrocarbons for energy efficient and environmentally friendly refrigerating equipment and heat pumps. Park et al. [6] tested two pure hydrocarbons and seven mixtures composed of propylene, propane, HFC152a,
[image:2.595.66.532.284.430.2]and dimethyl ether as an alternative to HCFC22 in residential air-conditioners and heat pumps. Their experimental results show that the coefficient of performance (COP) of these mixtures is up to 5.7% higher than that of HCFC22. In this paper pure refrigerants such as R134a, R152a, R290, R600, R600a, R123 and R717 were used to check for the better performance. The parameters such as refrigerant type, degree of subcooling and superheating on the exergetic efficiency, COP, RE, VRC, PTR, total exergy destruction were investigated taking temperature range from 248 K to 283 K and condensation temperature of 318 K with superheating of 10K and subcooling of 5K.
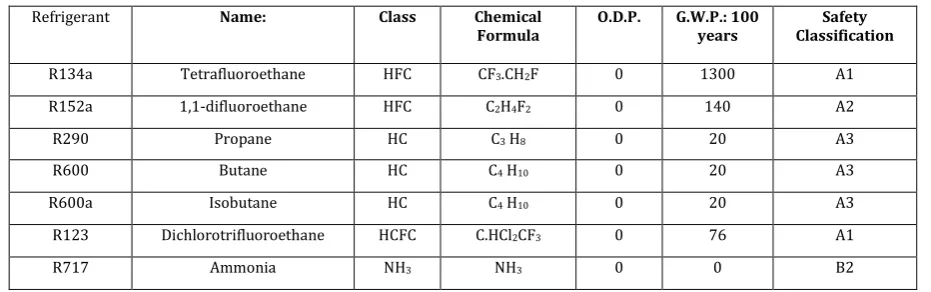
Table 1: Some safety and environmental data of selected refrigerants Refrigerant Name: Class Chemical
Formula O.D.P. G.W.P.: 100 years Classification Safety
R134a Tetrafluoroethane HFC CF3.CH2F 0 1300 A1
R152a 1,1-difluoroethane HFC C2H4F2 0 140 A2
R290 Propane HC C3 H8 0 20 A3
R600 Butane HC C4 H10 0 20 A3
R600a Isobutane HC C4 H10 0 20 A3
R123 Dichlorotrifluoroethane HCFC C.HCl2CF3 0 76 A1
R717 Ammonia NH3 NH3 0 0 B2
2. ANALYSIS
The previous studies were based on analyzing performance of refrigeration system using first law of thermodynamic. But in our analysis we had used both first law of thermodynamic and second law of thermodynamic, allows an improved comprehension of thermodynamic processes by quantifying the effect of irreversibility occurring in the system along with its location.
2.1 Assumptions
To access the performance of selected refrigerants in vapour compression refrigeration cycle, following assumptions were made:
Isentropic efficiency of compressor (𝜂isen) =0.85 Motor Efficiency (𝜂motor) =0.9
Factor of safety (F) =0.8
Mass flow rate of refrigerant (𝑚) =1𝑘𝑔/𝑠 Surrounding temperature (𝑇0) =303K. Evaporator Temp = 248 to 283K Condenser Temp = 298 to 323K Degree of Super heat = 10K Degree of Sub cooling = 5K
Pressure losses in pipelines are neglected. Steady state operations are considered in all components.
2.2 Energy Analysis of VCRS
The following formulae were used for energy analysis of VCRS:
The pressure ratio of the cycle can be seen below as follows
Pressure ratio=Pcon/ Peva
Isentropic compression work of the compressor (Wcomp) is expressed as follows:
Wcomp = h3−h2
The refrigerating effect (RE), in other words, the heat transfer rate of the evaporator (Qevap), is calculated as follows:
RE = Qeva= h1-h6
Power per ton of refrigeration is calculated as follows:
Power per ton of refrigeration (P/TR) = 3.5*Wcomp/RE
Volumetric refrigeration capacity is calculated as follows:
© 2016, IRJET | Impact Factor value: 4.45 | ISO 9001:2008 Certified Journal | Page 189
2.3 Exergetic Analysis of VCRS
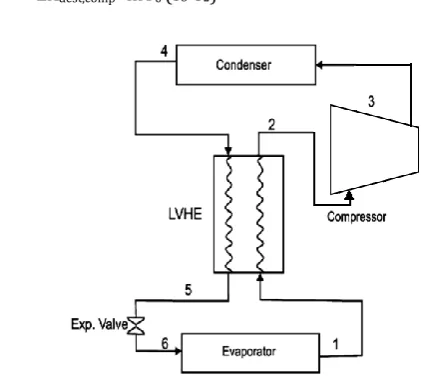
To analyse the possible realistic performance, a detailed exergy analysis of a vapour compression refrigeration system has been carried out by ignoring the kinetic and potential energy change. For steady state flow, the exergy balance for a thermal system can be estimated by using Equation. Cycle diagram of vapour compressor refrigeration is illustrated in Fig. 1, T–S and P–h cycle diagram is presented in Figs. 2 and 3, respectively.
EXw=
The exergy loss for the each component of cycle is given by:
[image:3.595.333.540.106.278.2] Exergy destruction in Compressor EXdest,comp=ṁT0 (s3-s2)
Fig -1: Vapour Compression Refrigeration Cycle
Fig -2: Temperature entropy diagram of VCRS
Fig -3: Pressure enthalpy diagram of VCRS
Exergy destruction in condenser
EXdest,con= (ṁ (h3-h4)-T0 (ṁ (s3-s4))-(1-To/Tk) Qk
Exergy destruction in Heat exchanger
EXdest,HE= (ṁ (h4-h5)-ṁ (h2-h1))-To (ṁ (s4-s5)-ṁ (s2 -s1)
Exergy destruction in throttle valve EXdest,tv = ṁ (h5-h6)-To (ṁ (s5-s6)
Exergy destruction in Evaporator
EXdest,eva=(ṁ(h1-h6)-T0(ṁ(s1-s6))-(1-To/Tk) Qk
The cooling COP of the vapour compression refrigeration system is defined as the heat load of the evaporator per unit power input to the compressor and is expressed as
COP=Qe×F ×ηisen× ηmotor /Wcomp
Total exergy destruction
EXdest,total= EXdest,comp +EXdest,con +EXdest,HE +EXdest,tv +EXdest,eva
Second law efficiency
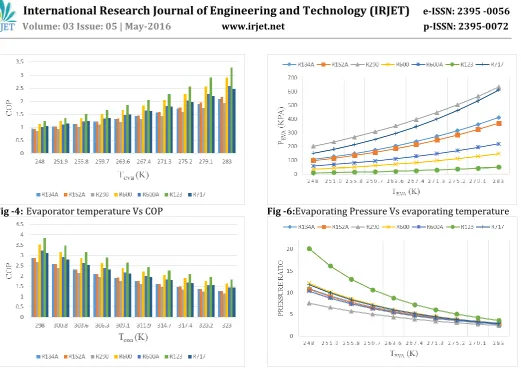
[image:3.595.54.265.318.508.2]© 2016, IRJET | Impact Factor value: 4.45 | ISO 9001:2008 Certified Journal | Page 190 Fig -4:Evaporator temperature Vs COP
Fig -5:Condenser temperature Vs COP
[image:4.595.48.570.45.414.2]Fig -6:Evaporating Pressure Vs evaporating temperature
[image:4.595.42.557.494.721.2]Fig -7:Pressure Ratio Vs evaporating temperature
Table -2:Operation on a standard vapour-compression cycle using R134a and various refrigerants At Tcon=45oC and Teva=-5oC with super heating 10oC and sub cooling 5oC
Refrigerant Peva
(kPa) Pcon
(kPa)
Pressure Ratio
Wcomp
(KJ/kg)
RE
(KJ/kg)
Power per ton refrigeration
VRC
(kJ/m3)
COP ηII Total
Exergy Destruction
R134a 242.1 1156 4.774 58.48 139.4 1.324 1596 1.459 47.15 30.9
R152a 218.8 1034 4.725 95.91 231.6 1.307 1545 1.478 47.71 50.15
R290 404.2 1529 3.784 120 261.6 1.448 2208 1.335 43.58 67.69
R600 84.67 433.2 5.116 92.25 281.1 1.036 618.4 1.865 59.19 37.65
R600a 130.8 598.1 4.571 89.61 243.9 1.16 843.4 1.666 53.27 41.87
R123 25.71 181 7.041 40.47 137.7 0.9277 237.7 2.083 65.05 14.15
© 2016, IRJET | Impact Factor value: 4.45 | ISO 9001:2008 Certified Journal | Page 191 Table-3:Some deviation values of alternative refrigerants from R134a
R134a at Tcon=45oC and Teva=-5oC with super heating 10oC and sub cooling 5oC
Refrigerant Pressure
Ratio (%) Wcomp (%) (%) RE refrigeration(%) Power per ton VRC(%) COP(%) η(%)II
R152a -1.03 64 66.14 -1.28 -3.20 1.30 1.19
R290 -20.74 105.2 87.66 9.37 38.35 -8.50 -7.57
R600 7.17 57.75 101.6 -21.75 -61.25 27.83 25.54
R600a -4.25 53.23 74.96 -12.39 -47.16 14.19 12.98
R123 47.49 -30.8 -1.22 -29.93 -85.11 42.77 37.96
[image:5.595.42.549.121.351.2]R717 5.40 574.9 665.4 -11.78 83.08 13.37 11.88
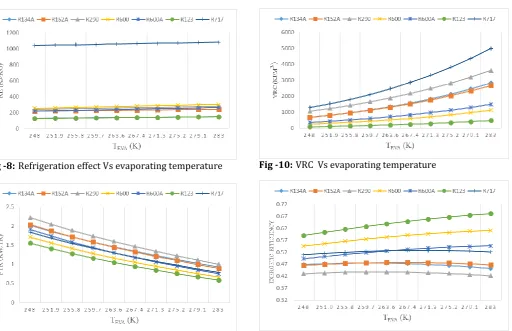
Fig -8:Refrigeration effect Vs evaporating temperature
[image:5.595.50.551.124.327.2]Fig -9:PTR Vs evaporating temperature
Fig -10:VRC Vs evaporating temperature
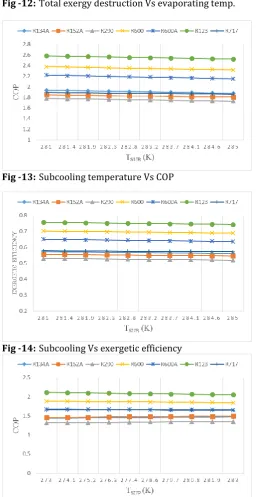
[image:5.595.49.562.387.718.2]© 2016, IRJET | Impact Factor value: 4.45 | ISO 9001:2008 Certified Journal | Page 192 Fig -12:Total exergy destruction Vs evaporating temp.
Fig -13:Subcooling temperature Vs COP
Fig -14:Subcooling Vs exergetic efficiency
Fig -15:Superheating temperature Vs COP
Fig -16:Superheating Vs exergetic efficiency
Fig -17: Compression work Vs evaporating temperature
3. RESULT AND DISCUSSIONS
The changes in evaporating pressure (Pevap) and pressure ratio with the evaporation temperature (Tevap) were shown in fig.6 and 7 for listed refrigerants. The nearest pressure ratio of refrigerant substituted for R134a belongs to R600a whose pressure ratio was 4.25% lower than that of R134a as shown in table 3 for the constant condensation and evaporation temperatures of 318 K and 268 K respectively. In addition to this R152a gives the lowest ratio as substitute for R134a according to the same table. It can be seen that the saturated vapour pressure for R600a and R600 was closer to the vapour pressure curve of the refrigerant R134a than others. Fig 8 and 17 show that the refrigerating effects (RE) increase with increasing evaporation temperature (Tevap) while the compressor power (Wcomp) decreases with increasing Tevap for the constant condensation temperature of 318 K and the evaporation temperature ranging from 248 K to 283 K.
[image:6.595.34.292.253.751.2]© 2016, IRJET | Impact Factor value: 4.45 | ISO 9001:2008 Certified Journal | Page 193 temperature ranging from 248 K to 283 K. The performance
coefficients (COP) of the alternating refrigerants R152a, R600, R600a and R717 were found to be higher than that of R134a. The power per ton of refrigeration with evaporation (Tevap) were shown in fig 9. The variation in volumetric refrigeration capacity were illustrated in fig 10 in order to verify the advantages of cycle. The cycle performance can be improved by the sub cooling and super heating applications.
The variation of exergetic efficiency with evaporating temperature is illustrated in fig 11. It is found that the exergetic efficiency increases to the optimal temperature and after the optimal temperature it will decreases correspondingly. The exergetic efficiency of the alternating refrigerants R600, R600a, R123 and R717 are much higher than the R134a but exergetic efficiency of alternating refrigerant R152a was slightly higher than the R134a.
4. CONCLUSION
The effect of condenser temperature, evaporator temperature, sub cooling and superheating on the seven refrigerants were deduced. During the course of action, it was found that the evaporator temperatures have considerable effects on Evaporating pressure, Pressure ratio, COP, power per ton of refrigeration, volumetric refrigeration capacity, refrigeration effect, exergetic efficiency of the system. In this analysis, it was found that alternative refrigerants for R134a in order of their data which is given in the above table are R600, R600a, R717, R123, R152a and R290.
REFERENCES
[1] S. Wongwises, A. Kamboon, B. Orachon, Experimental investigation of hydrocarbon mixtures to replace HFC-134a in an automotive air conditioning system, Energy Conversion and Management 47 (2006) 1644–1659.
[2] S. Wongwises, N. Chimres, Experimental study of hydrocarbon mixtures to replace HFC-134a in a domestic refrigerator, Energy Conversion and Management 46 (2005) 85–100.
[3] M.A. Hammad, M.A. Alsaad, The use of hydrocarbon mixtures as refrigerants in domestic refrigerators, Applied Thermal Engineering 19 (1999) 1181– 1189.
[4] D. Jung, C.B. Kim, B.H. Lim, H.W. Lee, Testing of a hydrocarbon mixture in domestic refrigerators, ASHRAE Transactions 3 (1996) 1077–1084. [5] E. Granryd, Hydrocarbons—an overview,
International Journal of Refrigeration 24 (2001) 15– 24.
[6] K.J. Park, T. Seo, D. Jung, Performance of alternative refrigerants for residential air-conditioning applications, Applied Energy 84 (2007) 985–991.
[7] Yang, Min-Hsiung, and Rong-Hua Yeh. "Performance
and exergy destruction analyses of optimal subcooling for vapor-compression refrigeration systems." International Journal of Heat and Mass Transfer 87 (2015): 1-10.
[8] Yataganbaba, Alptug, Ali Kilicarslan, and İrfan
Kurtbaş. "Exergy analysis of R1234yf and R1234ze as R134a replacements in a two evaporator vapour compression refrigeration system." International Journal of Refrigeration 60 (2015): 26-37.
[9] Rasti, Mehdi, SeyedFoad Aghamiri, and
Mohammad-Sadegh Hatamipour. "Energy efficiency
enhancement of a domestic refrigerator using R436A and R600a as alternative refrigerants to
R134a." International Journal of Thermal
Sciences 74 (2013): 86-94.
[10] Joybari, Mahmood Mastani, et al. "Exergy analysis
and optimization of R600a as a replacement of
R134a in a domestic refrigerator