© 2016, IRJET | Impact Factor value: 4.45 | ISO 9001:2008 Certified Journal
| Page 2739
Forecasting of Traffic Simulation Model Under Heterogeneous Traffic
Condition
Pratik Raj
1, Dr. B.V.Khode
21
M.Tech Student, Department of Civil Engineering, G. H. Raisoni College of Engg, Nagpur
[email protected]
2
Professor, Department of Civil Engineering, G. H. Raisoni College of Engg, Nagpur
[email protected]
---Abstract- Road Transport in India is an extremely
extensive system, it involves different categories of vehicles like motorize and non-motorized vehicles, animal or human powered vehicles. India has 159.5 million vehicles at present and 16.7 million vehicles added every year. Traffic volume on Indian road increase at a Compound Annual Growth Rate of 10.5% per annum. This paper focuses on traffic forecasting on a multilane highway in India and development of simulation model to study the speed-flow relationship. For this purpose, a strip based approach method is used. A section of 50-meter length was marked as study stretch on National highway-06 ( Nagpur to Amravati). A video recording of this study stretch was done for morning and evening normal weekdays. Traffic volume, space mean speed, vehicle category, vehicle frequency etc were extracted from the video. A speed-flow relation established to evaluate capacity. All the traffic data obtain from the field are put in the simulation model VISSIM. The simulated speed-flow curve is then correlated with the field speed-flow curve. It was found that simulated capacity 3688 PCU/hr/dir and field capacity 3733 PCU/hr/dir. A general equation is established for prediction of traffic volume at National Highway-06 by using previous traffic data. Also, a relationship between capacity and width of the carriageway is obtained follow the second-degree curve.Key Words: Simulation Model, Forecasting, Capacity, Heterogeneous Traffic, Traffic volume, Speed-Flow Equations.
1.INTRODUCTION
The rapid growth of urban area results in an increase in road transportation. The interconnection between two
© 2016, IRJET | Impact Factor value: 4.45 | ISO 9001:2008 Certified Journal
| Page 2740
such traffic condition, it is difficult to measure actualtraffic on the road. The issue of measuring traffic volume in such condition is overcome by converting the traffic as passenger car unit. For measuring the traffic volume, the above mention unit is used. The passenger car unit value is derived by selecting the passenger car as standard vehicles. There are several highway manual in which guideline for highway capacity is given. But in these manual capacity estimation given are on the basis of fixed and regular PCU values of different vehicles type and these estimations are belongs to level road. However even on a level road the PCU values of vehicles changes (V.Thamizh Arasan,2010). Hence, estimation of passenger car unit values of various vehicle class in traffic stream at highway is immensely necessary for design, analysis, planning, operation, regulation and control of traffic on the highway. The road transport system in India is a lack of lane discipline and absence of operation and management experience. Lane discipline plays an important role in roadway capacity. To calculate the roadway capacity of any highway is the biggest censorious issue in highway planning and management. Developing countries like India, the traffic stream has diversity and a wide range of varies traffic. Also, the rapid increase in commercial vehicles and cars on Indian highway, a plenty of two-lane highways have been widening into a four-lane highway. Under National Highway Authority of India, to fulfill the wish of better and free-flow of traffic. Traffic forecasting is the approach of reckoning the no of vehicle or people which are likely to use various transportation amenity in future. For example, a forecast may predict the number of vehicles on highway or bridges, number of ridership on a metro line or railway, number of a passenger arriving and leaving at an airport or it may predict the expected future traffic level for the nation. The forecast is extremely needed in all the areas where the development has to be done. For planning, implementation and development of any transportation system, it is extremely important to know the future traffic flow as they also help in operation, management, and control of traffic. Structure design and geometric design of highway or bridge are principally based on forecast traffic volume and equivalent single axle load. In the present study, the main aim is to forecast the traffic by using previous traffic data and develop a relationship between speed-flow curve.
2. LITERATURE SURVEY
It has been perceiving that simulation modeling is an immensely suitable tool for the design and improvement of the urban freeway system. Before implementation of the simulation model, it facilitates the engineer to vaticinate the outcome of an intent change to the freeway or highway system and asspraise the attribute
© 2016, IRJET | Impact Factor value: 4.45 | ISO 9001:2008 Certified Journal
| Page 2741
parameters of the simulation model are so adjusted sothat the simulation model response same with the measured field condition. Siddharth S.MP et. al,(2013) present a method for sensitive analysis and automatic calibration of VISSIM by using traffic data. ANOVA and elementary method are used for sensitive analysis. There are different studies in which many authors compare the performance of VISSIM software with another computer program and VISSIM is recognize as the best result among them. Arpan Mehar et. al,(2013) presented the applicability of simulation software VISSIM for determination of the capacity of highway under heterogeneous traffic condition. And he observed that VISSIM overestimates the capacity and speed of highway in its original form. But after modification of driver behavior parameters CCO and CC1 the simulated capacity and field capacity almost same. Yadav Anamika et. al,(2014) estimates the capacity of
multilane interurban highway in India. He also develops a
speed-flow relationship of different vehicle category in order to estimate the capacity of the roadway.
3. DESCRIPTION OF SITE AND GEOMETRIC
INFORMATION
The test site for the study is four-lane divided National Highway (Nagpur-Amravati NH-06) in India is selected. A longitudinal stretch of 50 meters is marked on the carriageway of the highway. A video recording of this section is done for morning, evening, and off-peak hour of normal weekdays. Traffic data is then extracted from the video for 5-minute interval and composition. All the vehicles are classified into seven categories namely Car, Bus, Two-Wheeler, Three-Wheeler, LCV, MAV, Truck. Physical dimensions of vehicles and their proportion at highway is shown in table-A-1. The speed of the vehicles in traffic stream is determined by using speed-distance formula at the highway and also, using a stop watch having accuracy 0.01 second. The speed of the different vehicles is shown in table-A-2. Vehicle characteristics at different carriageway shown in table A-3. The PCU values of a vehicles change from vehicle to vehicle and it affects the capacity of the road. In order to know the effect of lane width or carriageway width on the capacity of the road, the capacity of a two-lane road with different carriageway are collected shown in Table.A-4. and Table.A-5. The capacity of road and carriageway are plotted shown in Fig.1.0. From the graph it was found that the relationship between width
of the carriageway and capacity of road is followed by second-degree curve, given bellows:-
C = - 843.4w2 + 1526 w - 61926 ...(A)
R2 = 0.996
Relation (A) can be used to find out the capacity of the roadway. Vehicle composition obtains from the field are shown in Fig.1.1
Table.A-1. Physical dimensions of vehicles and their percentage Traffic Category Length of vehicle s (m) Width of Vehicle s (m) Projected area of Vehicles(m 2) Percentag e of Various Traffic in Traffic Stream.
Car 3.6 1.4 5.04 33.08%
2-Wheeler 1.8 0.6 1.2 7.81%
3-Wheeler 3.2 1.4 4.4 3.59%
Bus 11.4 2.5 28.5 13.26%
LCV 6 1.9 11.4 13.32%
MAV 13.7 2.5 34.25 12.15%
TRUCK 13.6 2.42 32.91 19.83%
Table.A-4. Detail of Carriageway width at a different section.
Sectio
n Highway
Width of the Carriagew
ay (m)
Type of Shoulder (m) Paved Shoulder( m) Earthen Shoulder( m)
1 NH-06 7.2 0.5 1.5
2 NH-07 7 0.5 1.5
3 MSH-260 7.8 0.5 1.2
4 MSH-255 6.8 0.5 1.2
Table.A-5. Capacity of various road with different carriageway.
Highway Carriageway width (m) Capacity(Pcu/h)
MSH-260 7.8 5821
NH-06 7.2 4182
NH-07 7 3688
© 2016, IRJET | Impact Factor value: 4.45 | ISO 9001:2008 Certified Journal
| Page 2742
Fig 1.0 Variation of Capacity of the road with respect to [image:4.595.38.282.421.631.2]the width of the carriageway
Fig 1.1 Vehicle Composition at NH-06.
4
.
DEVELOPMENT
OF
SPEED-FLOW RELATION.
Traffic data are extracted from the video for a 5-minute interval of each vehicle. As we know the capacity and flow are generally measure in terms of passenger car per
hour. Therefore, obtain a number of vehicles are converted into passenger car unit. There are many methods for estimation of passenger car unit of vehicles but all these methods do not use dynamic PCU (Chandra et.al 1997). There are many highway manuals in which guideline for highway capacity is given. But in these manual capacity estimation given are on the basis of fixed PCU values of different vehicles type and these estimations are belongs to level road. However even on a level road the PCU values of vehicles changes (V.Thamizh Arasan,2010). Satish Chandra and Upendra Kumar (2003) gave an equation for estimation of passenger car unit (PCU) of different vehicles and the same equation is used in the present study to find out the Passenger car unit values.
= .... (B)
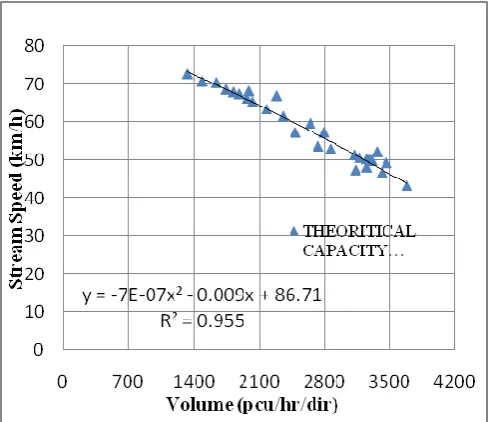
The curve obtains from the field is shown in Fig. 1.2 The field capacity is 3688 pcu/hr/dir or 1844 pcu/hr/lane.
Fig1.2 Speed-Flow curve obtains from field data.
5. SIMULATION MODEL DEVELOPMENT USING
VISSIM
© 2016, IRJET | Impact Factor value: 4.45 | ISO 9001:2008 Certified Journal
| Page 2743
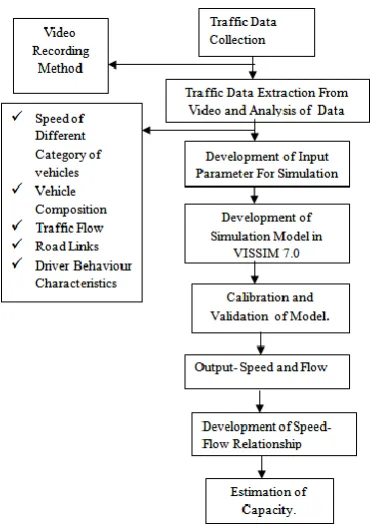
driver behavior characteristics There are ten differentdrivers related parameter CC0 to CC9. Out of which CC0 and CC1 are the highly sensitive parameter and other parameter and CC2 to CC9 have a negligible impact on the capacity of the road (Gomes et. al,2004). Table.A-6. Shows the calibrated values for different driver behavior. Filed data are simulated by using the simulation model which is prepared in computer simulation software vissim 7.0 after modification of some parameter in order to behave heterogeneous traffic. The procedure for model preparation is given in Fig.1.3
.
[image:5.595.315.561.254.460.2]Fig 1.4. Simulated speed-flow curve after calibration.
6. COMPARISION OF THEORETICAL AND SIMULATED SPEED-FLOW CURVE
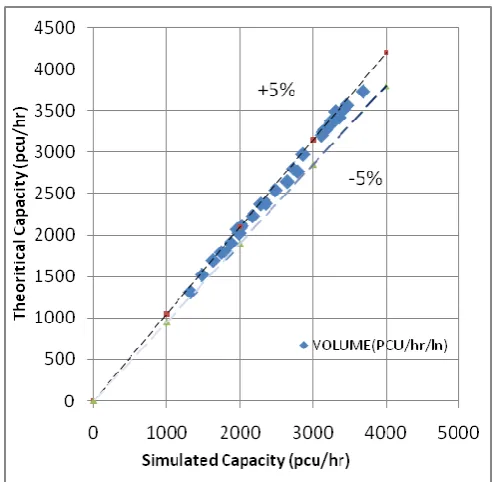
[image:5.595.46.232.259.524.2]A link of 1km stretch and two lanes of 3.5m width was created in Vissim. A travel time section of 50 m was marked at a distance of about 650 m from the vehicle input. Field input was assign to the link. The lateral and overtaking of driver behavior are modifies in order to behave same as in fields. Fig 1.5 Shows the Comparison of Theoretical and Simulated Speed-Flow Curve.
Fig.1.5. Comparison of Theoretical and Simulated Speed-Flow Curve
© 2016, IRJET | Impact Factor value: 4.45 | ISO 9001:2008 Certified Journal
| Page 2744
Fig.1.5. Shows the Variation of Total Number of Cars atNH-06
Fig.1.6. Shows the Variation of Total Number of LCV at NH-06.
Fig.1.7. Shows the Variation of Total Number of buses at NH-06.
© 2016, IRJET | Impact Factor value: 4.45 | ISO 9001:2008 Certified Journal
| Page 2745
Fig.1.9. Shows the Variation of Total Number of Truck atNH-06.
After plotting each category of vehicles, it was found that the number of Cars, LCV, and Buses are increasing with respect to a year while a number of Trucks and MAV, there is sudden decrease and then increase. They do not linearly vary due to traffic condition. So in order to find out the total percentage of traffic growth on NH-06 (Nagpur-Amravati), we need to plot all vehicles in one graph against years. Fig.10. Shows the Variation of Total Number of Vehicles at NH-06 during 2011-2015. A general equation is established from the relationship of no of vehicles and years (Fig.10.) for prediction of future traffic at NH-06. By using this relation, a total number of vehicles till 2030 is carried out which is shown in Fig.10.1.
Fig.10. Shows the Variation of Total Number of Vehicles at NH-06 during 2011-2015.
Fig.10.1 Shows the Total Number of Vehicles at NH-06 till 2030.
After getting the total number of vehicles at NH-06 (Nagpur-Amravati), now for finding traffic volume and capacity we need to convert the number of the vehicle into PCU values because flow and capacity of the road are always measured in pcu/hr. The average speed of vehicles is assumed for the future model. All these filed values are used as an input for the development of simulation model. Fig10.2. Shows the simulated traffic volume at NH-06. simulated capacity obtains from a speed-flow relationship is 6237 PCU/h/Lane.
© 2016, IRJET | Impact Factor value: 4.45 | ISO 9001:2008 Certified Journal
| Page 2746
8. CALIBRATION AND VALIDATION OF VISSIMMODEL
Calibration is the process in which the parameters of the simulation model are so adjusted so that the simulation model response same with the measured field condition. The adjustment parameter is desire speed distribution, vehicles classes, and composition, acceleration, and deceleration of different vehicles, minimum lateral distance, minimum safety distance, driver behavior characteristics (car following behavior and lateral distance) etc. For the development of simulation model in vissim 7.0 Wiedeman 99 cars following model is used. Also, as mention earlier CC0 and CC1 are the highly sensitive parameter and CC2 to CC9 have a negligible impact on the capacity of the road (Gomes et. al,2004). Calibrated values for different driving behavior ( CC0 and CC1 ) are shown in Table.A-6. With these calibrated values, the simulation program was run for 3600 seconds. Before starting the simulation, the model was run for 600 seconds for warm up the simulation program in order to get an accurate result.
Table.A-6.Calibrated Values for different driving behavior
Driving Behaviour in
VISSIM
Assigned Vehicles
Class
Calibrated values (Mehar,2013)
CC0(m) CC1(s)
Car Car 1.5 1.0
Two-Wheeler Two-Wheeler
0.3 0.3
Three-Wheeler Three-Wheeler
1.5 0.9
Heavy Vehicles(HV)
LCV, HCV, MAV ,BUS, Tractor.
2.4 1.4
Validation is the process of checking output receive from the calibrated simulation model in term of simulated values against the field values (Manraj Singh Bains et.al, 2012). Vehicle Composition, Speed and Traffic Volume is assigned to the simulation model and simulation run was performed for 3600 seconds excluding 600 seconds for warm-up the model in order to get accurate results. Fig.(2a). Shows the snap short of a simulation model of four-lane divided highway.
(2a). Shows the snap short of simulation model of four-lane divided Highway
© 2016, IRJET | Impact Factor value: 4.45 | ISO 9001:2008 Certified Journal
| Page 2747
Fig 3.0 Shows the comparison of Theoretical and [image:9.595.308.578.79.351.2]Simulated Average Speed.
Fig 2b Shows the comparison of Theoretical capacity with other researchers.
Fig 2c Shows the comparison of simulated capacity with the other researchers.
[image:9.595.314.561.409.650.2]© 2016, IRJET | Impact Factor value: 4.45 | ISO 9001:2008 Certified Journal
| Page 2748
Fig.(3b) Shows the variation of stream speed usingManual Calculation and microscopic simulation tool VISSIM.
9. CONCLUSION
Simulation Capacity of National Highway-06 is 3733 PCU/h/dr or 1866 PCU/h/Lane and Field capacity is 3688 PCU/h/dr or 1844 PCU/h/Lane. The difference between them is approx 1.5 percent. which prove that the Calibrated values for the model is suitable for simulation of heterogeneous traffic in India.
A general equation is established for prediction of traffic volume at National Highway-06 by using previous traffic data of National Highway Authority of India which shows in Fig.10, 10.1.
It has been observed from the studies, the PCU values of a various class of vehicles increases with increase in lane width due to the various physical dimension of vehicles share the same carriageway and heterogeneity of traffic on Indian Highway.
A relationship is obtained from the traffic data between the capacity of roadway and width of the carriageway. it follows the second-degree curve shown in Fig.1.0
10.NOTATION
The following notation and symbol are used in this paper:-
PCUi = Passenger Car Unit of ith vehicle
VC = Average speed of the Car.(km/h)
Vi = Average speed of the vehicle type i
(km/hr)
AC = Projected Area of Car in Traffic
stream(m2).
Ai = Projected Area of vehicles type i (m2).
w = Total width of the Carriageway(m). C = Capacity of the Highway(pcu/hr).
2-W = Two-wheeler vehicle.
3-W = Three-wheeler vehicle. HV = Heavy vehicles.
LCV = Light Commercial vehicles MAV = Multi Axle vehicles.
REFERENCES
[1] Arpan Mehar et. al, “Highway Capacity Through Vissim Calibrated for Mixed Traffic Conditions" KSCE(Korean Society of Civil Engineers) Journal
of Civil Engineering (2014) 18(2):639-645,2014
[2] Errampalli Madhu et. al,"Estimation of Roadway Capacity of Eight-lane Divided Urban Expressways under Heterogeneous Traffic Through Microscopic Simulation Models" International Journal of Science and Technology Education Research Vol. 1(6), pp. xxx - xxx, November (2011).
[3] Gabriel Gomes et. al, "Congestion Freeway Model Microsimulation Model Using VISSIM" Transportation Research Board, (2004)
[4] Ketan Kumar Varmora, " Use of Vissim in Heterogeneous Traffic Modelling-A Review" Indian Journal of Research Volume : 4 | Issue : 5 | May 2015 ISSN - 2250-1991,9 , (2015)
[5] Manraj Singh Bains et. al, "Modelling of Traffic Flow on Indian Expressways using Simulation Technique" 8th International Conference on
Traffic and Transportation Studies Changsha, China, ELSEVIER August 1–3,(2012)
© 2016, IRJET | Impact Factor value: 4.45 | ISO 9001:2008 Certified Journal
| Page 2749
[7] P. Vedagiri et. al, "Estimation of Saturation flowof Heterogeneous Traffic Using Computer Simulation" 20th European Conference on Modelling and Simulation Wolfgang Borutzky, Alessandra Orsoni, Richard Zobel © ECMS, 2006 ISBN 0-9553018-0-7 / ISBN 0-9553018-1-5 (CD),(2006)
[8] Pan Liu et. al, "Development of a VISSIM Simulation Model for U-Turns at Unsignalized Intersections" ASCE,(2012).
[9] Satish Chandra et. al, "Effect of Lane Width on Capacity under Mixed Traffic Conditions in India" ASCE,(2003)
[10] Satish Chandra et. al," capacity estimation procedure for two-lane roads under mixed traffic conditions "Indian Road Congress Paper No.498, (2004).
[11] Siddharth et. al, "Calibration of VISSIM for Indian Heterogeneous Traffic Conditions" 2nd Conference of Transportation Research Group of India (2nd CTRG), ELSEVIER, (2013)
[12] V. Thamizh Arasan et. al, " Microsimulation Study of Effect of Volume and Road Width on PCU of Vehicles under Heterogeneous Traffic". ASCE,(2010).
[13] Velmurugan et. al, "Roadway Capacity Estimation for Multi-lane Interurban Highways in India" Colloquium on Transportation Systems Engineering and Management CTR, CED, NIT Calicut, India, Paper Id: 140 May 12-13,( 2014).
BIOGRAPHIES
Pratik Raj is a M.Tech scholar in Transportation Engineering Division, Department of Civil Engineering, G.H. Raisoni College of Engineering, Nagpur, Maharashtra, India. His research work is in the area of mixed traffic condition. He also completed research work in the bituminous mix. Mr. Pratik Raj obtains his
undergraduate degree in the areas of Civil Engineering in the year 2014 from R.G.P.V University, Bhopal, Madhya Pradesh.