rapid changes in contact resistance within fractions of a second, called intermittences or short duration discontinuities. Although intermittences have been reported by several authors, they are frequently overlooked in traditional fretting experiments and not much is known about their origin. The present study aims at filling this gap.
A test apparatus has been built to measure the contact voltage-drop profile during an intermittence and fretting ex-periments on tin-plated copper contacts have been carried out. The results lead to a set of requirements for a model to explain intermittency phenomena.
Index Terms—Contact resistance, discontinuity, fretting
corro-sion, intermittence, tin-plating.
I. INTRODUCTION
T
HE TERMINALS in electrical connectors can often move relative to each other due to vibration, differential thermal expansion, stress relaxation and movement of the wiring har-ness due to alternating magnetic fields. This motion is called fretting and is generally cyclic with an amplitude and frequency dependent on the driving mechanism. Fretting is known to be a major cause of contact deterioration and failure, particularly in tin-plated contacts.In previous research [1] the wear-scars on tin-plated contacts taken from vehicles that had undergone reliability tests were an-alyzed. Wear-scars with a length of up to a few hundred microm-eters were found.
The most important performance parameter for electrical connectors, the contact resistance, generally increases slowly with time. Over several hundred or several thousand cycles in a fretting experiment the contact resistance increases from a few milliohms, in the case of a new contact, to in excess of several ohms. Superimposed to this slow increase in contact resistance are rapid changes in contact resistance within fractions of a second, called intermittences or short duration discontinuities. Although the occurrence of short duration discontinuities has been known for a number of years, they are frequently overlooked in traditional fretting experiments, because the commonly used instruments to measure contact resistance are not capable of recording rapid changes in contact resistance.
Manuscript received September 1, 2000; revised March 1, 2001. This work was supported by EPSRC and Jaguar Cars, Ltd. This work was recommended for publication by Associate Editor J. W. McBride upon evaluation of the reivewers’ comments.
The authors are with the School of Engineering Sciences, Mechanical Engi-neering Department, University of Southampton, Southampton SO17 1BJ, U.K. (e-mail: [email protected]; [email protected]).
Publisher Item Identifier S 1521-3331(01)04156-3.
steady state value is called an intermittence, an event or a discon-tinuity. A full explanation of how this definition is implemented is given in [2].
A. Intermittences—Review
Several authors have undertaken investigations into tences. Abbott et al. [3], [4] and Murrell et al. [5] detect intermit-tences using counters and Hübner-Obenland et al. [6] measure the contact resistance profile during intermittences. Skinner [7] and Malucci [8] investigate the topic theoretically.
Abbott et al. [3], [4] define a contact voltage-drop of above a threshold between 0.2 and 0.5 V in a 5 V, 10 mA resistive circuit as an intermittence, using tin-plated contacts from 16-pin edge-card connectors at a normal force of 1 N. They count events as a function of the fretting cycle. The researchers find that once a contact shows discontinuities, for tin from about cycle 40 to 200 in low frequency fretting experiments on, it will continue to do so and the rate of occurrence as well as the duration of events will generally increase with time and static contact resistance. The static contact resistance is defined as a steady state value with the fretting motion stopped. Toward the beginning of the experiments intermittences occur in groups of between two and ten peaks, later this number rapidly increases. Large variations between different samples were found.
Murrell et al. [5] use a 10 mA constant current source with an open circuit voltage of 1 V. The contact is made between a coupon and a rider using copper/copper and tin/tin combina-tions. They define an intermittence as any event exceeding a contact resistance of 10 . The number of events and the du-ration are registered using a counter. It was suggested that inter-mittences of nanosecond duration are probably only possible by a conduction mechanism involving percolation through layers of wear debris.
Hübner-Obenland et al. [6] record the contact resistance pro-file during vibration testing of automotive contacts with various platings. They measure the contact resistance profile using a current that is limited to a maximum of 100 mA and the max-imum contact voltage-drop limited to 20 mV, in order to comply with IEC 512 part 2. The time constant of the measuring system used is 2 s. The researchers find intermittences with durations mainly in the order of several milliseconds. The change in resis-tance during an event is between 2 and 3 orders of magnitude.
Skinner [7] employs classical contact theory to evaluate sev-eral possible mechanisms for obtaining short duration intermit-tent opens or high resistances caused by mechanically induced motion. He concludes that contact bounce caused by vibration is not the cause for intermittences, but particles in the order of
Fig. 1. Relation between contact voltage-drop and maximum a-spot temperature.
magnitude of 25 m between the contact terminals could lead to intermittent disturbances. In his calculations he uses a simpli-fied contact model without taking contact deformation, multiple contact spots or surface films into account.
Malucci [8] proposes a model where cold welded asperities are stretched or sheared during relative motion of the contact terminals. When an asperity breaks, the contact resistance in-creases very suddenly. The subsequent decrease in contact re-sistance is explained by oscillations of asperities in the contact interface that lead to the forming of new -spots elsewhere in the contact.
The work that has been done so far on the intermittency phe-nomenon focuses either on experimental techniques or proposes a model. There is no link between experiment and model and the present study aims at filling this gap.
The most promising way toward explaining the physics behind intermittences appears to be the approach proposed by Hübner-Obenland et al., who record the contact resistance profile rather than just counting the events. Knowledge of the voltage or resistance profile during an intermittence can certainly give some insight. Initial results have been presented [9]–[11] and are extended in this paper.
Most researchers evaluate contact deterioration in terms of contact resistance, although it is well known that the state of matter at the contact interface is better characterized by the asperity temperature and therefore the voltage-drop across the contact interface. A degraded tin-plated contact with a contact resistance of 100 m carrying a current of 100 mA has a max-imum temperature in the contact region of nearly 22 C (if the bulk temperature is 20 C, see calculations below). The same contact in a 2 A circuit would have a maximum temperature of around 430 C, thus melting the contact interface. Consequently in this study the contact voltage-drop rather than the contact re-sistance is monitored.
B. Voltage–Temperature Relation
In a monometallic contact the maximum temperature can be found at the -spot [12] with the well-known voltage–tempera-ture relation
[image:2.612.40.287.62.209.2]where
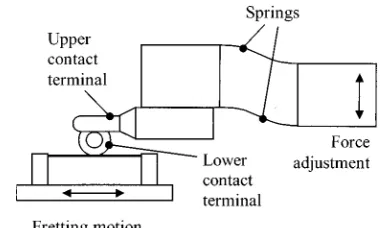
Fig. 2. Schematic diagram of the test rig.
voltage across the contact;
Lorenz constant (2.45 10 V K ); maximum temperature;
bulk temperature.
This relation does not hold for high -spot temperatures, be-cause the Wiedemann–Franz law, used to derive this equation, is violated. However, it serves well as an approximation.
Fig. 1 shows the voltage–temperature relation, assuming a bulk temperature of 20 C. Some temperatures that are im-portant for tin-plated copper contacts are given as a reference.
A) 100 C (70 mV) softening temperature of Sn. B) 190 C (120 mV) softening temperature of Cu. C) 232 C (130 mV) melting temperature of Sn. D) 1080 C (410 mV) SnO decomposes or sublimes. E) 1083 C (430 mV) melting point of Cu.
F) 2270 C (790 mV) boiling point of Sn.
The value for the sublimation temperature of tin–oxide (D) is taken from [13]. All other values are taken from Slade [12]. Voltages in italics (D and F) are approximated using the voltage–temperature relation above, they appear to be slightly too low. The reader should note that values differ depending on the source. Reference [13] gives a value of 2600 C for the boiling point of tin, Holm [14] uses 2507 C.
II. METHODOLOGY
A. Test Apparatus
The test apparatus used in these experiments is described in detail in [2]. There follows a brief summary.
A schematic diagram of the test apparatus that was used in the fretting experiments is shown in Fig. 2.
It consists of two stages that move one contact member in the horizontal direction (fretting motion) and a third stage that moves the second contact member in the vertical direction (force adjustment). The maximum velocity of the movement is 200 m/s, the stages have a position-repeatability of 200 nm. The whole assembly is placed on a vibration isolation work-station in a clean room with the ambient temperature held at constant 20 C.
The contact force and the tangential forces can be measured. This allows for the control of contact force to within mN over several thousand cycles or several days if necessary.
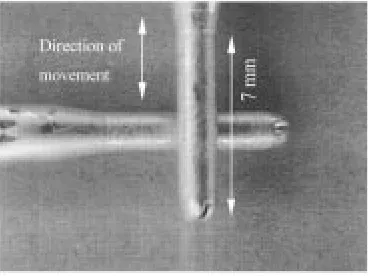
Fig. 3. Crossed-rod configuration used in this study. The lower contact terminal moves in the direction indicated by the arrows.
Fig. 4. Maximum voltage-drop over fretting cycle (F = 500 mN, U =
14:0 V; I 54 mA; v = 0:1 mm/s).
Fig. 5. Number of events per 20 cycles (F = 500 mN, U = 14:0 V;
I 54 mA; v = 0:1 mm/s).
of the power supply and the contact under investigation limits the current to values of between 9 and 92 mA. A digital storage oscilloscope measures the voltage-drop across the contact and the current limiting resistor. Therefore the current through the contact can be calculated. The maximum sampling rate is 1 sample per nanosecond (1 GHz), the oscilloscope has a memory of 50 200 samples per channel. The experimentally obtained rise-time of the measuring arrangement for a series resistor of 1000 is 183 ns, the fall time is 17 ns. Changes in
B. Test Procedure and Samples
The terminals are two tin-plated copper pins (diameter 1.6 mm, plating thickness 2 m) used in a crossed rod configura-tion. They are cleaned with acetone before initial contact. The power supply is switched on after the desired normal force is reached and turned off before the load is removed to ensure arcing does not alter the contact interface.
Fig. 3 shows the geometry of the unlubricated contact termi-nals during the fretting experiment. During fretting the lower contact moves as indicated by the arrows with an amplitude of 200 m and a maximum velocity of 100 m/s.
Most experiments are stopped after 800 cycles, when the tin-plating is worn through to the copper substrate.
III. RESULTS
The results presented follow on from earlier studies [9]–[11] and start here with an overview of the experiments, before fo-cusing on features of individual events or groups of events.
All peaks within a measuring window are counted as a single event. That means, for example in Fig. 8, all peaks count only as one event, because they occur in the same measuring window. This certainly understates the severity of contact deterioration, but it serves very well in quantitatively comparing experiments with each other and relating the findings to other fretting exper-iments as described in the literature.
A. Overview of the Experiments
Fig. 4 shows an overview of the events occurring during 3000 fretting cycles (duration: 12 h, 50 min). It gives the peak value of the voltage-drop across the contact for each event.
The measured contact resistance at the beginning of an exper-iment is low and the contact voltage-drop remains low for about the first 20 to 60 cycles, before the first high voltage-drop events are recorded.
A maximum voltage-drop occurs at cycle 140 with a value of 1.26 V, equivalent to a contact resistance of 32 . Subsequently the peak voltage-drop decreases to millivolt values. Between cycle 260 and 1560 the contact resistance remains low, showing a major increase around cycle 1900.
Fig. 5 shows the rate of events recorded during the same ex-periment. Each column represents the number of events per 20 cycles.
absolute number of events and the cycle where they start and stop.
For the parametric study below, only the first cluster of events that occurs before the 600th cycle is taken into account. An SEM (EDX) analysis has revealed that above approximately 100 fret-ting cycles the contact terminals start to wear through to the copper substrate, at the 600th cycle the tin has virtually disap-peared from the contact interface in all experiments. After about 1500 cycles the copper also shows signs of fretting corrosion, but copper is not the subject of this study.
[image:4.612.303.554.62.219.2]B. Parametric Study
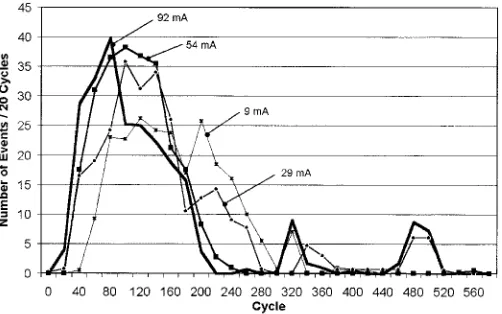
Fig. 6 shows a comparison of the rate of events over the first 600 cycles depending on the current through the contact. The nominal currents are 9 mA, 29 mA, 54 mA and 92 mA with an open circuit voltage of 14 V. Each of the curves represents the average rate of events for four experiments under the same conditions.
It can be observed that the current through the contact has an influence on high voltage-drop events. The higher the current, the earlier the events occur. At a current of 9 mA the first events occur between cycle 40 and 59, while for a higher current of 92 mA, the first events occur already between cycle 20 and 39. The higher the current, the higher the peak rate of events. At 9 mA the peak rate of events occurs between cycle 120 and 139 at an average of 26 events per 20 cycles. For a current of 92 mA the peak rate occurs already between cycle 80 and 79 with an average of 39 events per 20 cycles.
The cycle in which the last event occurs is less well defined. The variation between experiments under the same condition is too great to give definitive figures.
C. Repetition of Events
[image:4.612.305.551.267.436.2]Occasionally consecutive events exhibit a similar shape. Fig. 7 shows 4 events that occurred during four successive cycles. All events were recorded during the same direction of movement with a trigger level of 20 mV and a 20% pretrigger.
The slope of these events is relatively low, in this case about mV/s, and the peak voltage-drop is normally in the mil-livolt range. It should be noted that the reason for these four events being lined up, is not synchronization between the rela-tive position of the contacts and the data acquisition, but merely the effect of a constant trigger level. In general no more than four similar events in consecutive cycles can be found.
D. Events Exceeding the Melting Voltage of Tin
A significant number of the recorded events exceed the soft-ening and melting voltages of tin (70 mV and 130 mV, respec-tively) as Fig. 8, illustrates.
The melting voltage of tin ( 130 mV) appears to play a sig-nificant role in these events. In Fig. 8 the contact voltage-drop frequently returns to 130 mV. The maximum voltage-drop that can be found in Fig. 8 is in the order of 900 mV ( 100 mV).
E. Slope
The slope of the voltage-drop across the contact is generally different below and above the melting voltage, as Fig. 8
[image:4.612.303.552.481.642.2]sug-Fig. 6. Average number of events per 20 cycles for currents of 9 mA, 29 mA, 54 mA, and 92 mA at 14 V supply voltage.
Fig. 7. Repetition of events in consecutive cycles (F = 500 mN, U = 14:0 V;I 54 mA; v = 0:1 mm/s; trigger level: 20 mV).
Fig. 8. Softening and melting voltages are often exceeded (Cycle 145,F =
500 mN, U = 14:0 V; I 54 mA; v = 0:1 mm/s).
gests. The contact voltage-drop changes relatively slowly below the melting voltage of tin. Above the melting voltage the slope is often near vertical.
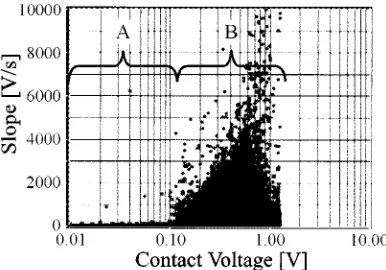
Fig. 9. Slope of all recorded events during one experiment (Cycle1 1 1 1 600,
F = 500 mN, U = 14:0 V; I 54 mA; v = 0:1 mm/s).
To calculate Fig. 9 the raw data for each recorded event is averaged over three consecutive samples. Fig. 8, for example, contains 7530 data points. Each data point is replaced by the average of this data point and its two neighbors to reduce noise. The waveform is then differentiated using the second order dis-crete difference method described by the following formula:
where
array index; sampling interval;
array containing the waveform; array containing the slope.
As long as the contact voltage-drop remains below a certain threshold, in the range denoted A, the slope is relatively low—in the order of a few volts per second. Above this threshold, in the range denoted B, the slope can be considerably steeper—up to a few kv/s. The transition between flat and steep slope is not clearly defined, but appears to coincide with the melting voltage of tin of 130 mV.
F. Voltage/Current Characteristic
As reported in an earlier paper [9] relative motion is not re-quired for intermittences to occur. Several experiments have been conducted with the aim to determine the voltage/current characteristic at a point where the contact resistance is high and no motion is present. The voltage/current characteristic and the absolute resistance values can give an indication on the conduc-tion mechanism in these cases.
[image:5.612.305.552.62.215.2]For this purpose fretting experiments are carried out and stopped after 80 cycles, because from that time on intermit-tences are very likely to occur (see for example Fig. 6). The supply voltage is then reduced to 0.1 V to ensure the melting voltage of tin is not exceeded while searching for a position in the fretting cycle where the contact resistance is high. The fretting motion is resumed at a very low speed of below 10 m/s. As soon as the contact partners are in a position where the contact voltage-drop reaches a significant maximum, the motion is stopped. The constant supply voltage is replaced by a triangular waveform of 10 Hz frequency and a peak-to-peak amplitude of 12 V as shown in Figs. 10–12.
Fig. 10. Supply voltage and contact voltage-drop over time for stationary contacts.
Fig. 11. Supply voltage and contact voltage-drop after 2 min.
Fig. 12. Supply voltage and contact voltage-drop after 4 min (Note the difference in scale).
[image:5.612.321.536.262.394.2] [image:5.612.306.550.428.582.2]Fig. 13 shows the measured voltage/current characteristic for the data presented in Fig. 10. The waveform shows a hysteresis as indicated by the arrows.
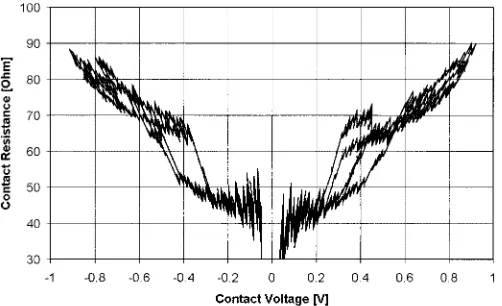
The relation between the resistance and the contact voltage-drop for the data presented in Figs. 10 and 13 is shown in Fig. 14. For small currents it is not possible to calculate reliable resistance values (division by a very small number). For this reason resistance values for currents below 1 mA are omitted from this figure.
The contact resistance is nearly constant, around 45 , for a contact voltage-drop between 200 mV and 200 mV or a cur-rent between 4 mA and 4 mA. The noise, which can be seen for these values, stems from the limited resolution of the oscil-loscope (division by small digital values). The slight difference between the resistance values for positive and negative contact voltage-drops is caused by a small zero-offset in the measuring arrangement.
Between 300 and 400 mV the resistance slowly increases and when the contact voltage-drop reaches 400 mV ( 50 ), the contact voltage rises rapidly by about 100 mV ( step of 10 ). From then on the contact resistance increases over-proportion-ally to a peak of about 90 .
In Fig. 13 the contact voltage appears to increase by 100 mV in a step, while the current seems constant. In fact the current decreases as the voltage across the contact increases, but the reduction in current is only between 1 and 2% and not visible in this graph.
The steps in the recorded voltage waveform can be seen in most events that are recorded without relative motion between the contact partners. In the example shown in Fig. 10 the step at 400 mV contact voltage is very prominent, but at other times the steps occur at different threshold levels. Common among all data is that the steps occur above the melting voltage of tin.
IV. DISCUSSION
This section highlights the findings of the experiments and their consequences for a model to describe intermittences.
A. Overview of the Experiments
High voltage-drop events rarely occur as single events, as Figs. 4 and 5 show. There are times when a great number of events occur, while at other times over periods of several hun-dred cycles the contact voltage-drop is low and nearly constant. A high rate of events coincides with a high maximum voltage-drop, supporting the findings of Abbott et al.who state that the rate of occurrence and the duration of events generally increase with static contact resistance.
[image:6.612.303.554.249.402.2]Contrary to the results presented by Abbott et al. [3], [4] and Murrell et al. [5] the contact resistance decreases in the ex-periments presented here above approximately 200 fretting cy-cles to values that are expected for new contacts. An elemental analysis of the contact areas reveals that the tin-plating starts to wear through after about 100 fretting cycles and is com-pletely worn through after about 600 cycles. Similar behavior has been reported by Antler et al. [15] and Aukland et al. [16] for tin–lead-plated copper contacts, though it is not clear, why
Fig. 13. Voltage/current characteristic for a stationary contact.
Fig. 14. Resistance/voltage characteristic for a stationary contact.
wear-through does not occur in the experiments by Abbott et al. and Murrell et al.
The link between static contact resistance and intermittences leads to the conclusion that the area of electrical contact needs to be small at the time when a discontinuity occurs. As a conse-quence the current density in the contact region is very high.
B. Parametric Study
The current has an influence on the occurrence of high voltage-drops. The higher the current, the earlier and more frequent discontinuities occur. Lee et al. [17] find that the higher the current in a fretting experiment, the earlier the static contact resistance would start to rise.
This again leads to the conclusion that a high current density is required for intermittences to occur.
C. Repetition of Events
The similar voltage-profiles in consecutive cycles that have been found do in general not exceed the softening and melting voltage of tin. Furthermore the slope of these events is compar-atively flat, while for example the peaks in Fig. 8 have a near vertical slope above the melting voltage of tin.
events with a higher or lower maximum voltage-drop can be found at other times.
Abbott et al. [3], [4] used a threshold voltage of between 200 and 500 mV to detect intermittences. In their experiments the voltage across the contact exceeds the melting voltage of tin. Murrell et al. [5] use a resistance threshold of 10 , equivalent to a voltage-drop of 100 mV in their circuit. The events are likely to exceed the melting voltage. The situation is different in the experiments carried out by Hübner-Obenland et al. They limit the contact voltage-drop to 20 mV and still see intermittences.
It can be concluded that the conduction mechanism here must be different to the direct metal-to-metal conduction between two solid conductors that predominates, when the contact re-sistance is low. The slow, repetitive events could be caused by changes in the area of electrical contact as the contact part-ners are sliding, while the shorter, nonrepetitive events could be caused by changes in the mode of electron transport, for ex-ample from metallic conduction to tunnel- or film-conduction and back. Micro-arcing, as described by Ben Jemaa et al. [18] for tin-plated contacts, can be ruled out because the voltages re-quired for an arc to form are not achieved in these experiments.
E. Slope
The significant dependence of the slope on the contact voltage-drop again confirms that a change in the mode of electron conduction is likely as soon as the voltage exceeds a certain threshold.
F. Voltage/Current Characteristic
The threshold of 130 mV that is prominent for events that occur with motion is not apparent for the case when no rela-tive motion between the contact terminals is present. Without motion the threshold at which significant steps in the contact voltage take place are higher, in the order of 200 to 500 mV. Braunoviæ recorded the voltage/current characteristic for alu-minum/copper contacts [19] and found severe distortions and fluctuations. The main difference to the voltage/current charac-teristic measured in this study is that Braunoviæ recorded while the contacts were in motion, while here the contacts are sta-tionary.
The fact that intermittences occur without forced relative mo-tion between the contact terminals contradicts the models pro-posed by Skinner [7] and Malucci [8], as they require relative motion in the order of at least a few micrometers. This motion is unlikely to be present in the experiments shown here.
tences leads to the conclusion that the area of electrical contact needs to be small at the time when a discontinuity occurs. As a consequence the current density in the con-tact region can be very high.
Further observations.
1) Increasing the current through the contact leads to earlier and more frequent high voltage-drop events.
2) The duration of intermittences ranges from several nanoseconds to several hundred milliseconds.
3) The softening and melting voltages of tin have been ex-ceeded.
4) The voltage profile of the recorded events is generally different in consecutive cycles; only when the maximum voltage-drop does not exceeded a few millivolts similar events can sometimes be identified.
5) Events are not symmetric to the maximum.
6) High voltage-drop events occur in clusters, not as single events.
7) The slope can exceed a few kilovolts per second in either direction.
ACKNOWLEDGMENT
The authors wish to thank C. Chalk for building large parts of the fixture system and P. Little, Thomas and Betts, and Dr. K. Saeger, AMI Doduco, for samples supplied.
REFERENCES
[1] J. Swingler, J. W. McBride, and C. Maul, “The degradation of road tested automotive connectors,” IEEE Trans. Comp. Packag. Technol., vol. 23, pp. 157–164, Mar. 2000.
[2] C. Maul, J. W. Mc Bride, and J. Swingler, “Instrumentation system for the detection of intermittency phenomena in electrical connectors,” Tech. Rep. Meas. Sci. Technol. Dept., Inst. Phys., Univ. Southampton, Southampton, U.K., 2000, to be published.
[3] W. Abbott and K. Schreiber, “Dynamic contact resistance of gold, tin and palladium connector interfaces during low amplitude motion,” in Proc. Holm Conf. Elect. Contacts, 1981.
[4] W. H. Abbott, “Time distribution of intermittents versus contact resis-tance for tin–tin connector interfaces during low amplitude motion,” IEEE Trans. Comp., Hybrids, Manufact. Technol., vol. CHMT-7, pp. 107–111, Mar. 1984.
[5] S. R. Murrell and S. L. McCarthy, “Intermittence detection in fretting corrosion studies of electrical contacts,” in Proc. 43rd Holm Conf. Elect. Contacts, 1997.
[6] F. Hübner-Obenland and J. Minuth, “A new test equipment for high dy-namic real-time measuring of contact resistances,” in Proc. 46th Holm Conf. Elect. Contacts, 1999.
[7] D. W. Skinner, “Intermittent opens in electrical contacts caused by mechanically induced contact motion,” IEEE Trans. Parts, Hybrids, Packag., vol. PHP-11, pp. 72–76, Mar. 1975.
[8] R. D. Malucci, “Possible mechanism for observed dynamic resistance,” in Proc. 46th IEEE Holm Conf. Elect. Contacts, Chicago, IL, 2000. [9] C. Maul, J. McBride, and J. Swingler, “On the nature of intermittences
[10] , “Measuring intermittences in electrical contacts,” in Proc. 7th Southampton Elect. Contact Sem., Southampton, U.K., 2000. [11] , “Influences on the length and severity of intermittences in
elec-trical contacts,” in Proc. Holm Conf. Elect. Contacts, Chicago, IL, 2000. [12] P. G. Slade, Ed., Electrical Contacts, 1st ed. New York: Marcel
Dekker, Inc., 1999.
[13] R. E. Bolz and G. L. Tuve, Handbook of Tables for Applied Engineering Science, 2nd ed. Cleveland, OH: Chemical Rubber Company, 1973. [14] R. Holm, Electric Contacts: Theory and Application, 4th ed. New
York: Springer-Verlag, 2000.
[15] M. Antler et al., “Recovery of severely degraded tin–lead plated con-nector contacts due to fretting corrosion,” in Proc. IEEE Holm Conf. Elect. Contacts, 1997.
[16] N. R. Aukland, H. C. Hardee, and M. E. Joaquim, “A preliminary study on an optimal application level for a polyphenyl ether on fretted tin/lead surfaces,” in Proc. 20th Int. Conf. Elect. Contacts, Stockholm, Sweden, 2000.
[17] A. Lee and M. Mamrick, “Fretting corrosion of tin-plated copper alloy,” in Proc. Holm Conf. Elect. Contacts, 1986.
[18] N. Ben Jemaa, L. Lehfaoui, and L. Nedelec, “Short arc duration laws and distributions at low current (<1 A) and Voltage (14–42 VDC),” in Proc. Int. Conf. Elect. Contacts, 2000.
[19] M. Braunovic, “Fretting in aluminum-to-copper connections,” in Proc. 14th Int. Conf. Elect. Contacts, Paris, France, 1988.
Christian Maul received the Dipl.Ing. degree in
me-chanical engineering from the Technical University of Braunschweig, Germany, in 1997 and is currently pursuing the Ph.D. degree in fundamental and applied research in automotive connectors at the School of Engineering Sciences, Mechanical Engineering De-partment, University of Southampton, Southampton U.K.
John W. McBride received the M.S. degree in aeronautical engineering from
the University of Southampton, Southampton, U.K., in 1978 and the Ph.D. degree in electrical contact phenomena from Plymouth University, Plymouth, U.K., in 1986.
From 1985 to 1987, he lectured in the Mechanical Engineering Department, Plymouth University. He has lectured at the University of Southampton since 1987 and is Professor of electro-mechanical engineering in the School of Engi-neering Science. He is Director of Research in the school and also Chair of the Electro-Mechanical Research Group. His main research interests include elec-trical contacts, metrology, and instrumentation.
Dr. McBride is a member of the IEE, a Chartered Engineer, and Vice Chair of IEE professional group S3 electron physics, plasmas, and applications. He is Associate Editor of the IEEE TRANSACTIONS ONCOMPONENTS ANDPACKAGING TECHNOLOGIESand a member of the Organizing Committee, IEEE Holm Con-ference on Electrical Contacts.
Jonathan Swingler, received the M.S. degree in
physics and chemistry from the University of Keele, U.K., in 1990 and the Ph.D. in the “degradation of electrical contacts under low frequency fretting conditions from Loughborough University, Lough-borough, U.K., in 1994.
Since then, he has been pursuing research in the area of electrical contact science and technology at the University of Southampton and is currently a Se-nior Research Fellow in the Electro-Mechanical Re-search Group.