Disk Machine Experiments to Assess the Life of
Damaged Railway Track
N. Gao, R. S. Dwyer-Joyce and D. G. Grieve Department of Mechanical Engineering University of Sheffield, Mappin Street, S1 3JD, UK
ABSTRACT
Rail wheel contacts operate in an arduous and contaminated environment. Railway track running surfaces can become damaged either prior to or during operation. This work is aimed at understanding how that surface damage can affect the life of railway track. Pre-damaged surfaces and track damaged by the entrainment of solid contaminants are considered under both oil and water lubrication. A series of small scale laboratory experiments has been carried out on a twin-disc rolling-sliding test machine. The test disks are artificially indented and run under typical wheel/rail contact conditions. The experimental results revealed that artificial dents only reduce the fatigue life of the contact under oil, but not water lubrication. With oil lubrication the fatigue failure initiates close to the location of the surface defect. However with water as the lubricant the whole of the surface undergoes cracking with the defect having no preferential effect. Studies have also been carried out to investigate the entrainment of solid particles into the wheel/rail contact. This kind of damage can accelerate surface fatigue and also lead to excessive wear. An attempt has been made to quantify the wear process and develop a simple empirical model.
1. INTRODUCTION
The failure of railway track in service can cause catastrophic train derailment, resulting in extensive material damage and human injury. The cost of the attention paid to the different forms of rail deterioration by wheel/rail contact forms a substantial proportion of the overall cost of track maintenance. It was estimated that the North American Railroads were spending $ 600 million annually for the replacement of deteriorated rail in the early eighties [1]. This figure does not include the cost of direct labour, maintenance equipment or loss of revenue as a result of line closure for rail replacement.
1.1 The Main Types of Rail Damage
(a) Squats - Rolling contact fatigue is one of the most common forms of failure in railway track and squats are manifestation of this phenomenon. On railway systems with light axle loads the principal form of rail damages is a longitudinal crack in the rail referred to as a ‘squat’ in Britain and as a ‘shell’ or ‘dark spot’ in Japan. Squat defects are found on the rail head running surface and typically grow for 25 to 50 mm at a shallow angle beneath the rail surface before branching, either towards the rail surface causing a spall, or down into the rail leading to a transverse rail break. The initiation of squat type rolling contact fatigue cracks is closely associated with plastic deformation in the surface layer [3]. They typically occur on straight track or in shallow curves. The location of these type of defects is not always predicable. One of the motivations of this work has been to investigate whether localised surface damage is in anyway an initiator of squat type cracks.
(b) Head checking - The ‘head check’ is another common form of rail rolling contact fatigue and is characterised by the formation of a series of surface breaking cracks in the gauge corner of the rail, typically on the high (outer) rail in curves. It is also associated with heavy plastic deformation and propagates down the flow lines of the surface material. Although head check defects do not normally propagate to form deep cracks or transverse rail breaks, they do often result in chips of rail gauge corner breaking away [4].
(c) Tache Ovale - This kind of damage initiates from an internal oval discontinuity in the rail, originating from a thermal effect during rail manufacture. It expands to reach the rail surface and cause immediate fracture of the rail posing serious risk of derailment. In recent years steel quality has improved and this kind of damage is rare.
(d) Corrugations - Corrugations are surface undulations on the rail head. These are found world wide on both straight and curved track, on railway networks ranging from light narrow gauge to heavy haul. The undulations occur with different amplitude and wavelength. On British rail, the most common form of corrugation is the ‘short wavelength’ variety with a wavelength between 40-80 mm and amplitudes of less than 0.2 mm [5]. Other wavelengths found on British rail are some around 500 mm (long wavelength) and some between 75-150 mm (medium wavelength). They promote many adverse effects including an increase in noise level and high frequency oscillation of the track.
(e) Thermal damage - Wheel burns form on rail due to uncontrolled slippage of the wheel during acceleration or braking. These can be at a singular location due to wheel spin or extend along a length of running surface. The frictional temperature rise is sufficient to transform pearlitic rail steel into forms of brittle martensite, such as a white etching layer. Subsequent cracking and spalling of the transformed microstructures cause surface discontinuities leading to high dynamic stresses and fatigue initiation.
three weld procedures used on British rail, are flash butt, thermit, and ‘build-up repair’ with metal arc weld deposit. About 80 % of thermit welds failures (e.g. lack of fusion, hot tears, porosity) are due to operator errors and most flash butt weld failures are attributable to welding machine deficiencies or post weld treatment.
1.2 Rail Surface Defects and Solid Contaminants
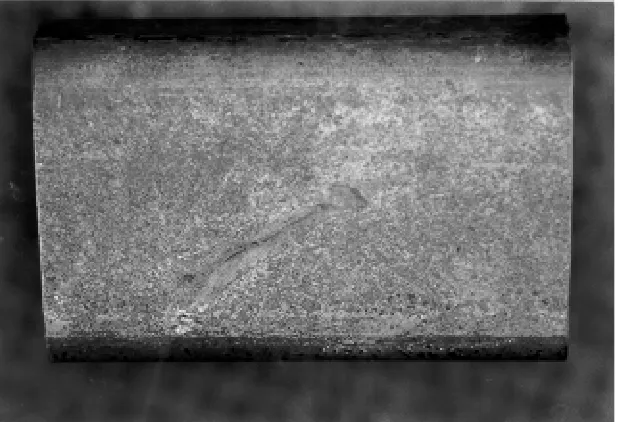
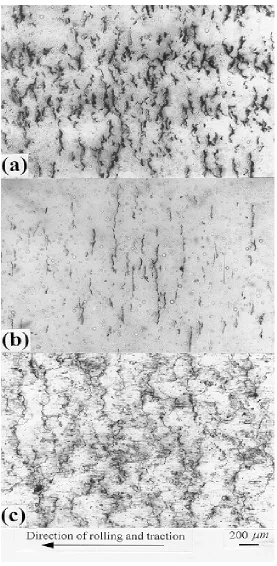
In addition to the above main types of rail damages, there are some other rail surface features which commonly occur. Firstly, depending on the manufacturing process a certain surface topography will be present. Also, the surface can exhibit manufacturing defects and indentations that stem from handling or operating damage. An example of surface defects caused by manufacture is shown in Figure 1. All of these features will change the contact conditions and affect the rail life. Secondly, the operation of railway track is likely to involve the presence of solid contaminants on the line at some stage [6]. This may be from the dispersion of freight goods such as coal or minerals, or the presence of ballast stone thrown onto the track either by the passage of the train or during ballast cleaning operations. Thirdly, in some cases, where a driver experiences low traction (particularly on steep or liquid contaminated track), sand may be deliberately placed on the track surface to improve traction. Railway track in dessert areas is also known to suffer from severe wear induced by windborne sand particles. All but very large particles will become entrained into the wheel-rail contact and will experience a high load and necessary fracture. Some of the fracture fragments will be ejected clear of the contact whilst others will pass into the contact and be subjected to further crushing. The effect of these contaminants is of concern since they may cause surface damage and accelerated wear of both track and wheel.
There has been considerable work in the railway engineering, mechanical engineering, and metallurgy communities to study rail behaviour and, in particular, to predict rail failures. Frequently this has involved expensive track side trials or laboratory based disk testing. Most of this work has been focused on increasing rail rolling contact fatigue (RCF) life by improved selection of rail steel (reducing its inclusion content) and trying to determine the mechanisms of RCF failures. The presence of defects on a contact surface will depart considerably from the smooth contact. This work is aimed at investigating the influence of different types of surface defects on contact fatigue life under a range of contact and lubrication conditions. The defected surface and the role of particle contamination has been studied. The wear process is discussed in relation to a semi-empirical model.
2. EXPERIMENTAL PROCEDURE
2.1. Twin disc testing machine
slide roll ratios. The driving torque and rotational speeds were measured by means of a torque transducer and rotary shaft encoders.
2.2. Materials
Two rail (R1, R2) and two wheel (W1, W2) pearlitic steels were used in these tests; their material compositions and properties are given in Table 1. The discs were manufactured to the dimensions of 47 mm diameter and 10 mm width. The wheel discs act as drivers whilst the rail discs are driven (follower discs). All cutting and machining operations were conducted to maintain the original microstructure and properties. The running surface of each disc was ground to an average roughness of Ra= 0.35µm. The dimensional tolerance of the discs was measured for roundness and eccentricity using a Talyrond profilometer.
2.3. Test procedure
2.3.1 Oil and water lubrication
Lubricants are applied using a gravity drip fed system so as to maintain a constant meniscus of liquid in the inlet region. The contact area was lubricated respectively by supplying approximately 1 drip per second for water, or 1 drip per 3 second for oil.
2.3.2 Artificial surface defects
Five types of defect were manufactured on the follower rail disc: transverse and longitudinal scratches, conical dents, pyramidal dents, and drilled holes [8, 9]. The reason that the surface defects were made on rail disc surface is that most previous research has demonstrated that cracks only propagate in the driven (rail) surface due to a fluid entrapment mechanism [10, 11]. Surface initiated fatigue cracks are generally not found on the driving disk. The width and length of the furrows were approximately 0.1-0.3 mm and 5 mm respectively. They were made by scoring with a carbide tipped cutting tool (tip radius 0.05 mm). The conical and pyramidal dents were of 0.4-1.2 mm diameters and produced using Rockwell and Vickers testing machines under different loads. The diameter of drilled holes was 0.5-1.5 mm.
2.3.3 Contaminated tests
R2 and W2 steels were used in dry contaminated tests. The contaminant was prepared from granite ballast collected from beside railway track and crushed. In the wheel/rail application a piece of ballast on the line will be crushed into fragment by the passage of the wheel. In this work we pre-crush the ballast so the fragments can easily enter into the twin disk contact. The initial particle size distribution of the crushed powder was measured using a Coulter LS Particle Size Analyser and the average mean particle size was 0.29 mm. A series of wear tests were carried out whilst feeding the discs with solid contaminant at an average feed rate of 6.5 mg/cycle [12]. The wear rate was established by interrupting the test at 3000 cycle intervals.
2.3.4 Analysis of specimens
before replacing and continuing with the test. Selected disks were sectioned, and wear debris and the crack morphology were studied using an optical microscope and a scanning electron microscope (SEM). The microhardness variation with depth below the contact surface was also measured.
3. EXPERIMENTAL RESULTS
3.1 Artificial defects under oil and water lubrication
3.1.1 The deformation of surface defectsFor an oil lubricated test, a low, reasonably constant, friction coefficient of 0.04 is observed. The wear loss almost is negligible, at an average 0.02µg cycle/ . Figure 2a shows how the dent size (diameter for conical indent and diagonal length for pyramidal indent) varied during the test. With an oil lubricated rail steel surface, the dent size showed an abrupt reduction (typically 50%) during the first few cycles and then remained virtually stable. The transverse and longitudinal furrows in oil demonstrated a similar change, i.e. a distinct decrease in their width taking place during the first cycles and then reaching a stable stage.
With water lubrication, friction coefficients start low and then rapidly increase to a high value of 0.18. The wear loss is an average 0.8µg cycle/ . For the water lubricated experiments the size change of the artificial indentations is somewhat different from oil. In all cases, a stable shakedown dent is not formed and deformation continues until the mouth of the dent is closed (see Figure 2b). The larger conical dents appeared the most resilient, and took around 60k cycles to be reduced to a small size. A similar test was carried out on a surface containing a drilled hole. Observations of sections through the hole after running 42k cycles demonstrates that this disappearance of the dent is not due to wear of the surface but rather by plastic flow closing the dent mouth [9]. Again under water lubricated conditions, all the machined scratches were observed to be closed up within 5k cycles for rail steel.
3.1.2 The characteristics of failure
With water lubrication, the dents had little influence on the life of rolling contact fatigue failure. Figure 5 show the sequence of typical test. The dent is deformed throughout the test and the dent mouth closes. This effect is not caused by wear but rather by the plastic flow of surrounding material which fills in the dent. There is no preferential cracking at the dent location. Cracks form across the whole surface at the same number of cycles as an undamaged surface failure. All dent shapes and sizes (including the drilled hole) showed the same behaviour. Figure 6 shows that transverse furrows have some slight influence on the failure. A network of cracks forms along the original trailing edge of scratch and join together to form an extended crack (see Figure 6d). Cracks grew everywhere on the surface, most of them in the transverse direction. However this occurs at the same time as cracking on the surface remote from the scratch. The same does not occur in the case of longitudinal furrows. In this case, cracks grow in the transverse direction and ignore the existence of a longitudinal furrow.
The effect of contact pressure and slip under water lubrication can be seen in Figure 7. A non-contact eddy current probe was used to scan continuously the full width of the rail disc during these water tests. For each test the same eddy current threshold was set (corresponding to a critical crack depth of 400-500 µm [9]). The decrease in contact pressure from 1500 to 900 MPa causes an increase of cycling life from 50k to 310k, and a decrease in crack density (see Figures 7a and b). A slip increase from -1% to -10% at the same contact pressure causes the life to decrease to 41k and surface shear obviously increases due to the higher traction (Figures 7a and c).
A section through the surface, in the direction of motion, revealed differences in morphology between oil and water lubricated cases. In oil lubrication, there are only a few cracks around the surface defect, which are generally located just behind the trailing side of the dent with a depth of the maximum stress in Hertzian contact [8]. On most surfaces, there are no cracks and no obvious plastic deformation [see Figure 8a]. However, for rail under water lubrication, there is obvious surface plastic deformation and cracks grow at many locations. As shown in Figure 8b, the inclined cracks grew deep into the specimen and exhibited some branching. Cracks propagate initially at an angle of 30-40o to the surface in a direction opposite to that of traction. Branches typically form at right angles to main crack at depths around 500µm. This is a typical of surface cracking observed with water lubricated rolling contact [11, 13]. At 900 MPa cracks are prone to this type of crack branching and networking. However, at 1500 MPa, -10% slip it is typical to see isolated cracks propagating deep into the surface. Clearly, crack growth deep into surface is the dominant feature of water lubricated contacts rather than the surface spall failure observed under oil lubrication.
3.2 Solid contaminants under unlubricated condition
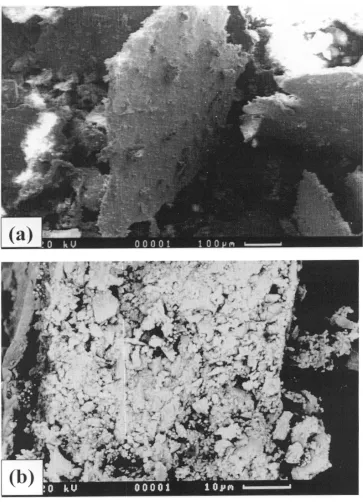
3.2.1 Wear debris morphologywear debris, into platelets which are then pressed and sheared in the contact. This process is shown schematically in Figure 10.
3.2.2 Surface damage
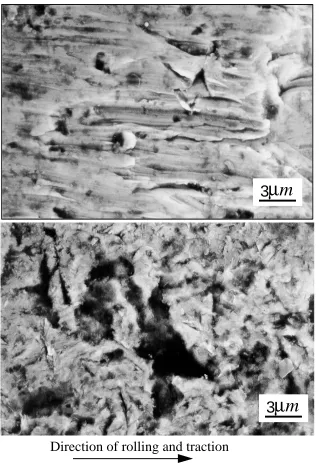
During the first few cycles of a test both the wheel and rail disc surfaces quickly took on a frosted appearance due to the abrasive action of the granite contaminant. Further cycles produced little change in the disc surface appearance. The friction coefficient was typically 0.2 - 0.25. Figure 11 shows measured mass loss from two tests; one where the wheel disc is driving and the other where it is driven. In both cases the rail disc was found to wear more than the wheel disc. Wear rates (12-50 µg/cycle) are somewhat higher than those for uncontaminated dry tests (15-20 µg/cycle) [14]. Wear grooves and peeled away material can be observed in the SEM close up of the worn rail disc surface (Figure 12a). The grooves were found to be typically 10 µm long by 1 - 2 µm wide, which is consistent with both the distance a particle slides in the contact and its final size. This indicates that the ultimate fragment particle size is an important factor since it largely defines the magnitude of the surface damage. Examination of the wheel disc surface (Figure 12b) revealed a very different surface morphology. There were many indentations and pits visible (typically 2 - 3 µm in size) with no grooves or scratches on the wheel surface. All this evidence support the theory that hard contaminants entering a rolling sliding contact, are crushed and then embed into the softer surface (the wheel disc at 262 Hv) and gouge the harder surface (the rail disc at 273 Hv) [15, 16]. From Figure 11, it also can be seen that reversing the direction of slip appears to have little effect on the weight loss of either disk (since only the direction of ploughing has changed and not the particle or material configuration).
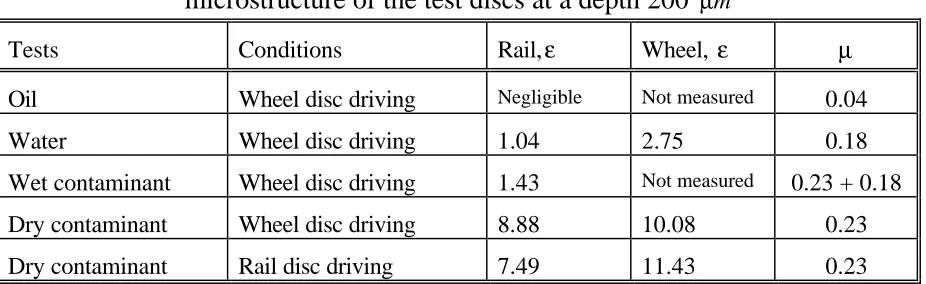
Flakes and cracks were found near the surfaces of both the rail and wheel discs which initiate and propagate wholly within the top heavily deformed microstructure (Figure 8d). Deformation of the microstructure could be seen to a depth of 1.0 mm. This type of deformation is often observed in wheel-rail contacts, where each pass of the wheel imparts an increment of plastic shear strain, which eventually forms a layer of sheared material near the surface [5]. An estimate of the accumulated strain can be found by taking the tangent of the angle, γ between the deformed microstructure and the normal to the disc surface at an (arbitrary) depth 200 µm. Table 3 shows that the wheel steel, being slightly softer and more ductile, accumulates greater strain before fracture.
4. DISCUSSION
4.1. Fluid film thickness
For the oil lubricated test an elastohydrodynamic film is formed between the wheel and rail; with water, however, only a very thin liquid film is retained between the contact surfaces.
Also shown is the lambda value Λ which is the ratio of the lubricant film thickness to the composite surface roughness
Λ =
+ h
σ1 σ 2
2
2 (1)
where σ1 is r.m.s. surface roughness of surface 1.
With relatively thick elastohydrodynamic films, as in the oil case, the infrequent asperity contacts lead to reduced traction and a low probability of crack formation. As asperity contact increases with decreasing film thickness, as in water case, cracks are formed more readily and in greater numbers [19]. The experimental results by Cheng [20] have revealed that when the film thickness parameter Λ is smaller than 0.3, cracks are initiated everywhere on the surface, and when Λ is greater than 0.5, no surface cracks could be found, except at the region near surface defects [20-22]. This is consistent with our experimental results: when Λ<0.017 in the water lubricated case without appropriate film protection, surface cracks grow everywhere (see Figures 5 and 6); and when Λ>1.3 in oil lubricated case, cracks only initiate near the defect (see Figures 3 and 4), where the film profile is affected by the existence of the defects.
4.2. The hydraulic pressurisation mechanism
Without the presence of a lubricant it is thought that the crack faces stick under load and that the only propagation mechanism is by the action of relatively low shear stresses (i.e. mode II). However when the fluid is present and the hydraulic pressurisation mechanism occurs much more rapid mode I propagation is possible.
Sullivan [19] explained the influence of water on crack propagation rate as originating from two effects. One is mechanical, where a greater volume of fluid is more likely to maintain the high compressive stress necessary for rapid crack growth. The other is chemical, where, according to Scott [23], water-produced hydrogen diffuses into the highly stressed material ahead of the microcracks resulting in hydrogen embrittlement. In addition, the effect of water and oil lubrication can be different for each of the two modes of crack growth [24]. Oil with a high pressure viscosity coefficient is more effective in reducing friction of the initial shear crack faces, while water with low viscosity would penetrate to the crack tips more easily in branch cracking. As a result, surface cracks do not propagate beyond the work hardened surface layer with oil, whereas the water lubrication results in much deeper branched crack networks. This is consistent with our experimental results in which pits or a spall are restricted to a near surface region with oil lubrication but in water cracks grow deep into the surface [9].
4.3. Stress intensity factor and coefficient of traction
A lubricated rolling/sliding line contact system which contains surface breaking cracks has been simulated by Kaneta et al [27]. The stress intensity factors which represent the intensities of the fields of shearing stress τrθ and tensile stress σθ near the crack tip are expressed as follows:
( )
[
(
)
]
Kτ θ =τrθ 2πr = 1 θ KI θ +KII θ−
2cos2 sin 3cos 1 (2)
( )
Kσ θ =σθ πr = θ KI θ − KII θ 2 2 2 3 2 2
cos cos sin (3)
where
( )
r,θ indicates the polar co-ordinate systems, the origin of which is located at the crack tip. It is shown [27] that when a crack is small, the maximum tensile stress intensity factor Kσmax is much smaller than the threshold stress intensity factor range ∆Kσth during a loading cycle. Conversely, maximum shear stress intensity factor Kτmax has a relatively large value when the crack is closed. Therefore, it is expected that crack growth occurs along the original crack plane by shear mode. If we assume a small crack of length a, where a c = 0.1 angled at 45o , published stress intensity factor data is available [28, 29]. The data is presented in non-dimensional form:∆Kτmax =∆Fτmaxp0 πa (4)
where ∆Fτmax is tabulated for various crack lengths, angles and friction coefficients. For a surface traction coefficient of 0.04 (corresponding to the oil lubrication tests) and a contact pressure p0=1500 MPa, the maximum shear stress intensity factor range is calculated as ∆Kτmax=1.06MPa m. The threshold stress intensity factor is approximately ∆Kτth ≈15. MPa m [30], so a crack is not expected to propagate in this condition without the presence of further stress raising defects. Repeating this calculation for the water lubricated case, where µ = 0.18 gives ∆Kτmax= 2.75MPa⋅ m. This value exceeds the threshold and thus we would expect shear mode growth to occur.
From the above results, it can be concluded that a microcrack may propagate in shear mode only when sufficient surface traction exists. The reason is that the contact pressure gives rise to large a compressive stress field in the neighbourhood of the contact region, therefore, crack growth is unlikely to occur without sufficient surface traction [31]. In addition, the surface traction is the controlling factor for lubricant seepage into the crack and for shear mode crack growth rate. The analytical results support the hypothesis that a crack first propagates in shear, and that crack growth by tensile mode follows due to a hydraulic effect on crack faces by the lubricant that has penetrated into the crack [27, 32].
4.4 Contaminant originated surface damage
experimental results showed that the rail disc was found to wear more than the wheel disc. The reason for this behaviour is the difference in hardness of the two materials. It has been shown by several workers [33-36] that hardness ratio controls this mechanism. Particles embed in the softer surface and scratch the harder; the harder surface thus wears at a greater rate than the softer. In this case, the embedded particles seem to offer a protective effect to the wheel surface. It is interesting to observe that even very slight differences in hardness (in the present case 262 Hv for the wheel and 273 Hv for the rail) can result in some 2.5 times greater wear on the harder surface. It should be pointed out that this hardness ratio effect only occurs in the three body regime. In two body wear (where no abrading particles are present) the softer surface is expected to wear more than the harder.
Table 3 shows that the accumulated strains in contaminated cases are slightly less than those observed in the clean dry tests of Tyfour et al. [14]. This is attributed to the lower friction coefficients with an average of 0.23, and hence lower shear traction, observed during these contaminated tests. Without the presence of contaminants, friction coefficients of 0.41 were recorded in the dry tests. The particles cause a reduction in friction coefficient from the dry case. The reason for this behaviour is not entirely clear; it is possible that the shearing of the debris flakes requires a lower stress than the interfacial shear strength of the steel contact. Either because the granite material under hydrostatic pressure has a low shear strength or because the sub-grains themselves are sliding over one another.
Figure 13 shows the strain hardening beneath the rail disc contact surface for the different test conditions. It can be seen that for the continuous contaminated test, there is obvious work hardening and the maximum hardness occurs at surface, which is about 2.8 times the initial hardness. However, for water and oil lubrication test, there are no obvious difference in the behaviour of maximum hardening, and all the depth of maximum hardening is at 0.18-0.23 mm below the contact surface. This is close to the depth of maximum shear stress, τ1, of 0.24 mm, which has been estimated from an elastic Hertzian analysis. The maximum hardness is about 1.3-1.5 times the initial hardness. An important observation in this work was the absence of a difference in the sub-surface work hardening between water and oil lubricated cycling under the same contact pressure. This means that simply using work hardening as a measure of the damage in the material is inadequate to describe the fatigue behaviour. This phenomena has also been found in the cases with or without a reversal in the direction of the test [13]. Also, we can see from Figures 8a and b that plastic deformation at the surface is driven by the tangential traction and is independent of the normal pressure.
approaching loaded contact closes the crack mouth, raising the pressure of trapped fluid and causing mode I and mode II crack RCF propagation. As a result, it is observed that the life drops from 50k with water alone to 27k when the wet test has been preceded by 500 contaminated cycles. Table 3 also shows that the accumulated strains in water and wet contaminant cases are much smaller than those observed in the tests where contaminants were present throughout.
4.5 A model of the abrasive process
A simple model of the three body abrasion process can be obtained by considering the cumulative material removed by each particle as it passes through the contact. An individual particle is assumed to displace a volume of material equal to its embedded cross sectional area, A multiplied by the distance it slides. Of that displaced material some proportion, f will be removed as wear; the rest being accommodated by elastic or plastic deformation of the surfaces. If N particles are fed into the disk inlet region; then only some proportion, e will actually pass into the contact; the rest passing around the sides or being ejected from the entry. Of that number some proportion, g will actually cut. This leads to an expression for the wear rate as follows:
&
m N Abs
nefg
s
=ρ
100 (5)
where ρs is the steel density, n is the test duration in number of cycles, b is the width of the contact patch along the direction of motion, s is the slide roll ratio. If we know the mass of particles fed into the disk conjunction over the test period w, and assume they are cubic of side length, d, then the number of particles, N is estimated as:
N w
d c
= 3
ρ (6)
where ρc is the density of the contaminant. Since neither the wheel/rail contact nor the twin disc wear test contact are a closed system, it cannot be assumed that 100% of the contaminating particles enter the contact. From a quick calculation of the mass in each size band, as recorded by the laser particle size analyser, it is estimated that approximately 15% of the particles have been reduced in size during the feeding , thus giving e ≈ 0.15 [12].
Buttery [37] describes a method for characterising the geometry of a scratch using an idealised cross-section in which the area of displaced material equals
A
1. Some of this will be removed as wear, whilst the rest piles up into dent shoulders (denoted A2). The proportion of displaced material removed from the surface, or the ploughing factor, can then be found from:f
A
A
A
=
1−
21
(7)
cut; whilst the rest roll or tumble through a contact. In the absence of any alternative data a value of g=0.1 was used here.
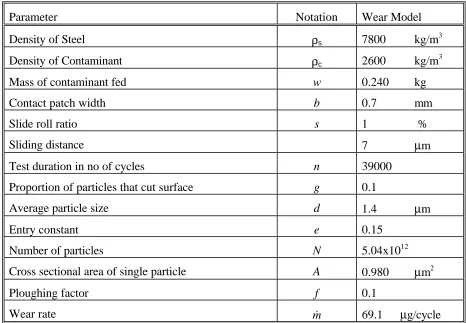
Using equation (5) with variables appropriate to the test performed, summarised in Table 5, predicts a constant combined (i.e. rail plus wheel) mass loss of 69 µg/cycle. The two tests performed had combined wear rates varying from 16 µg/cycle at the start of the test to 95 µg/cycle at the end of the test. Considering the many assumptions involved in the analysis, the results are encouraging. However, the cross sections in Figure 8c and d indicate that strain has accumulated in the near surface regions. This might lead to wear by ratchetting. To improve the model it would be necessary to attribute some of the wear to ratchetting. Kapoor [39] has proposed a model for this which, in principle, could be combined with the above to study the interaction between ratchetting strain accumulation and abrasive material removal.
5. CONCLUSIONS
1. Under oil lubrication, surface dents showed a rapid size reduction of about 40-50 % and then remained virtually stable with further cycling. An obvious influence of conical and pyramidal dents on fatigue life has been demonstrated. However, neither transverse nor longitudinal scratches had any influence on disc life.
2. Under water lubrication, dent sizes decreased continuously throughout the test until closure of the dent mouth occurred. The dents and longitudinal scratches had no influence on the life of the contact. The whole of the surface exhibits cracking with no particular disposition towards the region of the indentation. Transverse scratches promoted some surface crack networking and so demonstrated a minor influence on contact life.
3. Oil is more effective in reducing crack face friction whilst water is able to penetrate to the crack tip more easily. In water lubricated cases, surface cracks grew everywhere on the surface. With oil lubricated case, failure occurred at an indentation. It is proposed that the increased traction and fluid penetration under water lubrication is the origin of these differences.
4. Evidence of particles embedding in the softer wheel surface and scratching the hard rail surface was seen in the solid contaminated tests. This caused the harder rail to wear at 2.5 times the rate of the softer wheel. The direction of traction had no effect on the abrasion mechanism.
contamination is slightly less serious than a dry test alone. However, a few cycles of dry contamination can have a strong effect on a water lubricated test.
6. A simple model of the abrasive process has been proposed. The wear rate was determined from geometrical considerations of the particle and how far it slides in the contact. The model gives an order of magnitude predictions of abrasive wear rate.
REFERENCES
1. Jamison, W. Wear of steel in combined rolling and sliding, ASLE Transactions, 1980, 25, 71-78.
2. Clayton, P. Tribological aspects of wheel-rail contact: a review of recent experimental research, Wear, 1996, 191, 170-183.
3. European Railway Research Institute, Rolling contact fatigue: Review of rolling contact fatigue in rail, D173/RP1, April 1990, Utrecht, Netherlands.
4. Sato, Y. Design of rail head profiles with full use of grinding, Wear, 1991, 144, 363-372. 5. Clayton, P. and Allery, M. B. P. Metallurgical aspects of surface damage problems in rail,
Canadian Metallurgical Quarterly, 1982, 21, 31-46.
6. Ghonem, H., Kalousek, J., Stone, D. and Dibble, D. Observations of rail wear on heavy haul railway lines. Proc. International Conf. on Contact Mechanics and Wear of Wheel/Rail Systems, Vancouver, Canada, 1982, 249-268.
7. Fletcher, D. I. and Beynon, J. H. Development of a machine for closely controlled rolling contact fatigue and wear testing under high stress conditions. Submitted to the ASTM Journal of Testing and Evaluation, 1999.
8. Gao, N., Dwyer-Joyce, R. S. and Beynon, J. H. Effects of surface defects on rolling contact fatigue of 60/40 brass. Wear, 1999, 225-229, 983-994.
9. Gao, N. and Dwyer-Joyce, R. S. The effects of surface defects on the fatigue of water and oil lubricated contacts, in press, Proc Instn Mech Engrs, Part J: Journal of Engineering Tribology, 2000.
10. Bower, A. F. The influence of crack face friction and trapped fluid on surface initiated rolling contact fatigue cracks, Transactions of the ASME, Journal of Tribology, 1988, 110, 704-711.
11. Beynon, J. H., Garnham, J. E. and Sawley, K. J. Rolling contact fatigue of three pearlitic rail steels. Wear, 1996, 192, 94-111.
13. Tyfour, W. R. and Beynon, J. H. The effect of rolling direction reversal on fatigue crack morphology and propagation. Tribology International, 1994, 27, 273-282.
14. Tyfour, W. R., Beynon, J. H. and Kapoor, A. The steady state wear behaviour of pearlitic rail steel under dry rolling-sliding contact conditions. Wear, 1995, 180, 79-89. 15. Axen, N., Jacobson, S. and Hogmark, S. Influence of hardness of the counterbody in
three-body abrasive wear - an overlooked hardness effect. Tribology International, 1994, 27, 233-241.
16. Gates, J. D. Two-body and three-body abrasion: A critical discussion. Wear, 1998, 214, 139-146.
17. Williams, J. A. Engineering Tribology, 1994, (Oxford University Press).
18. Chen, H., Yoshimura, A. and Ohyama, T. Numerical analysis for the influence of water film on adhesion between rail and wheel. Proc. Instn. Mech. Engrs., 1998, 212, 359-368. 19. Sullivan, J. L. and Middleton, M. R. The pitting and cracking of SAE 52100 steel in
rolling/sliding contact in the presence of an aqueous lubricant. ASLE Transactions, 1985, 28, 431-438.
20. Cheng, W., Cheng, H. S. and Keer, L. M. Longitudinal crack initiation under pure rolling contact fatigue, Tribology Transactions, 1994, 37, 51-58.
21.Cheng, W., Cheng, H. S. and Keer, L. M. Experimental investigation on rolling/sliding contact fatigue crack initiation with artificial defects, Tribology Transactions, 1994, 37, 1-12.
22. Zhai, X. J. and Chang, L. On mechanisms of fatigue life enhancement by surface dents in heavily loaded rolling line contact. Tribology Transactions, 1997, 40, 708-714.
23. Scott, D. The effect of material properties, lubricant and environment on rolling contact fatigue. Proc. Symp. Fatigue in Rolling Contact, I. Mech. E., 1963, 103-115.
24. Clayton, P. and Su, X. Surface initiated fatigue of pearlitic and bainitic steels under water lubricated rolling/sliding contact. Wear, 1996, 200, 63-73.
25. Tallian, T. E. Failure Atlas for Hertz Contact Machine Elements, 1992, (ASME Press, New York).
26.Tallian, T. E. On competing failure modes in rolling contact, ASLE Transactions, 1967, 10, 418-439.
27. Kaneta, M., Yatsuzuka, H. and Murakami, Y. Mechanism of crack growth in lubricated rolling/sliding contact. ASLE Transactions, 1985, 28, 407-414.
28. Kaneta, M., Murakami, Y. and Yatsuzuka, H. Propagation of surface crack in rolling line contact. Proc. JSLE Int. Tribology Conference, Tokyo, Japan, 1985, 911-916.
29. Murakami, Y. Stress Intensity Factors Handbook, Volume 2, 1990, (Pergamon Press). 30. Otsuka, A., Mori, K. and Miyata, T. The condition of fatigue crack growth in mixed
mode condition. Eng. Fracture Mech., 1975, 7, 429-439.
32. Murakami, Y., Sakae, C. and Ichimaru, K. Three-dimensional fracture mechanics analysis of pit formation mechanism under lubricated rolling-sliding contact loading. Tribology Transactions, 1994, 37, 445-454.
33. Dwyer-Joyce, R. S., Sayles, R. S. and Ioannides, E. An investigation into the mechanism of closed three-body abrasive wear. Wear, 1993, 175: 133-142.
34. Ronen, A. and Malkin, S. Wear mechanisms of statistically loaded hydrodynamic bearings by contaminant abrasive particles. Wear, 1981, 68, 371-389
35. Fang, X. L. and Zhou, Q. D. An explanation of the relation between wear and material hardness in three-body abrasion. Wear, 1991, 151, 313-321.
36. Williams, J. A., and Hyncica, A. M. Abrasive wear in lubricated contacts. J. Phys. D: Appl. Phys., 1992, 25, 81-90.
37. Buttery, T. C. and Archard, J. F. Grinding and abrasive wear. Proc. Instn Mech. Engrs, 1971, 185(43), 537-551.
38. Rabinowicz, E., Dunn, L. A. and Russell, P. G. Study of abrasive wear under three body conditions. Wear, 1961, 4, 345-355.
List of the Tables and Figures:
Table 1. Chemical composition and mechanical properties of the test materials
Table 2. Summary of experimental results on the effect of defects on rolling contact life under oil and water lubrication
Table 3. Accumulated strain found by measuring tanγ of the deformed microstructure of the test discs at a depth 200 µm.
Table 4. Film thickness parameters under oil and water lubrication
Table 5. Example of abrasive wear mode using parameters from twin disc tests. Figure 1. Sample of surface damaged railway track.
Figure 2. Relationship between the dent size and the number of rolling cycles for rail steel, p0= 1500 MPa. (a) oil; (b) water.
Figure 3. Progression of damage on the rail disc surface around a conical dent, p0= 1500 MPa , oil lubrication. (a) N = 0; (b) N = 131k; (c) N = 465k; (d) N = 866k cycles. Figure 4. SEM examination showing a large spall located just behind the trailing side of a
drilled hole after 1150k cycles of oil lubrication.
Figure 5. Progression of damage on the rail disc surface around a pyramidal dent, p0= 1500 MPa, water lubrication. (a) N = 0; (b) N = 5k; (c) N = 15k; (d) N = 40k cycles. Figure 6. Progression of damage around a transverse furrow on the rail disc surface, p0=
1500 MPa, water lubrication. (a) N = 0; (b) N = 5k; (c) N = 20k; (d) N = 30k cycles.
Figure 7. Effect of contact pressure and slip on surface RCF with water lubrication. (a) p0= 1500 MPa, slip = 1%, 50k; (b) p0= 900 MPa, slip = 1%, 310k; (c) p0= 1500 MPa, slip = 10%, 41k.
Figure 8. Cross section through the running surface showing different morphologies for lubricated and contaminated situations. (a) oil, 1150k; (b) water, 50k; (c) wet contaminant 0.5k + water 27k; (d) dry contaminant, 40k cycles.
Figure 9. SEM images of granite debris after passage through the contact. (a) typical flakes of granite; (b) detail of the edge of a flake (through the thickness) revealing that it is made up from agglomerated sub-grains.
Figure 10. Detail of the ‘mechanism’ of three-body abrasion in a rolling/sliding railway contact. A piece of granite ballast is trapped, crushed, entrained and finally agglomerated as it passes through the contact.
Figure 11. Weight loss from discs during dry contaminated tests.
Figure 12. SEM image of rail and wheel disc surfaces from tests with ballast contamination. (a) detail of a groove on the rail disc surface; (b) detail of indentations seen on the wheel disc surface.
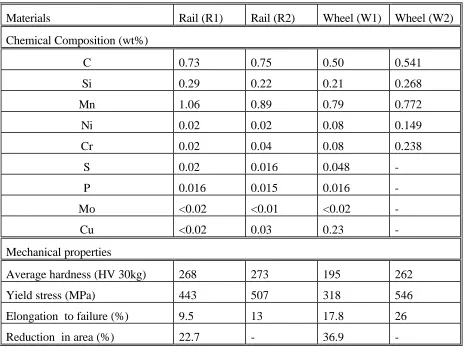
Table 1. Chemical composition and mechanical properties of the test materials
Materials Rail (R1) Rail (R2) Wheel (W1) Wheel (W2)
Chemical Composition (wt%)
C 0.73 0.75 0.50 0.541
Si 0.29 0.22 0.21 0.268
Mn 1.06 0.89 0.79 0.772
Ni 0.02 0.02 0.08 0.149
Cr 0.02 0.04 0.08 0.238
S 0.02 0.016 0.048
-P 0.016 0.015 0.016
-Mo <0.02 <0.01 <0.02
-Cu <0.02 0.03 0.23
-Mechanical properties
Average hardness (HV 30kg) 268 273 195 262
Yield stress (MPa) 443 507 318 546
Elongation to failure (%) 9.5 13 17.8 26
-Table 2. Summary of experimental results on the effect of defects on rolling
contact life with oil and water lubrication
Material p0 MPa
Lubrication Defect Defect size Effect
(Y/N) Life, Cycles Location of failure Before test, mm % Reduction
Rail steel 1500 Oil 0.45-0.65
0.76-1.2 52-65 40-57 Y >1000k 700-900k At trailing edge 0.34-0.55 0.70-1.1 49-56 27-41 Y >800k 300-700k At trailing edge
0.21-0.26 23-24 N > 1000k All over
surface 0.10-0.25 60-88 N > 1000k All over
surface
No defect - - - > 1000k All over
surface
Rail steel 1500 Water 0.48-0.70
0.8-1.06
100 64-88
N 50k All over
surface
0.17-0.98 100 N 50k All over
surface
0.21-0.27 100 Y 35-40k Along
scratch
0.11-0.16 100 N 50k All over
surface
No defect - - - 50k All over
surface
Contami-nants - - Y 27k
[image:18.595.68.531.611.753.2]All over surface
Table 3. Accumulated strain found by measuring
tanγof the deformed
microstructure of the test discs at a depth 200
µmTests Conditions Rail,ε Wheel, ε µ
Oil Wheel disc driving Negligible Not measured 0.04
Water Wheel disc driving 1.04 2.75 0.18
Wet contaminant Wheel disc driving 1.43 Not measured 0.23 + 0.18
Dry contaminant Wheel disc driving 8.88 10.08 0.23
Dry Wheel disc driving [36] 11.5 Not measured 0.41
Table 4 Film thickness parameters under oil and water lubrication
h , µm Λ
Oil 0.69 1.39
[image:19.595.63.529.358.681.2]Water 0.005 0.010
Table 5. Example of abrasive wear model using parameters
from twin disc tests.
Parameter Notation Wear Model
Density of Steel ρs 7800 kg/m
3
Density of Contaminant ρc 2600 kg/m
3
Mass of contaminant fed w 0.240 kg
Contact patch width b 0.7 mm
Slide roll ratio s 1 %
Sliding distance 7 µm
Test duration in no of cycles n 39000
Proportion of particles that cut surface g 0.1
Average particle size d 1.4 µm
Entry constant e 0.15
Number of particles N 5.04x10¹²
Cross sectional area of single particle A 0.980 µm2
Ploughing factor f 0.1
Figure 2.
Relationship between the dent size and the number of rolling
cycles for rail steel, = 1500 MPa. (a) oil; (b) water.
p
00 0.1 0.2 0.3 0.4 0.5 0.6 0.7
0 50 100 150 200 250
Number of cycles (x1000)
Dent size (mm)
Conical dent Pyramidal dent
0 0.2 0.4 0.6 0.8 1 1.2
0 10 20 30 40 50 60 70
Number of cycles (x1000)
Dent size (mm)
Conical dent Pyramidal dent Drilled hole
(a)
Figure 7. Effect of contact pressure and slip on surface RCF with water lubrication. (a) = 1500 MPa, slip = 1%, 50k; (b) = 900 MPa, slip = 1%, 310k; (c) = 1500 MPa, slip = 10%, 41k.
p
0p
0solid particle cushed here
some fragments ejected
succesive fracture
particle agglomerate with rail-wheel steel debris
WHEEL
RAIL
[image:29.595.84.493.84.312.2]slip direction of travel
Figure 10. Detail of the ‘mechanism’ of three-body abrasion in a rolling/sliding railway contact. A piece of granite ballast is trapped, crushed, entrained and finally agglomerated as it passes through the contact.
Figure11 Weight loss from discs during two dry contaminated tests.
0 0.5 1 1.5 2
0 10000 20000 30000 40000
Number of cycles
Mass loss (g)
Rail (driven)
Rail (driving)
Wheel (driven)
Wheel (driving)
Rail (Hv=273)
Wheel (Hv=262)
[image:29.595.112.474.366.650.2]particle agglomerate with rail-wheel steel debris
µ
m
3
[image:30.595.131.450.68.531.2]Direction of rolling and traction
Figure 12. SEM image of rail and wheel disc surfaces from tests with
ballast contamination. (a) detail of a groove on the rail disc
surface; (b) detail of indentations seen on the wheel disc surface.
µ
m
Figure 13 Hardness profile below the contact surface under different rolling conditions.
0
2
4
6
8
10
0.5 1 1.5 2 2.5 3
Microhardness/Bulk hardness
Depth (normalised by depth of
maximum shear stress)
Oil, N=1150k Water, N=50k