Abstract—Building Information Modeling (BIM) spans the whole programming-to-operation time-span about a building life cycle. BIM allow for better integration of design processes, allowing data feedback with performance analysis stage and design stage that is equivalent to having a team of analyst consultants assessing your design.
Due to the importance of the wind environment in the performance of BIM, this study using computational fluid dynamics (CFD) done by Ecotect Analysis software simulating, studied the building layout of Shezi Island in Taiwan, and drafted out urban design guideline based on analysis of urban ventilation design generated by building layout and its effect on building wind environment. The results can feedback to the planner and designer to modify the layout of buildings to have a more comfortable and energy saving new town.
This research based on methods of the simulations obtained numerical predictions of flow characteristics around the buildings for studying the wind field of the Shezi Island performed. The dimensions of calculation domain were 771 m long, 624 m wide and 150 m high. Result of simulations showed that the layout characterized by street block type in the open space generated change of wind environment, high wind velocity, and therefore affected the residents' activities and psychological feelings.
Index Terms—Urban of open space, Ecotect Analysis, Shezi Island, Building layout, wind environment
I. INTRODUCTION
n recent years, Building Information Modeling (BIM), the system widely used in the building industry, can maximize the information exchange and synchronizing function of sustainable city.
Building Information Modeling (BIM) spans the whole programming-to-operation time-span about a building life cycle. The resulting BIM become shared knowledge resources to support decision-making about a building life cycle from earliest programming, through planning and conceptual design stages, through performance analysis and construction, through its operation and maintenance, eventual demolition as shown in Fig. 1.
It connects the information and digital model at the beginning of design to reduce the possible loss in the transmission process, as well as improve the accuracy to reduce waste of manpower and material resources. It covers
Manuscript received February 5, 2013; revised March 26, 2013. This work was supported in part by the National Science Council, Taiwan, ROC under Grant NSC101-2627-E-027-001-MY3.
Ying-Ming Su is with the Department of Architecture, National Taipei University of Technology, Taipei 106, Taiwan. (phone: (886) 2-27712171 ext. 2909; fax: (886) 2- 27510843;e-mail: ymsu@ntut.edu.tw).
a wide range of all kinds of materials and is connected to the cloud database instead of keeping related materials in respective units; therefore conducive to end-users’ search and application of accessible tools.[1] [2]
Fig.1. Lifecycle of Building Information Modeling(BIM) BIM is a relatively recent switch in design and documentation methodology in the design and construction industries. BIM is information about the entire building and a complete set of design document stored in an integrated database.
Since BIM data are machine readable and exchangeable, it becomes practical to use the data they carry in many other ways: For wind, energy, lighting, acoustic or other analyses - not as post factor checking if an almost finished design is well-done, but rather to provide feedback while designing, informing the designer of the effects of changes or to explore the relative effect on alternatives. BIM allow for better integration of design processes, allowing data feedback with performance analysis stage and design stage that is equivalent to having a team of analyst consultants assessing your design. Taiwan recently also began to try to import construction and management engineering BIM technology to improve performance and reduce energy consumption, such as the MRT traffic engineering, planning of new towns.
Due to the importance of the wind environment in the performance of BIM which concerns about the energy reduction and amenity living environment, this study using
Renovation
Operation
Maintenance
Construction
Planning &
Design
Performance
Analysis
GIS Conceptual Design
Site Analysis User Analysis Site Planning
Landscape Analysis
Low Energy Consumption Design
Thermal Environment and Comfort Regeneration Materials/Solution Environment Symbiotic
Wind Environment
BIM
Demolition
feedback
Incorporation of Computational Fluid Dynamics
into the Effect of Building Layout on the Wind
Environment-A Case Study of Shezi Island in
Taipei
Ying-Ming Su
Autodesk Ecotect Analysis software CFD to simulate buildings layout wind environment of Taipei Shezi Island new town. The results can feedback to the planner and designer to change the layout of buildings to have a more comfortable and energy saving new town.
Wind flow has a substantial effect in the comfort of pedestrians, the environmental conditions within public spaces and around building entrance and the activities that might occur there. Wind tunnel tests during the design development process are often critical- particularly where proposed buildings are significantly taller than their neighbors. [3]
At the present stage, Taipei Shezi Island is positioned to develop into an eco-city friendly both to environment and humanity. Traditional eco-building performance analyses
were based on research papers of questionnaires, observation and interviews and lacks scientific objective evaluation. This study started from a different point of view of the ecological city, using computational fluid dynamics (CFD) method facilitated by Ecotect Analysis software to simulate city building layout. The goal of this investigation is to conduct the digital computerized analysis in conjunction with the wind comfort level standard to predict the pedestrian wind comfort level around Shezi Island.
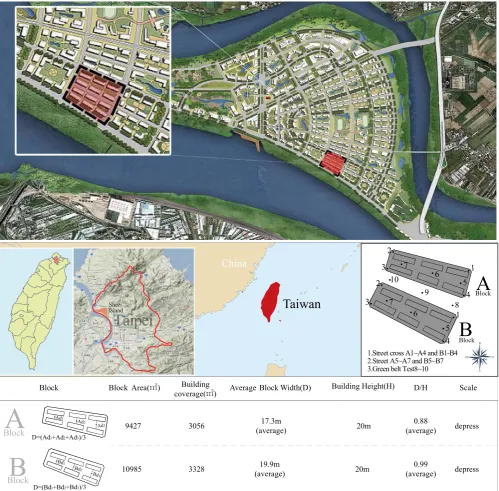
[image:2.595.50.550.248.739.2]The case study of design plans of Shezi Island discussed the wind environmental impact created by building layout and open space, and other impacts including space continuity, environmental comfort, activity continuity and pedestrian system. In order to improve the quality of living environment, dwellers’ and users’ requirement on daily working and activity space must be taken into consideration.
Fig. 2. Location of Shezi Island and Distribution of measuring points.
China
Taiwan
SheziIsland
Shezi Island
Block
A
Block
B
1 2
3
2
3 4
1
4
5
8 9 10
5
6
6
7
7
1.Street cross A1~A4 and B1-B4 2.Street A5~A7 and B5~B7 3.Green belt Test8~10
Block Block Area(㎡)
9427
10985
3056
3328
20m
20m
depress
depress 17.3m
(average)
19.9m (average)
0.88 (average)
0.99 (average) Building
coverage(㎡) Average Block Width(D) Building Height(H) D/H Scale
Block
A
Block
B
Ad1
D=(Ad1+Ad2+Ad3)/3
Ad2 Ad3
D=(Bd1+Bd2+Bd3)/3
Bd3
Consequently, increasing researchers use computer software tools to analyze the physical processes around buildings. Hussein et al. [4] performed computational analysis to simulate the wind corrosion phenomenon of the Egyptian monuments situation with the countermeasures developed to protect the monuments. Gousseau et al. [5] carried out the airflow calculations to characterize the wind field near the buildings. To enhance the air quality and comfort level in the city, the predicted results were used to identify the potential regions for accumulation of air pollutants. Blocken et al. [6] also investigated the indoor and outdoor wind flow fields of Amsterdam stadium in the Netherlands, and examined the probable uncomfortable or even coma circumstances of the audience due to the carbon dioxide emissions generated from audience’s breathing.
According to principles of relevant surveys on conform of open space, factors such as humidity, ventilation, and sunlight exposure were all closely related to wind environment. Of all the related factors, building layout was the most important one. Xiao Baoyi [7] defined wind environment as the change of wind flow that surrounds the building once it’s built. One of the most important indexes of change in wind environment was Pedestrian Level Wind (PLW). Hong Yi’An [8] illustrated that PLW usually referred to the wind environment at the height of pedestrians’ head that was about 1.5- 2 meters above the earth. Other factors such as wind characteristic, wind direction, wind velocity, the size of architecture itself, the geometrical shape and neighboring building complex etc, also exerted an impact on the wind flow around the building, hence, creating an instable turbulence flow field. The annoying Pedestrian Level Wind could directly influence the design of architecture and urban plan in the vicinity.
Wind flow had a substantial effect in the comfort of pedestrians, the environmental conditions within open spaces and around building entrance and the activities that might occur there. Wind tunnel tests during the design development process were often critical-particularly where proposed buildings were significantly taller than their neighbors.
II. SIMULATION OF STREET SET OF SHEZI ISLAND
Shezi Island (Fig.2.), located [9] at the intersection of Keelung River and Tansui River in Taipei, was originally a flood plain. A big urban park is planned to be built in the northern part of it. Meanwhile, a livable, productive, and eco-friendly community for Taipei will develop from here, making Shezi Island the green ecological foundation in the city of Taipei. Case of Shezi Island plan design will feature the one-side space of style (linear type) and with 40% building coverage ratio and 160% floor area ratio. This study based on the simulation and analysis of building wind environment done with the aid of computer.
As the experiment location was simulated and the case of plan design to be analyzed, the Ecotect analysis software helped simulate and analyze the effect of the wind environment generated by building layouts. There were 10 measuring points distributed (Fig.1.).Wind environment effects on space continuity, environmental comfort, activity continuity, and access, etc were studied on at respective heights of 1.5m, 5m, 10m, and 15m. Then according to the results of software simulation, further analysis and discussion on the plan design were carried out.
III. COMPUTATIONALANALYSIS
D.M. Hargreaves and N.G. Wright [10] had proposed the idea of inflow boundary condition. If a sustainable ABL couldn’t be produced spontaneously, the k turbulence model was adopted and the results of the model were reasonable and verifiable, while most CFD modeling in the field of ABL. This study calculated the fluid dynamical equations, as was suggested by B.E. Launder and D.B. Spalding [11], to stimulate the incompressible turbulent flow act, under the condition of turbulent flow field.
With reference to the analysis of k-ε turbulence model done by P.J.Richards, R.P. Hoxey [12], in the application of wind engineering, at the height of 200 meters or lower than Atmospheric Boundary Layer, the governing equations were as followed: CFD solved the system of fluid dynamical equations (including momentum equation, continuity equation and state equation) based on a continuity equation of three-dimensional conservation of momentum:
(1) 0 x u i i (2) . ) ( i i j j i t j i j j i g x u x u x x p x u u
Considered as the most popular, well-established and broadly tested turbulence model, a standard k-ε two-equation turbulent model was adopted for turbulence closure, as follows:
(3) . P x k σ μ μ x x k u j k t j j
j
(4) . k 2 ρε ε2 C k P ε1 C x x x u j t j j j
Where the production term was expressed as
(5) . i j j i i j t x u x u x u P
The turbulent viscosity, μt, was computed by combining k and ε as below:
.
2
t C k
The signs k and ε were the turbulent kinetic energy and the turbulent energy dissipation rate. The model constants Cμ, Cε1, Cε2, σk and σε were set as 0.09, 1.44, 1.92, 1.0 and 1.3. The selection of simulated area was established on the street block around the base to improve credibility of simulation. In the setting of simulated boundary calculating area, the size of boundary area set by J. Bouyera, C. Inard and M. Musy[13] was the parameter value. Therefore, the boundary area in case was 771m×624m×150m (Fig.3.). In the area for simulation calculation, the method of mean grid setting will be adopted to verify the digital simulation.
IV. RESULTSANDDISCUSSION
A. Street open space
The results of the CFD simulation were showed in TABLE II and TABLE III, it was clear to see that at the height of 1.5m, the wind flow of the street block went from northeast in winter.
As the street block type of layout had formed an area of open space, which was called street canyon, the air flow through both sides of the building and generated a channel effect. (TABLE II-e) Since the wind flew from a wide area to the narrow street, the area of its flowing passage diminishing, the wind speed at the end of the side of the building accelerated and formulated an area of high wind speed. In
particular, when the wind velocity achieved the utmost, the wind velocity change became more obvious, developing the corner wind at the end of the lower part of the building wall. (TABLE II-f)
In Test 8 at the windward side, in most periods of time the wind velocity was low due to the block of nearby building (TABLE II.-a~ TABLE II.-d) only with an evident increased when it achieved the maximum instantaneous wind velocity. At the measuring point of Test 9, in the middle of the open space between buildings, the air flow was averagely distributed and the change of wind velocity was small. However, in test 10 at the lee side, the building layout caused the air to flow through the side of the building and form a part channel effect at the far end of the open space.
TABLEI
DISTRIBUTION OF MEASURING POINTS IN SHEZI ISLAND CASES.
Season Spring Summer Autumn Winter survey period
Average wind speed 0.6 0.5 0.6 0.6 2005-2011
Wind direction Northeast Southeast East Northeast
Maximum instantaneous wind(month)
10.7 21 18.8 10.7 2005
16.1 13 10.7 14.3 2006
9.8 10.7 27.7 11.2 2007
13 14.3 10.7 8.9 2008
12.1 12.1 13.9 8.9 2009
- - 8.9 8.5 2010
7.6 11.6 11.2 13.9 2011
Maximum Instantaneous Wind average 11.6 13.8 14.6 10.9 2005-2011
Fig. 3. parameters setting of simulation model
TABLEII
DIAGRAMSOFSIMULATIONFROMMEASURINGPOINTSINWINTER
H H=1.5m H=5m H=10m H=15m
a b c d
Average wind
velocity-height change in winter
Velocity m/s
e f g h
Maximum instantaneous
wind
velocity-height change in winter
TABLEIII
DIAGRAMSOFDIGITALSIMULATIONFROMMEASURINGPOINTSINAUTUMN
H=1.5m H=5m H=10m H=15m a b c d
Average wind velocity-height change
in winter
Velocity m/s
e f g h
Maximum instantaneous wind velocity-height change in winter
TABLEIV
SIMULATIONOFWINDVELOCITYINSTREETOPENSPACE.
Black D/H Section line Simulation of wind velocity flow field Simulation of wind velocity
A 1.16
B 1.24
a-a’ Section digital simulation of street open space in winter
A 0.87
B 0.95
b-b’ Section digital simulation of street open space in winter
A 0.63
B 0.79
c-c’ Section digital simulation of street open space in winter
A 1.16
B 1.24
d-d’ Section digital simulation of street open space in autumn
A 0.87
B 0.95
e-e’ Section digital simulation of street open space in autumn
A 0.63
B 0.79
f-f’ Section digital simulation of street open space in autumn
Velocity m/s
0.00 0.50 1.00 1.50 2.00 2.50 3.00 3.50 4.00 4.50 5.00+
a
a’
b
b’
c’ c
d
d’
e
e’
f
f’
B. The proportion of open space area to street area and environmental comfort
The results of simulation of wind environment in the case of street open space showed that most values of D/H were smaller than 1. In winter, the wind velocity at windward side of open space grew as the height of the building increase. (TABLE IV. a-a’, b-b’ section) Wind velocity in the area was high therefore reducing the comfort under the condition of short-term stay. Street of open space was affected by the building layout on each side which can generate a channel effect, higher wind velocity at the side of street, and wind circulations in the middle when wind velocity achieved the maximum in autumn.( TABLE IV c-c’ section).
V. CONCLUSIONS
This study adopted the method of wind simulation and proved that building layouts affected the flow field of open space which was main area for outdoor activities and rest. Wind speed of the monsoon and building layout had an influence on the wind environment of urban open space. Therefore the design of building complex should take into consideration the prevailing wind direction and avoid facing the windward side or an enclosed building compound for the sake of natural ventilation simulation could improve efficacy of advanced evaluation of urban design plan and hence, provided important references to quantifiable projects in the original plan as well as the principles and influence of the design plan.
The result is that planners and designers taking advantage of BIM can develop and demonstrate design benefits and alternative possibility to avoid wrong decision and improve the quality of environment for sustainable city.
It was found that wind simulation could produce useable graphic presentation on the site. Ecotect delivered output that can help the architect understood the condition of the site provided by Ecotect. The other purpose of the study was to investigate the incorporation of BIM and Ecotect and how they interact in the process. With the improvement of technology and simulating programs so will the developing of modeling and analyzing tools in architecture development. The integration of BIM does not make the design process infallible but opens of possibilities of conclusions that otherwise would not be possible. The results can feedback to the planner and designer to modify the layout of buildings to have a more comfortable and energy saving new town.
ACKNOWLEDGMENT
The authors would like to thank the National Science Council of the Republic of China for Financially supporting this research under Contract No. NSC 01-2627-E-027-001 -MY3.
REFERENCES
[1] ZhongXi Lin, “Cloud BIM: A Web-Based BIM System with Application of Cloud Computing and WebGL,” 2012.
[2] MengHan Cai, “Strategies of Adopting BIM Tools to a Construction Firm”, 2011.
[3] M. Carmona, S. Tiesdell, T. Heath and T. Oc, "Public places-urban spaces: the dimensions of urban design," Elsevier Ltd,(2010) 227. [4] A. S. Hussein and H. El-Shishiny, “Influences of wind flow
over heritage sites: A case study of the wind environment over the Giza Plateau in Egypt”, Environmental Modelling & Software , vol. 24, 2009, pp. 389-410.
[5] P. Gousseau, B. Blocken, T. Stathopoulos and G. J. F. van Heijst, “CFD simulation of near-field pollutant dispersion on a high-resolution grid: A case study by LES and RANS for a building group in downtown Montreal”, Atmospheric Environment, vol. 45, 2011, pp. 428-438.
[6] B. Blocken, T. Stathopoulos, J. Carmeliet and J. Hensen, “Application of CFD in building performance simulation for the outdoor environment”, Building Simulatio, vol. 11, 2009, pp. 489-496.
[7] Xiao Baoyi.(2005)Wind Engineering. Taipei: Scientific & Technical Publishing Co., Ltd.
[8] Hong Yi’An A study on the ventilation assessment of community environment in summer. National Cheng Kung University Department of Architecture, Taiwan(2007). [in Chinese]
[9] Google Map Website, http://maps.google.com.tw/;2012[accseeed 25.04 .12]
[10] D.M. Hargreaves, N.G. Wright(2007). On the use of the k-epsilon model in commercial CFD software to model the neutral atmospheric boundary layer. Journal of Wind Engineering and Industrial Aerodynamics, vol. 95, 355-369.
[11] B.E. Launder and D.B.Spalding(1974). The numerical computation of turbulent flows. Computer methods in applied mechanics and engineering, Vol. 3.269-289.
[12] P. J. Richards, R. P. Hoxey(1993), Appropriate boundary conditions for computational wind engineering models using the k-ϵ turbulence model, Journal of Wind Engineering and Industrial Aerodynamics, 46, 145-153.
[13] J. Bouyera,C. Inard,M. Musy, Microclimatic coupling as a solution to improve building energy simulation in an urban context, Energy and Buildings 43 (2011) 1549–1559
[14] Central Weather Bureau Available: