LEABHARLANN CHOLAISTE NA TRIONOIDE, BAILE ATHA CLIATH TRINITY COLLEGE LIBRARY DUBLIN OUscoil Atha Cliath The University of Dublin
Terms and Conditions of Use of Digitised Theses from Trinity College Library Dublin
Copyright statement
All material supplied by Trinity College Library is protected by copyright (under the Copyright and Related Rights Act, 2000 as amended) and other relevant Intellectual Property Rights. By accessing and using a Digitised Thesis from Trinity College Library you acknowledge that all Intellectual Property Rights in any Works supplied are the sole and exclusive property of the copyright and/or other I PR holder. Specific copyright holders may not be explicitly identified. Use of materials from other sources within a thesis should not be construed as a claim over them.
A non-exclusive, non-transferable licence is hereby granted to those using or reproducing, in whole or in part, the material for valid purposes, providing the copyright owners are acknowledged using the normal conventions. Where specific permission to use material is required, this is identified and such permission must be sought from the copyright holder or agency cited.
Liability statement
By using a Digitised Thesis, I accept that Trinity College Dublin bears no legal responsibility for the accuracy, legality or comprehensiveness of materials contained within the thesis, and that Trinity College Dublin accepts no liability for indirect, consequential, or incidental, damages or losses arising from use of the thesis for whatever reason. Information located in a thesis may be subject to specific use constraints, details of which may not be explicitly described. It is the responsibility of potential and actual users to be aware of such constraints and to abide by them. By making use of material from a digitised thesis, you accept these copyright and disclaimer provisions. Where it is brought to the attention of Trinity College Library that there may be a breach of copyright or other restraint, it is the policy to withdraw or take down access to a thesis while the issue is being resolved.
Access Agreement
By using a Digitised Thesis from Trinity College Library you are bound by the following Terms & Conditions. Please read them carefully.
Essays on the Causes and Consequences of
International Migration
Benjamin Eisner
Departm ent of Economics
Trinity College
University of Dublin
Thesis submitted to Trinity College, University of Dublin in
fulfilment of the requirements for the degree of Doctor of
Philosophy (Ph.D.)
TRINITY C O L L E G E ^
Declaration
I declare that this thesis has not been submitted as an exercise for
a degree at this or any other university and is entirely my own
work. All research contained herein that is not entirely my own
but is based on research that has been carried out jointly with oth
ers is duly acknowledged in the text wherever included.
I agree to deposit this thesis in the University's open access in
stitutional repository or allow the library to do so on my behalf,
subject to Irish Copyright Legislation and Trinity College Library
conditions of use and acknowledgement.
Benjamin Eisner
Date
Summary
This thesis is a collection of three essays on the economic consequences of
international migration.
The first chapter studies the impact of emigration on wages in the sending
countries. It exploits a change in the migration laws in Europe following EU
enlargem ent in 2004 which triggered an emigration wave of 1.2 million workers
within 3 years. Using data from Lithuania, the UK and Ireland, I find that
emigration led to an increase in the wages of stayers. For a 10 percentage-point
increase in the emigration rate, wages increased on average by 6.6%. This effect
is statistically significant for men, but not for women.
Chapter 2 is closely related to the first chapter, b u t extends the analysis
along two im portant dimensions. First, it looks at the distributional impacts
between different education and experience levels, and second, it incorporates
general equilibrium effects that may become im portant w hen a significant share
of the workforce emigrates. Using the same data as in chapter 1, I estimate
the param eters of a structural model of labor dem and, and sim ulate the post
enlargem ent m igration wave as a labor supply shock. The model shows that
emigration had a significant effect on the wage distribution in the sending
countries. Moreover, general equilibrium effects dam pen the large wage re
sponse found in chapter 1. As a result, emigration only increased the wages of
young workers, while it had no significant effect on older workers.
Acknowledgements
First and foremost, I w ould like to thank my advisor Gaia Narciso for all
her support and guidance she offered me in the last 4 years. She constantly
encouraged me to keep an eye out for relevant questions and to go dow n the
extra mile in order to turn them into fruitful research ventures, which is a skill
that should greatly benefit me in my research career.
I am also very grateful to m any people who gave me valuable feedback
on my ongoing work and acted as mentors, in particular Catia Batista, Carol
N ewm an, Giovanni Peri, Jacco Thijssen, Pedro Vicente, and Michael Wycher
ley. My w ork greatly benefitted from m any discussions over a coffee or lunch
w ith Karol Borowiecki, Christian Danne, Emma How ard, Julia Anna Matz, Co-
rina Miller, Tara Mclndoe-Calder, Theodore Talbot, Conor O'Toole, and Janis
Umblijs, and their competent and honest feedback.
I am confident to say that I had the best PhD colleagues I could imagine.
With m any of them I became friends for life, and I will greatly miss our lively
discussions, coffee breaks and the occasional drinks in the Duke and elsewhere.
The D epartm ent of Economics in TCD and the Institute for International
Integration Studies provided an inspiring research environment. Doors were
always open for PhD students and the feedback and mentoring from the faculty
ensured that I was able to get through the PhD w ithout excessive frustration.
I am also very grateful to the members of the Developm ent/M icro Working
G roup for their honest feedback, which brought my research projects on the
right track at an early stage. Special thanks also go to the secretaries Colette
Ding, Patricia Hughes, and Colette Keleher, the PhD coordinators Patrick Hon-
ohan, Pedro Vicente, and Michael Wycherley, w ithout whom the PhD w ould
have been m uch more complicated.
Going through 4 years of PhD w ork w ould not have been possible w ithout
funding from the Strategic Innovation Funds (SIF) and the Irish Research Coun
cil for the Hum anities and Social Sciences (IRCHSS). The TCD Student Travel
Funds and the Departm ent of Economics generously supported m y conference
travels.
During the spring term in 20111 was fortunate enough to spend three very
productive m onths at Bocconi University" in Milan. I am thankful to Gaia N ar
ciso and Gianmarco Ottaviano for arranging this research visit.
frustration was gone every time I took a break and recharged my batteries in
Bavaria. I am also very happy to be moving closer to them, so that we should
be able to spend more time w ith each other.
Contents
I
Introduction
9
II
Emigration and its Impact on Wages
13
1
D oes Emigration Benefit the Stayers? Evidence
from EU Enlargement
15
1.1 In tro d u c tio n ... 16
1.2 EU Enlargement and M ig ra tio n ... 17
1.3 Data and Descriptive Statistics ... 19
1.3.1 Lithuanian Household Budget S u rv e y ... 19
1.3.2 Irish C e n s u s ... 20
1.3.3 Irish and UK Work Permit D a ta ... 20
1.3.4 Calculation of Emigrant N u m b e r s ... 23
1.4 Empirical Framework ... 26
1.4.1 The Skill Group A p p ro ach ... 26
1.4.2 Empirical M o d e l ... 27
1.4.3 Identification Issues ... 28
1.5 Empirical A n a ly s is ... 34
1.5.1 Estimation R e s u l t s ... 34
1.5.2 Discussion of the Results ... 37
1.6 C o n clu sio n ... 38
l.A Appendix ... 40
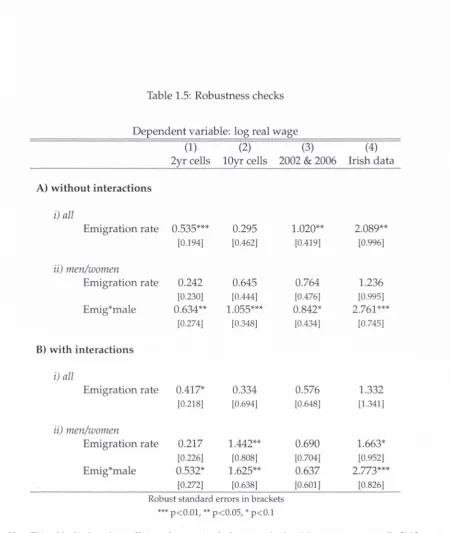
l.A .l Robustness C h e c k s ... 40
1.A.2 Education Groups ... 40
l.A .3 F ig u re s ... 43
2
Emigration and Wages: The EU Enlargement Ex
2.1 I n tr o d u c tio n ... 46
2.2 EU Enlargement, M igration and Wages: Stylized F acts... 48
2.3 Structural Model ... 51
2.3.1 Aggregate P r o d u c tio n ... 52
2.3.2 Labor M arket E q u ilib riu m ... 53
2.4 Data and Descriptive Statistics ... 55
2.4.1 Lithuanian Household Budget S u rv e y ... 56
2.4.2 Irish C e n s u s ... 58
2.4.3 Work Permit Data: PPS and NINo N u m b e r s ... 59
2.4.4 Calculation of Emigration Rates ... 60
2.5 Estimation of Structural Parameters ... 62
2.5.1 Identification and Estimation of 62 2.5.2 Estimation of CT£D ... 68
2.6 Simulation of the Wage Effects ... 70
2.6.1 Simulation E q u a tio n ... 70
2.6.2 Model Calibration and Simulation Results ... 70
2.6.3 Alternative Calibrations for (Tf;xp arid CT££)... 73
2.6.4 Comparison of the Structural Estimates with Reduced-Eorm Re sults ... 74
2.6.5 Discussion of the Results ... 77
2.7 C o n clu sio n ... 79
2. A Estimation of a e x p '- Data on Men only ... 81
2.B Sensitivity A n a ly sis... 81
2.B.1 Irish Data o n l y ... 82
2.C Tables and Figures ... 83
III Networks and Migration Decisions
85
3Migrant Networks and the Spread of Misinfor
mation
87
3.1 I n tro d u c tio n ... 883.2 M igrant Networks as Providers of In fo rm a tio n ... 90
3.3 A Theoretical Model of Misinformation and the Decision to Migrate . . . 92
3.3.1 Intuition from a Simple M o d e l ... 92
3.3.2 Networks and the Timing of M ig r a tio n ... 94
3.4.1 Em pirical S t r a t e g y ... 98
3.4.2 D ata and D escriptive S t a t i s t i c s ... 100
3.4.3 R e s u l t s ... 108
3.5 C o n c lu s io n ...115
3.A D ynam ic Decision M odel ... 117
3.A.1 D erivation of p * ... 117
3.A.2 Proof: p* w ell-defined...119
3.B A ssim ilation I n d e x ... 120
3.C Robustness C h e c k s ... 121
3.C.1 A lternative s p e c ific a tio n s ... 121
3.D D ata A ppendix ... 123
3.D.1 Education G roups ... 123
IV
Conclusions
125
List of Tables
1.1 Summary statistics L i t h u a n ia ... 21
1.2 Summary statistics Irish c e n s u s ... 22
1.3 The wage effect of e m ig ra tio n ... 34
1.4 Estimation of the wage effect w ith additional c o n tro ls ... 36
1.5 Robustness checks ... 41
2.1 Summary statistics Lithuanian HBS ... 57
2.2 Emigration rates 2002-2006... 62
2.3 Regression results for c T f ; x p ... 66
2.4 OLS results for cTf;£)... 69
2.5 Decomposition of the wage effect of emigration ... 72
2.6 Sensitivity a n a ly s is ... 75
2.7 Regression results for cT£;xp - rnen o n l y ... 81
2.8 Aggregation of education groups in the Lithuanian HBS and the Irish census ... 83
3.1 Probability distribution of terminal n o d e s ... 94
3.2 Parameters for the simulations ... 96
3.3 Summary statistics: Mexicans in the U S ...106
3.4 Summary statistics for selected areas in 2000 ... 107
3.5 Networks and the success of recent im m ig rants...108
3.6 Alternative dependent variables ...I l l 3.7 Robustness check: including employment g r o w t h ...112
3.8 Robustness check: including state fixed e f f e c t s ...114
3.9 Networks and the timing of m ig r a tio n ...116
3.10 Dropped observations w ithout assimilation i n d e x ...122
List of Figures
1.1 Lithuanian immigrants to the UK and Ireland, 2002-2007 ... 23
1.2 FDI, exports, GDP per capita, and the unemployment rate in Lithuania, 2002-2006 ... 31
1.3 Standardized wage distribution in Lithuania, 2002 and 2006 ... 32
1.4 Standardized wage distribution for men and wom en in Lithuania, 2002 and 2006 ... 43
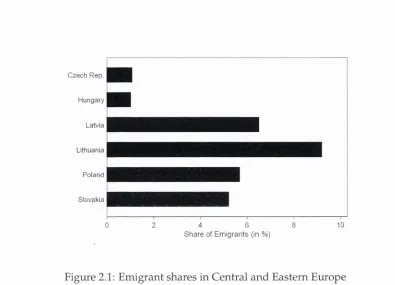
2.1 Emigrant shares in Central and Eastern E u ro p e ... 49
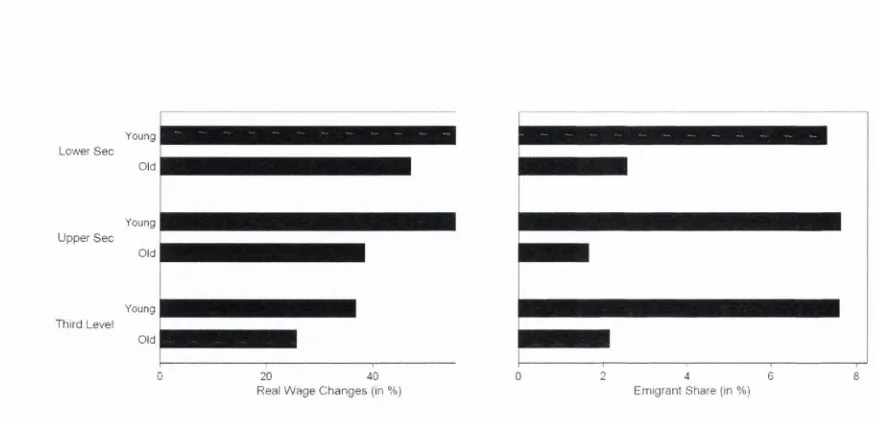
2.2 Real wage changes and em igrant shares in Lithuania ... 50
2.3 Wage premia by work experience and e d u c a tio n ... 51
2.4 Nested CES production f u n c t i o n ... 54
2.5 Education and age distribution of immigrants from the New Member States in the UK and Ir e la n d ... 61
2.6 Num ber of births per year in Lithuania ... 64
2.7 The impact of emigration on w a g e s ... 71
2.8 Comparison; structural model vs. reduced f o r m ... 76
2.9 O ver-/under-representation of workers aged 14-34 by occupation . . . . 78
3.1 Ethnic enclave (left) and loosely connected network ( r ig h t ) ... 91
3.2 Decision tree for a potential migrant; First stage (left), second stage(right) 94 3.3 Comparative statics: change in the network quality A... 97
3.4 Comparative statics: variation in the model p a ra m e te rs ... 98
Part I
This thesis contains three chapters on the economic causes and consequences of international migration.
The first two chapters analyze the impact of emigration on the wage structure in the m igrant sending countries. While most of the literature on the wage effects of m igration has focused on the receiving countries, we know very little on the effect of migration in the sending countries. In both chapters I exploit the enlargem ent of the European Union in 2004, which triggered a large migration wave from Eastern Europe to the UK and Ireland.
The first chapter asks w hether this emigration wave had a positive effect on wages in the sending country. A simple supply-and-dem and framework would predict that emigration makes the remaining workers a more scarce resource and leads to an in crease in wages. The size of the wage increase depends on the dem and elasticity — the reaction of labor dem and to a change in wages. Most studies on the receiving countries found the dem and elasticity to be very small, and thereby migration to have little effect on wages (Friedberg & Hunt, 1995; Kerr & Kerr, 2011). If labor markets in the sending countries are different, the wage effects of migration may be more or less pronounced than in the receiving countries. For the estimation I use a skill group approach as in Borjas (2003), which clusters the workforce into several skill groups de fined by education and work experience. In a reduced-form regression this approach relates real wages to the share of emigrants per skill group and exploits the variation in wages and emigration rates within skill groups over time. Identification is based on an exogenous change in the migration laws following EU enlargement. Workers were only allowed to move to the old member states of the EU after the enlargement in 2004, even though the incentives to migrate had existed long before 2004. Using data from Lithuania and the two main receiving countries, Ireland and the UK, I find that emigration had, on average, a positive effect on the workers that stay behind. Yet the effect is only statistically significant for men, not for women.
While the first chapter provides robust evidence for an average wage effect, it has two im portant limitations. First, the reduced-form approach does not allow for an analysis of the distributional effects of emigration. In Eastern Europe, distributional effects are potentially large, as the emigration wave after EU enlargement led to an ex odus of young workers, while old workers stayed behind. Second, it does not account for aggregate dem and effects. If a share of the workforce leaves the country, this can dam pen aggregate demand, which in turn decreases wages.
different degrees of substitutability between workers with different education and ex perience and that incorporates aggregate dem and effects. I first estimate the structural param eters of the model, which I use to calibrate the model on the Lithuanian labor market. Based on stock and flow data from the UK and Ireland I simulate the post enlargement emigration wave and calculate the effect of emigration on the wages of different groups of workers. The results show that only the youngest cohort gained from emigration. There are two channels that lead to this result. First, most of the em igrants were young, so that the own-wage effect is higher for young workers. Second, the emigration wave dam pened aggregate labor demand, which decreased the wages for all workers. For young workers the difference of both effects is positive, while for older workers the two effects cancel each other out.
The third chapter, co-authored with Gaia Narciso and Jacco Thijssen, studies the impact of diaspora netw orks on m igration decisions. These networks play an impor tant role in passing on information about job prospects to future migrants, but not all networks have the same knowledge about the labor m arket in the receiving country. We argue that networks that are more integrated in the society of the receiving country have a better knowledge of the labor m arket than ethnic enclaves. Members of an en clave mostly have connections with other members and receive little information from the world outside the enclave. Therefore, misinformation about job prospects is more persistent in ethnic enclaves.
Part II
Chapter 1
D oes Emigration Benefit the Stayers? Evidence from
EU Enlargement
1.1 Introduction
Migration affects both sending and receiving countries. While a vast literature docu ments the impact of migration on wages and employm ent in the receiving countries, there is only sparse evidence on its impact on the sending countries.^
In this paper I exploit the em igration wave from Lithuania after the enlargement of the European Union to study the effect of emigration on wages in the sending coun tries. With EU enlargement in 2004, Lithuanian workers were allowed to migrate w ith out restrictions to the United Kingdom (UK), Ireland and Sweden. Between 2004 and 2007, around 9% of the workforce took this opportunity and emigrated to the UK and Ireland. The large emigration wave - caused by a change in the institutional frame work - makes Lithuania an ideal case study of a sending country.
To identify the effect of emigration on wages, I use the skill-group approach pro posed by Borjas (2003). This approach clusters the workforce in a num ber of skill groups - defined by gender, education, and work experience - and compares emi gration rates and real wages w ithin each skill group before and after EU enlargement.
Using microdata from Lithuania, and work perm it and census data from the UK and Ireland, I show that emigration has a significant positive effect on the wages of stayers. Groups with larger emigration rates had higher wage increases. A 10% in crease in the emigration rate predicts an average increase in real wages of 6.6%. This positive effect, however, is only statistically significant for men, but not for women. Given that emigration was triggered by an exogenous change in migration laws, the results can be interpreted as causal.
The positive effect of m igration on wages is consistent with a simple supply-and- dem and framework. Migration decreases labor supply, which - given a dow nw ard- sloping labor dem and curve - leads to an increase in wages. The absence of a statisti cally significant effect for women is surprising, given that women accounted for 40% of all emigrants. Potential explanations are a positive self-selection of female emigrants, or endogenous responses in labor supply, i.e. women who had not been w orking pre viously filled the job of women w ho emigrated.
The institutional arrangem ents in the European Union allow me to overcome data constraints that are inherent in the study of sending countries. Sending countries typi cally do not keep records of emigrants, which makes it difficult to quantify the number of emigrants. With EU enlargement, workers from the new member states were only allowed to m igrate to the UK, Ireland, and Sweden. Therefore, it is possible to cal culate the num ber of Lithuanian emigrants from the census and w ork perm it data of
these countries.
To be certain, identification faces several challenges. O ne challenge is om itted v ari able bias. Wages are determ in ed by num erou s factors other than m igration, for exam ple FDI inflows, trade, or unem ploym ent. If these factors are om itted from th e m odel, the results m ay be biased. To tackle this problem , I ad d a rich set of d u m m y variables an d interaction term s to the regression, w hich account for changes in the retu rn s to edu catio n and experience, an d differences in the age-earnings-profile across education groups. In addition, I control for FDI, exports, an d unem ploy m ent at the regional level. The results are n ot sensitive to the inclusion of these variables, however.
A n additional challenge is self-selection. Average w ages m ay increase, sim ply be cause w orkers from the low er end of the w age d istribution have left the country. G iven the data on em igrants from the UK an d Ireland, it is n ot possible to assess directly w h eth er em igrants w ithin a skill g roup w ere negatively selected. An inspection of the w age distribution in Lithuania before an d after EU enlargem ent, how ever, does n o t indicate a negative selection. M oreover, as the receiving countries have on av er age higher skill requirem ents, selection should be positive, and the results w o u ld be dow nw ard-biased.
This p ap er add s to the literature on the w age effect of em igration, as it show s that em igration increases w ages in the short run. Previous literature has looked at long stan d in g m igration m ovem ents. U sing the sam e approach as this study, M ishra (2007) an d A ydem ir & Borjas (2007) show that em igration from Mexico to the US has led to a long-run increase in w ages in Mexico. Bouton et al. (2011) find sim ilar results for M oldova. This paper, by contrast, exploits a su d d e n em igration shock to show that em igration increases w ages even in the short run.^
The EU enlargem ent w as one of the rare occasions in w hich high-incom e countries op ened their borders for w orkers in m iddle-incom e countries. The results of this stu d y are therefore of interest for m iddle-incom e countries that m ay face a sim ilar situation in the future. If the US, for exam ple, opened its b orders for w orkers from South Am erica, it w o u ld be helpful for policym akers in the sending countries to know w h a t fraction of the p op ulatio n they can expect to em igrate, and w h at consequences this em igration w ave has on the labor m arket.
1.2 EU Enlargement and Migration
The EU enlargem ent in M ay 2004 w as a m ilestone in the process of E uropean inte gration. 15 years after the fall of the Iron C urtain, 8 form er socialist countries from
Central and Eastern Europe became members of the European Union. At the time of EU enlargement, the new member states were still in the process of economic transi tion. Com pared to Western Europe, economic output in the new member states was considerably lower, which also translated into substantial wage differentials. In 2004, wage differentials were highest in Latvia and Lithuania, where workers earned on av erage 30% of the PPP-adjusted wage in the UK.^
As wage differentials are a major driving force of international migration, the mi gration potential in the new member states before ELI enlargement was substantial. Studies that estimated the m igration potential from the new member states before the enlargement predicted that between 3% (Bauer & Zimmermann, 1999; Boeri & Briicker, 2001) and 5% (Sinn, 2004) of the population of the new member states would migrate within 15 years.
With freedom of movement being a core principle of the European Union, the en largement w ould have allowed w orkers from the new member states to work in any other EU country. Policymakers in the old member states, however, feared that a large immigration wave from Eastern Europe could depress wages, increase unemployment (Zaiceva & Zimmermann, 2008), and impose a burden on the welfare state, and de cided to give the old member states the option to restrict access to their labor markets until 2011. Only the UK, Ireland, and Sweden opened their labor markets in 2004.
Given the restrictions in other potential destination countries — above all Germany and France — and the good economic conditions in the UK and Ireland, it was no sur prise that these two countries were the destination for the majority of workers from Eastern Europe. Between 2004 and 2007 the UK issued around 770,000 and Ireland around 400,000 w ork perm its to workers from the new member states, while only 19,000 workers w ent to Sweden (Wadensjo, 2007). Eisner (2011) shows that the magni tude of the emigration wave was particularly large in Lithuania. 9% of all Lithuanian workers received a w ork perm it in the UK and Ireland — in Latvia and Slovakia the share was 6%, in Poland 5%.^ Most of the emigrants were young, and had a m edium to high education level (Zaiceva & Zimmerm ann, 2008).
A num ber of studies have evaluated the economic consequences of this migration wave.^ Most studies on the receiving countries did not find the effects of the immigra tion wave on wages and em ploym ent to be large (Barrett, 2009; Blanchflower & Shad- forth, 2009). On the side of the sending countries, the evidence is purely descriptive. Kaczmarczyk et al. (2009) and Hazans & Philips (2009) illustrate that wages in Poland
^Own calculations from Eurostat.
^Hungary and the Czech Republic, on the contrary, had outflow s of less than 1%.
and the Baltic States increased w hile unem p loy m ent decreased after EU enlargem ent. This p a p e r extends the existing literature, as it presents a first econom etric evaluation of the effect of the post-enlargem ent m igration w ave on the source countries.
1.3 Data and Descriptive Statistics
To analyze the effect of em igration on w ages, one w ou ld ideally like to use a m icro dataset that contains inform ation on both em igrants an d stayers. Such a dataset, h o w ever, is usually n ot available for the sending countries. In m ost countries, em igrants are n o t obliged to de-register, w liich m akes it difficult for the sending countries to keep reliable records on their em igrants. Follow ing M ishra (2007), I use data from the tw o m ain destination countries — Ireland and the UK — to calculate the n u m b er of L ithua nian em igrants for different groups of w orkers an d m atch them w ith stayers from the sam e groups. The rem ainder of this section describes the datasets used in this stu dy and explains the calculation of the n um ber of em igrants.^
1.3.1 L ith u an ian H o u seh o ld B udget S urvey
The core d ataset of this stu d y is the L ithuanian H ousehold Budget Survey (HBS), w hich is available for the years 2002, 2003, 2005 an d 2006. The HBS is an ann ual sur vey of 7,000-8,000 households; it is representative at the ind iv id ual level an d contains inform ation on incom e and expenditure, as well as ind ivid ual characteristics such as sex, age, education and place of residence. The HBS does not contain inform ation on occupations, industries, or sectors.
The sam ple contains em ployees aged 18-64 w orking in the p riv ate sector. I exclude public sector w orkers because w ages in the public sector are typically d eterm in ed by seniority p ay and not by su p p ly and dem and. In addition, I d ro p w orkers w ith zero or negative disposable income, pensioners, self-em ployed w orkers an d w orkers w hose m ain income com es from their ow n farm.
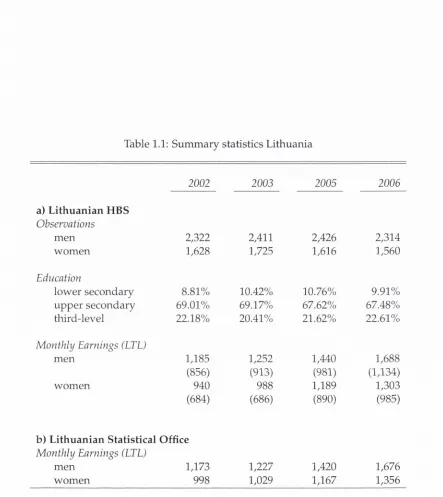
The variable income from employment, deflated by the HCPI, gives inform ation on real m onthly gross w ages. As w e can see in Table 1.1a), real w ages increased by aro und 40% betw een 2002 to 2006. A long w ith the w age level, the stan d ard deviation of w ages increased.
A potential concern w ith ho useho ld b u d g et surveys is over- or u n der-repo rting of income, w hich can bias the results. To assess the degree of m isreporting bias, I com pare the self-reported real w ages from the HBS in Table 1.1a) w ith the w ages from the live register from the L ithuanian Statistical Office in Table 1.1b). It is reassuring that both
sources report similar average real wages, so that misreporting should not bias the results.
1.3.2 Irish Census
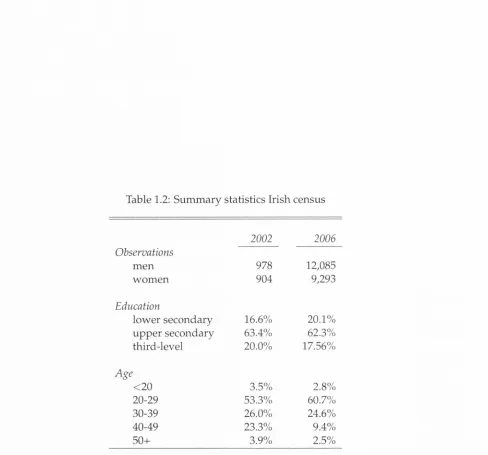
To obtain the stocks of Lithuanian m igrants in Ireland and to determine the m igrants' skill distribution I use data from the Irish census in 2002 and 2006.
The Irish census is carried out every 4-5 years and covers the entire population that is present in Ireland in the census night. For the 2002 and 2006 censuses, the Central Statistics Office (CSO) of Ireland provided a tabulation of the num ber of Lithuanians by their educational attainment, gender and age.
Table 1.2 reports the characteristics of Lithuanian migrants in Ireland in 2002 and 2006. Most migrants had an upper secondary education and were in their 20s. The num ber of men in 2006 was 30% higher than the num ber of women. The difference in the num ber of Lithuanians in Ireland between 2002 and 2006 shows that the major ity m ust have migrated to Ireland around or after the time of EU enlargement. N o tably, the education distribution did not change significantly over time, even though the stock of migrants in 2006 was 10 times higher than in 2002.
Com paring the migrants in Table 1.2b) to the stayers in Table 3.3a), we can see that the migrants were on average younger and less educated than stayers. The share of workers w ith a lower secondary education is larger among migrants, while there are relatively less migrants with an upper secondary or a third-level education. Migrants were on average 12 years younger than stayers.
1.3.3 Irish and UK Work Perm it Data
To obtain the total num ber of Lithuanian emigrants, I use w ork perm it data from the UK and Ireland. While the census data reflects a lower bound to the num ber of mi grants, the w ork perm it data is an upper bound of the migration flows from Lithuania to the UK and Ireland. Work perm it data captures every person who comes to the UK and Ireland and w ants to take up employment, be it for a perm anent position or for a tem porary job. The num ber of workers w ho left the Lithuanian workforce perm a nently should therefore be lower than the num ber of work permits.
Figure 1.1 shows the num ber of w ork perm its granted to Lithuanians between 2002 and 2007. In total, the num ber of Lithuanian migrants to the UK and Ireland am ounted to 150,000. As we can see, the migration wave set in w ith EU enlargement in 2004 and reached its peak in 2005.
Table 1.1: Sum m ary statistics Lithuania
2002 2003 2005 2006
a) L ithuanian HBS Observations
m en 2,322 2,411 2,426 2,314
w om en 1,628 1,725 1,616 ],560
Education
low er secondary 8.81% 10.42% 10.76% 9.91%
upper secondary 69.01% 69.17% 67.62% 67.48%
third-level 22.18% 20.41% 21.62% 22.61%
M onthly Earnings (LTL)
m en 1,185 1,252 1,440 1,688
(856) (913) (981) (1,134)
w om en 940 988 1,189 1,303
(684) (686) (890) (985)
b) L ithuanian Statistical O ffice M onthly Earnings (LTL)
m en 1,173 1,227 1,420 1,676
w om en 998 1,029 1,167 1,356
N ote: a): Summ ary statistics for all employees between 18 and 64 years. Education groups: lower secondary education (10 years or less of schooling), upper secondary education (more than 10 years of schooling, but no finished third- level education), third-level degree (at least 15 years of schooling and B.Sc equivalent). Percentages of educational distribution relative to all men and wom en in a given year. Monthly earnings are deflated by the HCPl. Standard errors of monthly earnings in parentheses.
Table 1.2: S um m ary statistics Irish census
2002 2006
Observations
m en 978 12,085
w om en 904 9,293
Education
low er secondary 16.6% 20.1%
u p p e r secondary 63.4% 62.3%
third-level 20.0% 17.56%
Age
<20 3.5% 2.8%
20-29 53.3% 60.7%
30-39 26.0% 24.6%
40-49 23.3% 9.4%
50+ 3.9% 2.5%
5 0 .0 0 0
03
o 4 0 .0 0 0 c
§ 3 0 ,0 0 0
D O
« 20,000 0) CL
10,000
Ireland UK
[image:29.536.66.438.52.328.2]2002 2 0 0 3 20 0 4 20 0 5 20 0 6 2007
Figure 1.1: Lithuanian immigrants to the UK and Ireland, 2002-2007
N otes: N u m b e r o f L ithuanian im m igran ts to the UK an d Ireland b e tw e e n 2002 and 2007, as m easu red b y the num ber o f w o r k p erm its (PPS N u m b e r in Ireland, N a tio n a l Insurance N u m b e rs in the UK),
Sources: Irish D ep artm ent o f Social and F am ily A ffairs, UK D ep artm ent for Work and P en sion s.
(NINo) for the UK and personal public service num bers (PPS) for Irela n d / The work perm it statistics reflect actual migration, because workers only receive a w ork perm it if they are physically present in the destination country. To obtain a w ork permit, a w orker has to report in person to the Social Welfare Office in Ireland or the Departm ent for Work and Pensions in the UK and produce a proof of address. If a w orker moves back-and-forth between Lithuania and either the UK or Ireland, she keeps her work perm it, so that repeated migration does not cause double counts.®
1.3.4 Calculation of Em igrant N um bers
From the census and work perm it data I now construct measures for the num ber of emigrants by gender, education, experience, and year. For the baseline specification I use a combination of all data sources, as the census is likely to under-estimate, and the w ork perm it data is likely to over-estimate the num ber of emigrants. Moreover,
^For further information about PPS and NINO numbers, see http://w w w .w elfare.ie and http://w w w .direct.gov.uk. In 2004 the UK introduced a Worker Registration Scheme (WRS) for w ork ers from the new m em ber states. Compared to the data from the WRS, NINo offers the advantage that it provides information on immigration before 2004. The WRS and NINo num bers after 2004 are similar.
only the Irish census contains information on the skill distribution of migrants, while the UK and Irish w ork perm it data only contains information on the inflows per year. Census data from the UK is not available for the time around EU enlargement, as the census was carried out in 2001 and 2011.^
To construct measures for the num ber of emigrants, I take the skill distribution of Lithuanian migrants from the Irish census and m ultiply it with a weighting factor which accounts for migrants to the UK. The calculation of the share of emigrants is based on the assum ption that the skill distribution of Lithuanian immigrants in Ire land is the same as the skill distribution of Lithuanians in the UK. As shown by Eisner (2011), this assum ption is justified, as the education and age distribution of migrants from the 8 New M ember States in Ireland and in the UK is almost identical. In addi tion, Hazans & Philips (2009) show that even though migrants from Latvia, Lithuania and Estonia w ork in different sectors in Ireland and the UK — in Ireland more in con struction and trade, in the UK more in agriculture and services — their education and age profile is the same in both countries.
To m ake use of all available rounds of the HBSI construct measures for the emigra tion rates in 2003 and 2005 from the censuses in 2002 and 2006, assuming that the skill distribution of migrants arriving in 2003 is the same as in 2002, and likewise that the skill distribution of migrants in 2005 is the same as in 2006. Table 1.2 suggests that the education distribution has been constant between 2002 and 2006, which implies that the education distribution has neither changed between 2002 and 2003, nor between 2005 and 2006. The age distribution, on the other hand, has changed between 2002 and 2006; the cohorts arriving after 2002 have been on average younger than the co horts before 2002. Nevertheless, given that 2002 and 2003 are both before and that 2005 and 2006 are both after EU enlargement, it is plausible to assume that workers coming in 2003 had roughly the same age distribution as those coming in 2002, and workers arriving in 2005 had the same age distribution as those arriving in 2006.
For t = (2002,2006), the num ber of emigrants is
( i + ■ ( 1 - 1 )
lEghj is the num ber of Lithuanians in Ireland in a gender(5)-education(/i,)-experience(j) cell at time t. N I N O t arid PPS t are the num bers of British and Irish work permits is sued to Lithuanians in year t. The first term in parentheses (1 in this case), accounts for the num ber of m igrants in the Irish census. The second term, , accounts for
m igrants to the UK. If, for exam ple, in 2006 the nu m ber of w o rk perm its in the UK w as
50% h ig her th an the n u m b er of w ork perm its in Ireland, this factor is 1.5.
For the year 2003 I take the skill d istribution from 2002 an d w eight it w ith the
inflow s of 2003. Analogously, for the year 2005 I use the skill distribution from 2006.
The n u m b er of em igrants for 2003 and 2005 are
A f 2003 _ r i r 2 0 0 2 ( P P S 2OO3 N I N O 2 0 0 3 \
+
P P S 2 O O 2 J
a^2 0 0 5 _ r p 2 0 0 6 ( P P S 2OO5 N I N O 2 0 0 5 \
^ [ P f ^ e + P P S 2 o o e ) ■
(1.2)
^ j . (1.3)
The first term in parentheses, ppsHH ppf^°°g accounts for the changes in inflows betw een 2002 and 2003, an d betw een 2005 and 2006.^° As in E quation (1.1), the second
term in parentheses represents the n u m b er of m igrants to the UK.
To calculate the em igration rate m p er skill group and year I divide the nu m ber of em igrants from Equations (1.1) to (1.3) by the po pu latio n in Lithuania of the same
group,
a p
2 ^ Pghjt I
The p o p u latio n of skill g roup g h j in year t is the sum of the sam pling w eights p^hji all w orkers i in the L ithuanian HBS th at belong to this group.
O ne m ight be concerned that the calculated em igration rate m ay over-estim ate
the actual change in labor supply, in case m igrants from other countries h ad come
to Lithuania an d taken u p the jobs of th e w orkers w ho left. In fact, the L ithuanian im
m igration statistics show an increase in the nu m b er of im m igrants betw een 2002 and
2006. A closer look, how ever, indicates th at this increase w as in large p arts driv en by
retu rn m igrants from the UK.^^
The share of em igrants could also be under-estim ated, if w orkers m o ved to other
countries besides the UK and Ireland. A particu lar concern m ay be em igration to Rus
sia. Russia is potentially an im po rtan t destination, as m ost L ithuanians speak Russian
as a second language an d both countries have strong econom ic ties. The R ussian im
m igration statistics, how ever, do not give any evidence for m ass im m igration from
10 consists of tw o factors: > w hich accounts for th e size of m ig ra n t flow s to the UK relative to Ireland and p p s H H ' accounting for th e change in m ig ratio n flows to Ireland from 2002 to 2003. By m ultiplication of those tw o term s, PPS2003 cancels out.
Lithuania; im m igration in the 2000s am o un ted to 200-300 L ithuanians per year.^^
1.4 Empirical Framework
The theoretical un d erp in n in g s for the em pirical strategy are derived from a sim ple
sup p ly -an d -d em an d m odel of a labor m arket. Em igration decreases the labor supply,
w hich shifts the labor su p p ly curve inw ards. G iven a constant, dow nw ard-slop in g
labor d em an d curve, em igration m akes the rem aining w orkers a m ore scarce resource,
and leads to an increase in wages.
1.4.1 The Skill Group Approach
To identify the average effect of em igration on w ages, I use the skill-group approach
pro po sed by Boijas (2003), w hich considers em igration rates an d w ages at the national
level a n d exploits the variation in both variables w ithin skill groups over time. If em
igration in deed increased w ages, w e sh ou ld observe higher w age increases in groups
w ith a higher share of em igrants.
A skill group is defined by the observable characteristics education and ivork experi
ence. The w orkforce consists of 27 skill groups - 3 education an d 9 experience groups.
The 3 education groups are low er secondary education (at m ost 10 years of schooling),
u p p e r secondary education (11-14 years of schooling), and third-level education (at
least 15 years of schooling).
A higher nu m b er of education g roup s w ou ld be desirable, as it w o uld allow for
m ore variation in em igration an d w ages across education groups. The available data,
how ever, im poses a constraint on the n u m b er of education groups. The datasets from
the sending and receiving countries differ in their classification of education groups;
the HBS contains 12, the Irish census only 5 categories. C hoosing 3 broad ed ucation
g roups m akes it possible to consistently m atch em igrants and stayers w ith the sam e
education level.
Each education group is divided into 9 experience groups: 0-4 years, 5-9 years, 10-
14 years, ..., 40+ years of w ork experience. The w ork experience is calculated as the
exposure to the labor m arket, i.e. the tim e since finishing education, experience = age
- education - 6. The value for education is 10 years for low er secondary, 12 years for
u p p e r secondary, and 15 years for third-level education.
’^The available immigration figures are 376 in 2000, 213 in 2005, and 228 in 2006. The Russian statistical office does not report immigration statistics for the time between 2000 and 2005. Source: w w w.gks.ru; the author can produce the table on request.
1.4.2 Empirical M odel
The em pirical m odel is a regression of individual w^ages on the share of em igrants in
the in d iv id u al's skill group, estim ated from pooled cross-sectional data. The baseline
estim ating equation is
= Snight + ^ g h t f ^ + + exper + (^-5)
w age of in div idu al i w ith education g, experience h in year t =
2002,2003,2005,2006. mg^t is the em igration rate for individual i's skill group. The
coefficient of interest, 5, denotes the percentage change in real w ages associated w ith a
1 percentage-point change in the em igration rate.
The d u m m y variables year, educ, an d exper absorb changes in average w ages
over time, an d differences in average w ages across education an d experience groups.
^ g h t ^ vector of in dividu al control variables, w hich include gender, m arital status,
w h eth er in dividu al i has children u n d er 18, an d w hether she lives in a city, is an
error term . Because m,ght, the regressor of interest, is a group variable defined by e d
ucation, experience and time, I cluster the stan d ard errors at the year, education, and
experience level.
The m odel in E quation (1.5) has the advantage th at it uses a low nu m b er of degrees
of freedom , b u t it potentially comes at the cost of om itted variable bias. The year,
educ, an d exper dum m ies reduce this bias, b u t there could be factors th a t have an
im pact on w ages over and above w h at is absorbed by the dum m ies. Exam ples are
changes in the retu rn s to education or experience, or d em and shifters such as FDI or
exports. To account for these factors, I extend the baseline m odel w ith the interaction
term s {year*educ), {year*exper), and {educ*exper). The interactions {year*educ) and
{year*exper) absorb changes in the retu rns to education an d experience; {educ*exper)
accouiits for differences in the age-earnings profile across education groups.
The inclusion of interaction term s has the additional advantag e that th ey absorb
cross-w age effects. If the und erly ing theoretical m odel has a heterogeneous w orkforce
w ith several skill groups, the im pact of em igration d ep en d s on the dem ographic char
acteristics of the em igrants com pared to the stayers (Card & Lemieux, 2001; Borjas,
2003). Em igration in one skill g roup affects the m arginal p ro d u ct of all o ther groups,
an d has a larger w age im pact on groups th at are close substitutes. A fter controlling
for cross-w age effects, 5 m easures the ow n-w age effect, i.e. the average effect of the
1.4.3 Identification Issues
Sources o f variation: skill groups vs. occupations vs. geography
The skill-group approach overcom es identification problem s inherent in the m igration
literature, by focusing on m igration an d w ages at the national level. A large n u m b er of
stud ies have u sed geographic variation of m igration an d w ages to identify the im pact of im m igration on the w ages of natives. The small and insignificant effect typically
fou n d in these studies can be the result of u no bserved adjustm ent in local labor m ar kets or of the endo gen ou s location choice of m igrants. If m igrants locate in areas w ith
m ore flexible labor m arkets, they m ay be absorbed w ith o u t depressing the w ages of
natives, or im m igration can trigger the outflow s of natives (Card, 2001). In ad dition , if m igran ts locate in areas that experience an econom ic boom and high w ages, a sp u ri
ous positive correlation betw een the share of im m igrants an d w ages m ay appear. The skill g roup approach, by contrast, elim inates the endogeneity in the location choice
of m igrants. E ndogeneity bias could only arise if m igrants w ere able to choose their skill group, b u t this is n o t possible as w orkers generally m ake their education decision
before they enter the workforce.
Some studies overcom e the bias resulting from endogenous location choice by ex plo iting variation in m igration rates and labor m arket outcom es w ithin occupations
at the national level (Card, 2001; Friedberg, 2001). If the occupation is pred eterm ined by the im m igran ts' education an d training, an d if im m igrants cannot easily sw itch to
occupations w ith higher w age grow th, it is possible to estim ate a causal effect of im m igration on w ages an d em ploym ent.
A lthough the w ithin-occupations approach can pro vide a clean identification, it requires inform ation on the occupation before em igration, w hich is n ot available for
L ith uan ian w orkers in Ireland a n d the UK. The only available inform ation is the m i
g ran ts' curren t occupation after em igration. In the context of EU enlargem ent, h o w
ever, it is n ot possible to use this inform ation to infer the occupation before em igration. As show n by Kahanec et al. (2009, p. 20), D rinkw ater et al. (2009) an d Saleheen & Shad-
fo rth (2006), im m igrant w orkers from the new m em ber states w ere overrepresented in
typical low -skilled occupations, alth ou gh their education level w as on average higher
th an the level of natives. The skill g roup approach, by contrast, clusters the w orkforce
in b ro ad er categories an d m akes em igrants and stayers com parable.
’^See Friedberg & Hunt (1995) and Kerr & Kerr (2011) for a review of this literature and Longhi et al.
Endogeneity issues
The m arginal effect of em igration on w ages only has a causal interpretation if em i
gratio n is exogenous. Ideally, one w o u ld ru n an experim ent, in w hich the em igration
rate is rand om ly assigned across skill groups. A fter controlling for all other factors
in E quation (1.5), the average change in w ages could then be exclusively attrib u ted to
em igration. As reality does n ot p erm it such experim ents, identification has to rely on
quasi-experim ental variation in em igration rates.
Identification in this stu d y is based on an exogenous change in m igration law s after
the EU accession of Lithuania in 2004. O nly w h en the country joined the E uropean
U nion w ere w orkers actually allow ed to em igrate an d take advantage of the higher
w ages in Western Europe. As Figure 1.1 show s, few L ithuanians m igrated to Ireland
and the UK before 2004, w hile the large m igration w ave began in 2004. U sing the
v ariation in em igration rates an d real w ages w ithin skill groups from 2002 to 2006,
the m odel in Equation (1.5) com pares the em igration rates an d w ages for each skill
g roup in the tw o years before an d the tw o years after EU accession. The increase in
em igration rates w as caused by an exogenous policy change. Therefore, the changes
in real w ages, over and above the d um m ies an d interaction term s, can be attrib u ted to
em igration.
A potential concern about the exogeneity of EU enlargem ent is that w orkers could
have anticipated the lifting of m igration barriers and accum ulated destination-specific
h u m a n capital. In the lead-up to EU enlargem ent, w orkers in Lithuania could have
ind eed anticipated that they w ere allow ed to em igrate, as the country began its acces
sion negotiations in 1999. Yet the destinations for m igration only becam e clear in 2003,
w hen the old m em ber states decided on tem porary restrictions of their labor m arkets.
G erm any, for exam ple, only decided in sprin g 2004 that it w o u ld keep its labor m arkets
closed for w orkers from the new m em ber states (D eutscher Bundestag, 2004).
W hile in theory the causality run s from m igration to w ages, the direction of causal
ity is less clear empirically. Wages can be a p u sh factor for m igration, as low w ages
create an incentive for w orkers to em igrate. In this case the relation betw een m igration
an d w ages should be negative, as skill g roups w ith low w ages should have high em i
gration rates. In the L ithuanian case, how ever, reverse causality sho uld n ot confound
the results. The em igration w ave w as triggered by the cou ntry 's EU accession, and
w orkers from all skill g roups em igrated despite considerable w age increases. M ore
over, if the estim ate of 5 is positive, reverse causality can at m ost dow nw ard -b ias the
result.
E quation (1.5) only identifies the w age effect if labor dem an d is constant. Shifts
dem an d shifter is capital adjustm ent. Based on the idea of a Solow (1956)-type fram e
w ork, em igration leads to a decrease in the capital stock, w hich offset the w age effect
of em igration in the long run. This paper, by contrast, studies a short-run effect, so
that capital adjustm ents should n o t affect the results. M oreover, it is unlikely that
firm s decrease their capital stock in a perio d of high economic grow th, as Lithuania
experienced in the 2000s.
O ne m ight be concerned th at the L ithuanian econom y u n d erw en t structural changes
aro u n d the tim e of EU enlargem ent In particular, ELJ enlargem ent did no t only change
the m igration laws; Lithuania gained access to a free-trade area and received EU struc
tural funds, w hich m ay cause an increase in labor dem and. If EU enlargem ent changed
the trad e an d investm ent p attern s, w e w o u ld expect a shift in the level of exports and
FDI, or a change in the tren d of bo th variables. The aggregate data does n o t suggest
that EU accession has led to substantial shifts in the trade and investm ent patterns.
As w e can see in Figure 1.2, none of these variables show a structural break after EU
enlargement.^^
The overall tim e tren d in the trad e a n d investm ent patterns — and of other factors
that affect w ages, such as TFP gro w th — is accounted for by the year dum m ies in
E quation (L5). In addition, if a factor shifts labor d em and for high-skilled w orkers
m ore th an for low -skilled w orkers, or for you ng w orkers m ore than for old w orkers,
the interactions {year*educ) and (year*exper) absorb these differential d em and shifts.
The only d em an d shifts I cannot control for w ith interaction term s, are skill group-
specific d em and shifts, because an interaction (j/ea?’ * educ * exper) w o uld com pletely
saturate the model.
Self-selection o f m igrants
As it is only possible to observe the w ages of w orkers w ho decide no t to m igrate, self
selection arises as a potential source of bias.
N egative self-selection of m ig rants leads to an upw ard-bias in the estim ates. If
m ost em igrants are selected from the low er en d of the w age distribution, the average
w age of the rem aining w orkers increases. Yet, this increase is no t caused by a decrease
in labor supply, b u t by a change in the com position of the w orkforce. A nalogously, if
m ost em igrants are selected from the u p p e r end of the w age distribution, the estim ates
will be dow nw ard-biased.
The selection of m igrants can occur along tw o dim ensions: betw een a n d w ithin
skill groups. W hen w e com pare the edu catio n d istribution of stayers in Table 3.3 an d of
3 0 0
-2 0 0
-1 0 0
-Exports to EU FDI inflows from EU Unem ploym ent rate Real GDP pc
2002q1 2003q1 2004q1 2005q1 2006q1 2007q1 ye a r
Figure 1.2: FDI, exports, GDP per capita, and the unemploym ent rate in Lithuania, 2002-2006
Notes: T he g ra p h sh o w s the tim e series for exports to the EU, FDI inflow s from the EU, real G D P p e r capita an d the
u n e m p lo y m en t rate. All variables arc n o rm alized to 100 (first q u a rte r in 2002). N o n e of the v ariables sh o w s a s ta ic tu ra l
b reak a ro u n d EU enlargem ent.
[image:37.536.51.521.57.661.2],4
-
.3-Q
0
2002 - - 2006
-10 -5 0 5
Log wage, standardized
[image:38.536.44.479.70.329.2]k ernel = e p a n ech n ik o v . bancK‘,id th = 0 .1 8 8 8
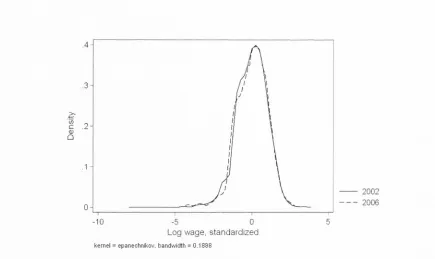
Figure 1.3: S tandardized w age d istribution in Lithuania, 2002 and 2006
N otes: The graph shows a Kernel density plot of the log real w ages in 2002 and 2006. This plot allows for a comparison
slightly, despite the emigration of 9% of the workforce.
To make the distribution comparable across years, wages are standardized to their z-scores, i.e. the wage of an in dividual m inus the mean wage, divided by the standard deviation of wages, = {xi’i — xi’) / a w The mean of the distribution is zero.
Source: Lithuanian Household Budget Survey
m igrants in Table 1.2, w e can see that, betw een skill groups, em igrants w ere negatively
selected. N egative selection, how ever, does n o t bias the results, as the d um m ies and interaction term s in E quation (1.5) account for it.
Selection w ithin skill groups — a selection p attern th at can not be observed from the su m m ary statistics — can be a source of bias. It is difficult to determ ine the direc tion a n d size of this bias, as the d ata has no inform ation on counterfactual w ages, i.e. the w ages em igrants w o u ld earn h ad they stayed in Lithuania. The stand ardized w age distribution in Lithuania before a n d after EU enlargem ent does no t give evidence of selection bias. If m igrants w ere on average negatively selected, w e w ould expect the probability m ass to shift to the right. As w e can see in Figure 1.3, the shape of the w age d istrib ution is alm ost identical in 2002 and 2006.
M oreover, given the difference in the economic situation betw een Lithuania and
Ireland an d the UK, it is unlikely th at m igrants are on average negatively selected.
First, m ig ran ts are, by definition, m ore m obile than stayers. If m obility is positively
correlated w ith ability, m igrants sho uld be on average m ore skilled than stayers, and
earn hig her w ages.
Second, because of the foreign language requirem ents, and because of m inim um
w ages, the skill requirem ents are on average higher in the UK and in Ireland than in
Lithuania. M ost jobs, in p articular in the service sector, require fluency in English and
a good know ledge of British or Irish culture. In addition, the m inim um w ages in the
UK a n d Ireland are considerably higher than in Lithuania, w hich creates an additional
h u rd le for low -skilled m igrants. O nly the m ore productive m igrants get a job th a t pays
them at least the m in im um wage.^® As the UK H om e Office (2009) show s, m ore than
80% of im m igrants from the accession countries w ere officially em ployed, so th at the
m in im u m w age is binding for the m ajority of im m igrants.
Third, since there w as little m igration from Lithuania to Ireland an d the UK prior
to EU accession, m igrants could n ot rely on large m igrant netw orks th at su p p o rt them
in finding a job and facilitate assim ilation. As suggested by the literature on m igrant
netw orks (C arrington et a l , 1996; McKenzie & Rapoport, 2010), sm all netw o rk s are
usually associated w ith a positive selection of m igrants.
Closely related to the issue of self-selection is the question w hether som e of the
w orkers w ere un em ployed before they em igrated. If this w as the case, em igration
could have decreased unem p lo ym en t an d — in the m ost extrem e case — have no ef
fect on w ages. In fact. Figure 1.2 show s that un em ploym ent had been falling betw een
2002 an d 2006. W hile I cannot exclude th at em igration played a role in reducing u n em
ploym ent, the unem p loy m ent rate does not show a structural break after EU accession.
Even the em igration of 9% of the w orkforce d id no t cause a su d d en d rop in the u n em
plo ym ent rate.
If being u n em ployed is associated w ith low er ability, an d if m igrants are on average
positively selected w ithin skill groups, then m ost of the m igrants should be em ployed
at the tim e of em igration. W hile the L ithuanian unem ploym ent data is n o t detailed
eno ug h to calculate unem ploy m ent rates per skill group, it is possible to control for
un em p lo y m en t at the regional level, w hich I do in a robustness check in A ppendix
l.A .l. M oreover, for the unlikely case th at m any em igrants w ere unem p lo yed right
before em igration, the estim ates of the w age effect w ould be d ow nw ard-biased, as the
calculated em igration rate w o uld be higher th an the actual one.
Table 1.3: The w age effect of em igration
D epend ent variable: log real w age
Sample:
(1) all
(2) all
(3) all
(4) all
(5) m en
(6) w om en
E m igration rate 0.665“^“^ 0.391 0.426 0.401 1.245’^*=^ 0.283
[0.2937] [0.3132] [0.3154] [0.3236] [0.2950] [0.3910]
E m igration m ale 0.799=^*=^ 0.793*^* 0 777=^**
[0.2936] [0.2912] [0.2852]
Year dum m ies yes yes yes yes yes yes
Education d um m ies yes yes yes yes yes yes
Experience dum m ies yes yes yes yes yes yes
FDI, unem p., exports no no yes no no no
Year * region no no no yes no no
O bservations 9970 9970 9970 9970 6771 3199
A djusted R " ^ 0.3463 0.3468 0.3568 0.3638 0.3371 0.3222
R o b u st s t a n d a r d e rro rs in b ra c k e ts
p < 0 .0 1 , p < 0 .0 5 , * p < 0 .1
Note: T h is tab le s h o w s th e O LS re s u lts fo r th e e c o n o m e tric m o d e l in E q u a tio n (1.5), a reg ressio n of log real w a g e s o n th e e m ig ra tio n ra te , in te ra c tio n s o f th e e m ig ra tio n ra te w ith a d u m m y fo r m e n (em ig^m ale), a
v e c to r o f p e rs o n a l c h a ra c te ristic s.
S ta n d a r d e rro rs are c lu s te re d a t th e tim e -e d u c a tio n -e x p e rie n c e level. A ll o b s e rv a tio n s are w e ig h te d w ith
s u r v e y w e ig h ts .
FDI sto c k s (in logs), u n e m p lo y m e n t ra te a n d e x p o rts (in logs) a re m e a s u re d a t th e re g io n a l level.
Y ear*region is a n in te ra c tio n o f y e a r a n d re g io n d u m m ie s .
1.5 Em pirical A n a ly sis
1.5.1 Estimation Results
Table 1.3 presents the results of the estim ated im pact of em igration on the real w ages
of stayers. The w age effect for m en a n d w om en, reported in C olum n (1), indicates th at
em igration predicts a significant increase in w ages. A one percentage-point increase in
the em igration rate increases real w ages on average by 0.67%.
W hile this effect m ay be large an d statistically significant on average, the w age ef
fects can differ b etw een m en and w om en. To analyze the difference in the w age effect
betw een m en a n d w om en, I interact the em igration rate w ith a d u m m y for men. As
statisti-cally significant difference in the w age effect of em igration for m en and w om en. For
a one percentage-point increase in the em igration rate, the w ages of m en increased
on average by 1.1%, w hile the m arginal effect for w om en is sm aller an d statistically
insignificant. From colum ns (5) and (6) w e can see that these results also hold if the
sam ple is split betw een m en an d w om en.
In C olum n (3) I control for FDI inflows, exports, an d unem p lo ym en t at the regional
level. Each of these factors can confound the analysis, if they affect w ages over and
above w h at it absorbed by the d u m m y variables. The three variables are m easured at
the regional level, so that the w age of a person can be m atched w ith the FDI, unem
ploym ent, and exports in the region the person is living in. It is reassuring that the
m ost obvious potential confounding factors, FDI, exports, and unem ploym ent, do not
change the results of the m ore p arsim onious specification in C olum n (1).
N ext, I include an interaction of region an d year d um m ies into the basic m odel to
ensure that no other factors affect w ages at the regional level. The region*year inter
actions absorb all econom ic factors that affect a region over time b u t are u nrelated to
em igration. The results of this specification, displayed in C olum n (4), are no t different
from the previous result.
A n obvious problem w ith controls at the regional level is that the d em an d shifters
are the sam e for all skill levels. If, for exam ple, the d em and shift is larger for high-
skilled than for low -skilled w orkers, this change in returns to education cannot be
cap tu red w ith the controls of the basic m odel. To account for changes in returns to ed
ucation, I re-estim ate the basic m odel w ith an interaction of year and education d u m
mies. As w e can see in C olum n (1) of Table 1.4, the estim ated w age effect is the sam e
w h en w e account for changes in retu rns to education.
In a sim ilar fashion, the returns to experience can change over time. Technological
progress, for exam ple, can benefit y o u n g w orkers m ore than old w orkers. To account
for changes in returns to experience, I include an interaction of year an d experience
dum m ies. C olum n (2) of Table 1.4 indicates that changes in retu rns to education ex
plain p a rt of the w age increases. The p o in t estim ates are 0.3 low er com pared to the
benchm ark case.
P art of the initial results can also be driven by differences in the age-earnings profile
across education groups. The basic m odel in E quation (1.5) estim ates a separate inter
cept for every education level, every experience level, an d every year. The difference
in w ages for old and you ng w orkers, how ever, m ay be larger for high-skilled w orkers
than for low -skilled w orkers, or vice versa. An interaction of education and experience
d u m m ies absorbs the difference in the age-earnings profile betw een education groups.
The results in C olum n (3) of Table 1.4 suggest th at the age-earnings profiles differ in
Table 1.4; Estimation of the wage effect with additional controls
Dependent variable: log real wage
A. Men (1) (2) (3) (4) (5) (6) (7)
Emigration rate 1 217*** 0.825** 1497*** 0.292 1.372*** 1.464*** 0.833***
[0.3218] [0.3998] [0.3145] [0.3953] [0.3127] [0.3265] [0.2649]
Observations 6771 6771 6771 6771 6771 6771 6771
Adjusted 0.3374 0.3375 0.3382 0.3382 0.3385 0.3387 0.3392
B. Women
Emigration rate 0.310 -0.039 0.622* -0.012 0.642 0.817* 1.035
[0.4166] [0.4986] [0.3217] [0.4632] [0.3859] [0.4569] [0.6657]
Observations 3199 3199 3199 3199 3199 3199 3199
Adjusted 0.3225 0.3291 0.3302 0.3302 0.3305 0.3364 0.3375
Controls
year*educ yes no no yes yes no yes
year*exper no yes no yes no yes yes
educ*exper no no yes no yes yes yes
R obust standard errors in brackets p<0.01, ” p<0.05, * p<0.1
Note: This table show s the estim ation results of the effect of em igration on w ages w ith a n u m b e r of add itio n al controls. Year*educ accounts for changes in retu rn s to education. Year*exper accounts for changes in returns to experience. Edu