463 Drying is a complex process concerning a
paral-lel heat and mass transfer. Every dried material has specific physical parameters which affect the drying process. It is important to know these parameters for correct selection of dryer type or equipment design. In case of convective drying by hot air these parameters are convective heat transfer coefficient, effective diffusion coefficient, and mass transfer coefficient. The most common method to assess these parameters is experimental work. Evaluation of a mathematical model which describes the drying process is also a possible powerful tool.
For especially thermally sensitive materials such as food, it is necessary to perform the experiments with the aim to obtain drying curves (Jangam et
al. 2010). There are lots of studies which deal with the drying of fruits and vegetables as well as other food (industrial) materials in a convective dryer. The examples of these studies of drying process were presented for onion in Sarsavadia et al. (1999), mulberry in Doymaz (2004), kiwi in Kaya et al. (2008), pomegranate in Yilmaz et al. (2015), or also natural non-food materials such as clay in Silva et al. (2013). Besides the experimental work to assess drying curves, the author applied simple mathemati-cal models to describe a drying process as published by Akosman (2004), or applied more complicated models based on the numerical solution of physical models, see Akosman (2004), Demir et al. (2007), Kaya et al. (2008), and Silva et al. (2013). The aim of
Analysis of Cube Sugar Drying in a Convective Dryer
Jan SkočilaS, Stanislav Solnař and Magzhan aidoSSuly
department of Process Engineering, Faculty of Mechanical Engineering, Czech Technical university in Prague, Prague, Czech Republic
Abstract
Skočilas J., Solnař S., Aidossuly M. (2016): Analysis of cube sugar drying in a convective dryer. Czech J. Food Sci., 34: 463–468.
The article deals with determination of drying curves for the convective drying of cube sugar. The results of the experi-ment are compared with simple CFD model and literature data. Drying process is described by simple and complex mathematical models. The effective diffusion coefficient and mass transfer coefficient were identified from data. The repeated measurements were performed in a convective dryer for the initial 3% moisture content of sugar and for three temperatures (50, 65, and 80°C) and two velocities (1 and 1.5 m/s) of drying air. For one cube the CFD 2D model was created in the ANSYS software and the velocity and temperature fields were simulated.
Keywords: water evaporation; sugar product; convection; diffusion; CFD
Nomenclature
a – coefficient of drying models (–); b – coefficient of drying models (–); dAB – effective diffusion coefficient (m2/s); k – coefficient of drying models (–); l – total diffusion length (m); M – relative humidity (–); t – time (s); x – general coordinate in the direction of the mass flow (m); greek symbols: β – mass transfer coefficient (m/s); µn – positive root of Eq. (4) (–); θ – relative time (–); ω – relative distance (–); dimensionless numbers: Bi – Biot number (–); Nu – Nusselt number (-); Re– Reynolds number (–); Pr – Prandtl number (–); Sh – Sherwood number (–); Sc – Schmidt number (–); abbreviations: CFD – computational fluid dynamics; R2 – coefficient of determination; SSE – sum of squared errors; RMSE – root-mean-square deviation; SST – shear stress transport
the models is to determine the diffusion parameter, e.g. according to Akosman (2004) and Silva et al. (2013), e.g. mass transfer coefficients or effective diffusion coefficient. The sensory and nutritional properties especially of food materials are also observed during or after a drying process (Yilmaz et al. 2015; Zhao et al. 2015). The industrial sugar production has had a long history in the Czech Republic. The first sugar was made at the town of Dacice in 1843. The produc-tion and technology of sugar cubes are described e.g. in Bubnik et al. (1995) or Asadi (2011).
At the end of the cube sugar production there is a final drying phase before expedition. The residual moisture content (approximately 3% mass fraction of water) is removed to avoid the cube conglutina-tion after expediconglutina-tion and temperature variaconglutina-tion. This study is aimed to experimentally determine the drying curve of cube sugar in a convective dryer, to describe the process by a simple mathematical model and by a complex physical model. The second model will be used to identify the effective diffusion coefficient and mass transfer coefficient. A simple CFD model was also developed for description of velocity and temperature field in a drying chamber. The CFD model served for determination of the convective heat transfer coefficient. The results of the analysis were compared with experimental data from Akosman (2004).
MAteriAl AND MethoDS
Repeated measurements of the drying process of cube sugar were performed. The initial moisture content of sugar was 3%. Three temperatures of hot air with combination of two velocities of hot air were set during the measurements. Coefficients of simple models describing drying kinetics were evaluated from measured drying curves by regression. The proposed model of the drying process based on simple description of the heat and mass transfer was applied to determine the effective diffusion coefficient by experimental data optimisation. For one cube the 2D model was created in the ANSYS Fluent software and velocity and temperature field were simulated. The mass transfer coefficient was obtained according to analogy between heat and mass transfer using the convective heat transfer coefficient observed from simulation.
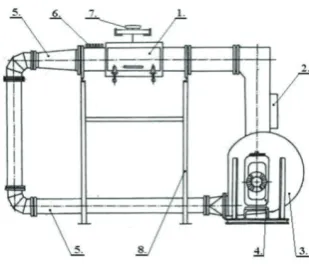
Experimental part. The experiments were per-formed in a convective dryer (Figure 1). Twenty-four
investigated cubes of sugar (3 rows and 8 columns) were inserted into a drying chamber, the orientation of the cubes is shown in Figure 2. The dimensions of the cube were 15 × 15 × 25 mm. Sugar was dried to remove the residual moisture for 24 h at 105°C. Then the moisture was injected into cubes to achieve the relative moisture mass content of 3%. The sugar was stored in a desiccator to distribute the moisture within the whole volume of the cube. The dryer was preheated to the specified temperature and sugar was dried at air temperatures of 50, 65, and 80°C. The velocity of the air in the drying chamber was 1 and 1.5 m/s. Each measurement was repeated three times. The sugar is produced in Czech Republic. The cubes were inserted into the drying chamber placed on the basket frame, which was hung up on the Shinko Denshi AJH-620CE digital scale (Tokyo, Japan).
[image:2.595.339.494.107.239.2]Mathematical models. Drying curves, i.e. the time dependence of the relative (dimensionless) mois-ture content, were compared with the Henderson and Pabis standard model, two-term exponential and asymptotic logarithmic models. Parameters of these models, coefficient of determination R2, SSE,
Figure 1. Scheme of a convection dryer
1 – drying chamber; 2 – first heater; 3 – ventilator; 4 – en-gine with inverter; 5 – pipeline; 6 – second heater; 7 – scales; 8 – frame
[image:2.595.301.532.632.738.2]465 and RSME, were obtained by regression analysis.
Three repeated experiments were carried out for each configuration.
The effective diffusion coefficient and mass transfer coefficient were identified from experimental data by the proposed model of drying process according to Akosman (2004). The model was optimised in the Matlab software (Natick, USA). Relative moisture distribution for the constant diffusion coefficient of water in sugar is described by Fick’s law. The final analytic solution of differential equation can be found by the Fourier method of separation of variables. The model assumes a diffusion coefficient independent of the temperature:
where: M – relative humidity; θ – relative time; ω – relative
distance; µn – positive root of Eq. (4)
θ = dAB , ω = x (2, 3)
l2 l
where: dAB – effective diffusion coefficient (m2/s); x – general
coordinate in the direction of the mass flow (m); l – total
diffusion length (m); t – time (s)
µnsin µn = Bi cos µn
where: Bi – Biot number for mass transfer defined
Bi = βl (5)
dAB
where: β – mass transfer coefficient (m/s)
The mass transfer coefficient was determined from the equation for heat transfer coefficient assum-ing the Chilton-Colburn analogy between heat and mass transfer. The result was also compared with the simulation of the proposed CFD model. The value of the Sherwood number was obtained directly by correlation while the mean value of convective heat transfer coefficient was obtained from CFD and substituted into the Nusselt number. Using the Chilton-Colburn analogy, the Sherwood number was evaluated again and the mass transfer coefficient as well. The correlation for the Nusselt number – Nu (Perry & Green 1997):
Nu = 0.648Re0.5Pr1/3 (6)
where: Re – Reynolds number; Pr – Prandtl number
Correlation for the Sherwood number (Perry & Green 1997):
Sh = 0.332Re0.5Sc1/3 (7)
where: Sc – Schmidt number
Chilton-Colburn analogy (Perry & Green 1997):
Sh = Nu
(
Sc)
1/3 (8)Pr
CFD model. A simple CFD 2D model of one cube in the channel was created. The cube was overflowed and heated by the air of specified temperature. The mesh was structured and it was built of only rectan-gular elements. The number of elements was 21 200. In the vicinity of the cube the mesh was condensed. The model consisted of by inlet velocity, outlet pres-sure, and wall boundary conditions. The CFD model was applied only for one measurement arrangement: velocity of air 1 m/s, sugar temperature 20°C, inlet temperature of air 80°C. Only one model of turbu-lence with two parameters was chosen, k – ω SST.
reSultS AND DiSCuSSioN
The experiments confirmed that the shortest drying time (35 min) is applicable for the highest velocity of drying air and highest temperature, i.e. 1.5 m/s and 80°C. Even at the highest temperatures there was no change of the cube sugar colour. The surface of the cubes was hard but fragile. The final drying curves for all variations of the operational conditions are presented in one graph for better comparison (Fig-ure 3). The curves represent the averaged data from three repeated measurements.
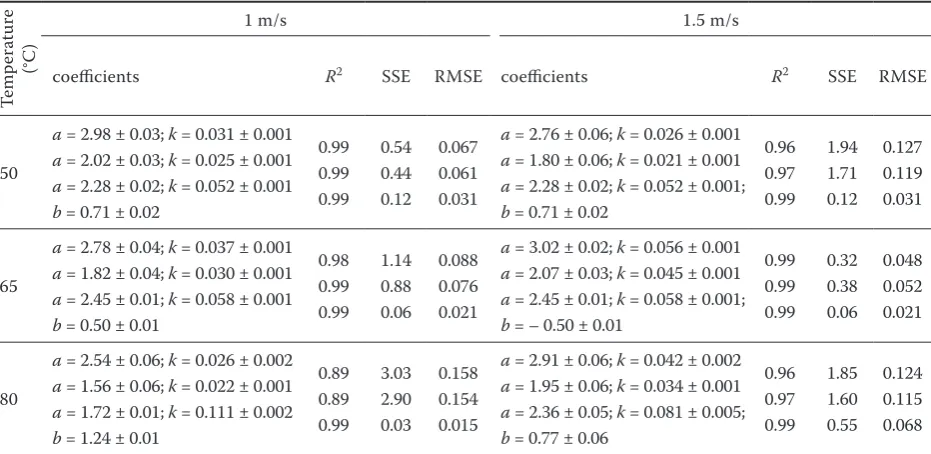
Coefficients of mathematical models describing the drying process and its coefficient of determination R2 and SSE are presented in Table 1 for the air
veloc-ity of 1 m/s and 1.5 m/s. The best agreement with experimental data was achieved by the asymptotic logarithmic model.
The effective diffusion coefficient of water from cube sugar in relation to drying air was determined by optimisation of the calculation procedure in the Matlab software representing the physical model of drying process respecting Eq. (1). These values were compared with literature data for cube sugar but for different operational conditions. From Table 2 it seems that there is no relationship between the value
ܯ ൌ ʹ ൬ߤ ߤ
ߤ ߤ൰ ஶ
ୀଵ
of effective diffusion coefficient and the velocity or temperature of drying air, which is in contrast with previous observations made by Akosman (2004).
[image:4.595.66.381.94.273.2]The diffusion coefficient depends on the tempera-ture, which can be expressed e.g. by the Arrhenius equation (exponential function). This dependence
Figure 4. Velocity field in the channel (m/s)
Figure 5. Temperature profiles in the channel (K)
0.0 0.5 1.0 1.5 2.0 2.5 3.0 3.5
0 5 10 15 20 25 30 35 40 45 50 55 60 65 70
Re
la
tive
h
umidity
(%)
Time (min)
moisture at T = 50°C, v = 1 m/s moisture at T = 50°C, v = 1.5 m/s moisture at T = 65°C, v = 1 m/s moisture at T = 65°C, v = 1.5 m/s moisture at T = 80°C, v = 1 m/s moisture at T = 80°C, v = 1.5 m/s
[image:4.595.64.539.323.780.2]467 can be included in Eq. (1) but the problem becomes
strongly nonlinear. It can be assumed that the value of the diffusion coefficient can be substituted by a constant value in the applied range of temperatures for both air velocities for the purpose of dryer design. The difference between the values of DAB obtained by our experiments and those reported by Akosman (2004) can be explained by a difference in sugar
quality or production technology (porosity, scale of crystals, etc.).
[image:5.595.64.530.137.364.2]In Figures 4 and 5 the results of CFD simulations are presented for the velocity field of the air flowing over sugar cube and temperature profile for 1 m/s and 80°C, respectively. The mean value of the convective heat transfer coefficient on the surface of the sugar cube obtained by CFD model was 20.6 W/m2/K.
Table 1. Coefficient of regression Henderson and Pabis (a, k), Two term exponential (a, k), and Asymptotic (a, b, k) logarithmic for the air velocity of 1 m/s and 1.5 m/s
Tem
pera
tur
e
(°C
) 1 m/s 1.5 m/s
coefficients R2 SSE RMSE coefficients R2 SSE RMSE
50
a = 2.98 ± 0.03; k = 0.031 ± 0.001 a = 2.02 ± 0.03; k = 0.025 ± 0.001 a = 2.28 ± 0.02; k = 0.052 ± 0.001 b = 0.71 ± 0.02
0.99 0.99 0.99 0.54 0.44 0.12 0.067 0.061 0.031
a = 2.76 ± 0.06; k = 0.026 ± 0.001 a = 1.80 ± 0.06; k = 0.021 ± 0.001 a = 2.28 ± 0.02; k = 0.052 ± 0.001; b = 0.71 ± 0.02
0.96 0.97 0.99 1.94 1.71 0.12 0.127 0.119 0.031 65
a = 2.78 ± 0.04; k = 0.037 ± 0.001 a = 1.82 ± 0.04; k = 0.030 ± 0.001 a = 2.45 ± 0.01; k = 0.058 ± 0.001 b = 0.50 ± 0.01
0.98 0.99 0.99 1.14 0.88 0.06 0.088 0.076 0.021
a = 3.02 ± 0.02; k = 0.056 ± 0.001 a = 2.07 ± 0.03; k = 0.045 ± 0.001 a = 2.45 ± 0.01; k = 0.058 ± 0.001; b = – 0.50 ± 0.01
0.99 0.99 0.99 0.32 0.38 0.06 0.048 0.052 0.021 80
a = 2.54 ± 0.06; k = 0.026 ± 0.002 a = 1.56 ± 0.06; k = 0.022 ± 0.001 a = 1.72 ± 0.01; k = 0.111 ± 0.002 b = 1.24 ± 0.01
0.89 0.89 0.99 3.03 2.90 0.03 0.158 0.154 0.015
a = 2.91 ± 0.06; k = 0.042 ± 0.002 a = 1.95 ± 0.06; k = 0.034 ± 0.001 a = 2.36 ± 0.05; k = 0.081 ± 0.005; b = 0.77 ± 0.06
0.96 0.97 0.99 1.85 1.60 0.55 0.124 0.115 0.068
[image:5.595.63.535.546.693.2]Evaluated from the average of three repeated measurements for each configuration; coefficients are predicted with 95% con-fidence bounds
Table 2. Values of the effective diffusion coefficient
Temperature (°C) Air velocity (m/s) DAB × 10–9 (m2/s) Source
45 0.56 4.23 Akosman (2004)
50 1.51 1.74 ± 0.061.33 ± 0.08 experimentexperiment
60 0.56 4.94 Akosman (2004)
65 1 1.91 ± 0.08 experiment
1.5 3.15 ± 0.07 experiment
80
0.7 5.73 Akosman (2004)
1 1.25 ± 0.11 experiment
1.5 2.30 ± 0.13 experiment
Table 4. Comparison of the mass transfer coefficient determined by different methods for operational conditions of 1 m/s and 80°C
Experiment Eq. (1) CFD model and Eq. (8) Correlation Eq. (7)
[image:5.595.63.529.737.766.2]The mass transfer coefficient was determined by evaluation of model (1) and/or by Eq. (5) from ex-perimental data for one set of air conditions, velocity 1 m/s, and temperature 80°C. For the same param-eters the coefficient was evaluated by correlation Eq. (7) and also from the CFD simulation respecting an assumption of the similarity between heat and mass transfer (8). The comparison of these values is presented in Table 3.
CoNCluSioN
From experimental work, drying curves were ob-tained for the convective drying of cube sugar with the initial moisture content of 3% for various operational conditions of drying air velocity and temperature. The shortest drying time was obtained for the veloc-ity of 1.5 m/s and temperature of 80°C up to 35 min without any significant changes of sugar quality. Three mathematic models were used to describe the drying curves. The two-term exponential model had the best agreement with experimental data. The effective diffusion coefficient of the physical model has been obtained from drying curves and the value has been compared with literature data. Values of the effective diffusion coefficient are in good agree-ment with literature data. No relationship of the diffusion coefficient to the temperature of drying air for investigated sugar cubes was found in the applied range of temperatures. The constant value of diffusion coefficient can be used for the design of convective dryer. The mass transfer coefficient was evaluated from experiments, correlations, and CFD model. The values of mass transfer coefficient are comparable and have the same order. The CFD model has a capability to describe the investigated process from the aspect of integral characteristics.
references
Akosman C. (2004): Determination of drying characteris-tics and effective diffusivity for sugar cubes. Chemical Engineering & Technology, 27: 1222–1226.
Asadi M. (2011): Beet-sugar Handbook. New Jersey, John Wiley & Sons, Inc.
Bubnik Z., Kadlec P., Urban D., Bruhns M. (1995): Sugar technologists manual: chemical and physical data for sugar manufacturers and users. Zuckerindustrie, 120: 574–575.
Demir V., Gunhan T., Yagcioglu A.K. (2007): Mathemati-cal modeling of convection drying of green table olives. Biosystem Engineering, 98: 47–53.
Doymaz I. (2004): Drying kinetics of white mulberry. Jour-nal of Food Engineering, 61: 341–346.
Jangam S.V., Law C.L., Mujumdar A.S. (eds) (2010): Drying of Foods, Vegetables and Fruits. Vol. 1. e-book. Singapore, Universidad Nacional de Singapur. Available at http:// www.arunmujumdar.com/file/Publications/books/Dry-ing%20of%20Foods%20Vegetables%20and%20Fruits%20 Volume%201.pdf
Kaya A., Aydin O., Dincer I. (2008): Experimental and nu-merical investigation of heat and mass transfer during drying of hayward kiwi fruits (actinidia deliciosa Planch). Journal of Food Engineering, 88: 323–330.
Perry R.H., Green D.W. (1997): Perry’s Chemical Engineers’ Handbook. 7th Ed. New York, McGraw-Hill.
Sarsavadia P.N., Sawhney R.L., Pangavhane D.R., Singh S.P. (1999): Drying behavior of brined onion slices. Journal of Food Engineering, 40: 219–226.
Silva W.P., Silva C.M.D.P.S., da Silva L.D., Farias V.S.O. (2013): Drying of clay slabs during the falling rate pe-riod: optimization and simulation of the process using diffusion models. Journal of Materials Science Research, 2: 1–13.
Yilmaz F.M., Yuksekkaya S., Vardin H., Karaaslan M. (2015): The effects of drying conditions on moisture transfer and quality of pomegranate fruit leather. Journal of the Saudi Society of Agricultural Sciences. Available online: doi: 10.1016/j.jssas.2015.01.003
Zhao Q., Dong B., Chen J., Zhao B., Wang X., Wang L., Zha S., Wang Y., Zhang J., Wang Y. (2015): Effect of drying methods on physicochemical properties and antioxidant activities of wolfberry (lycium barbarum) polysaccha-ride. Carbohydrate Polymers, 127: 176–181.
Received: 2015–12–31 Accepted after corrections: 2016–10–21
Corresponding author: