Abstract— The experimental design and response surface methodology (RSM) were applied for paddy husker by medium brown rice peeling machine. The three variables involved in this study were rubber of clearance, spindle of speed and rice of moisture. The optimized composition derived from RSM regression was analyzed using Regression analysis and Analysis of Variance (ANOVA). At a significant level = 0.05, the values of Regression coefficient, R2 adjust were 96.55 % and standard deviation were 1.05056. The independent variables are initial rubber of clearance, spindle of speed and rice of moisture parameters namely. The investigating responses are final rubber clearance, spindle of speed and moisture of rice respectively. The restriction of the optimization is the designated.
Keywords-Brown rice, response surface methodology(RSM), peeling machine, optimization, paddy husker.
I. INTRODUCTION
HEquality of peeled rice are depends on many factors such as rice strain, the rate of feeding, clearance between a rubber to rubber cylinder and paddy moisture content which usually are controlled not to be exceed 14%. But the most important factor is the type of the abrasives [1]-[2]. Nutritional Implications of Rice Milling: In rice milling, the bran layers and germ removed during polishing are high in fiber, vitamins and minerals as well as protein. Their removal results in loss of nutrients, especially in substantial losses of B vitamins. Polishing rice reduces the thiamin content of rice by over 80%. Parboiling results in gelatinization of the starch and disintegration of the protein in the endosperm resulting in inward shift of water-soluble vitamins to the endosperm. Parboiled rice is therefore higher in B vitamins than raw milled rice [3] and see Table 1.
Surapong Bangphan Asst. Prof. Ph.D. Department of Industrial Engineering, Faculty of Engineering, Rajamangala University of Technology Lanna, Chiang Mai Campus. 128 Huay kaew Road, Muang District, Chiang Mai, Thailand, 50300;(corresponding author to provide phone:(+66)0-5392-1444; fax:(+66)0-5321-3183 ;e-mail : [email protected]).
Phiraphan Bangphan ASST. PROF. Department of Industrial Engineering, Faculty of Engineering, Rajamangala University of Technology Lanna, Chiang Mai Campus. 128 Huay kaew Road, Muang District, Chiang Mai, Thailand, 50300 ;(e-mail: [email protected]).
Chakrit Ketsombun is student in the Department of Industrial Engineering, Faculty of Engineering, Rajamangala University of Technology Lanna, Chiang Mai Campus. 128 Huay kaew Road, Muang District, Chiang Mai, Thailand, 50300.
Tanakarn Sammana is student in the Department of Industrial Engineering, Faculty of Engineering, Rajamangala University of Technology Lanna, Chiang Mai Campus. 128 Huay kaew Road, Muang District, Chiang Mai, Thailand, 50300.
Also it has been reported that brown rice contains high phytic acid (antioxidant, anti-cancer); it decreases serum
cholesterol (prevents cardio-vascular diseases); and it is considered a low glycemic index food (low starch, high complex carbohydrates which decreases risk to type 2 diabetes).
The enhancement of rice supply is another advantage of brown rice relative to polished or white rice. Post harvest researchers say that the milling recovery in brown rice is 10% higher than polished rice [4]. There is the other benefit of brown rice – economics the fuel savings in milling is 50-60% because the polishing and whitening steps are eliminated. It follows that the milling time is also shortened; labor is less; and the cost of equipment (if the mill is dedicated to brown rice) is much lower because the miller doesn’t have to install polishers and whiteners. The enhancement in output volume and the economy in milling constitute the business opportunity in brown rice. [5].
[image:1.595.331.549.534.637.2]
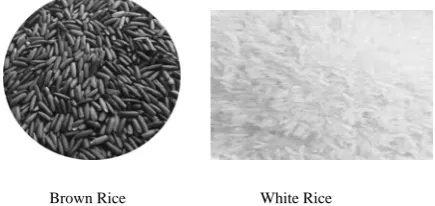
Brown Rice White Rice Fig. 1. Brown Rice versus White Rice
A. Literature Review
Milling is the primary difference between brown and white rice. The varieties may be identical, but it is in the milling process where brown rice becomes white rice. Milling, often called "whitening", removes the outer bran layer of the rice grain. Milling affects the nutritional quality of the rice. Milling strips off the bran layer, leaving a core comprised of mostly carbohydrates. In this bran layer resides nutrients of vital importance in the diet, making white rice a poor competitor in the nutrition game The
The Optimization of Paddy Husker by Response
Surface Methodology
S. Bangphan, P. Bangphan , C. Ketsombun and T. Sammana, Member, IAENG
T
TABLEI
NUTRIENT CONTENT OF RICE [3],[6]
following chart shows the nutritional differences between brown and white rices. Fiber is dramatically lower in white rice, as are the oils, most of the B vitamins and important minerals. Unknown to many, the bran layer contains very important nutrient such as thiamine, an important component in mother’s milk [7]. Brown rice (hulled rice) is composed of surface bran (6–7% by weight), endosperm (E90%) and embryo (2–3%) [8] White rice is referred to as milled, polished or whitened rice when 8–10% of mass (mainly bran) has been removed from brown rice [8]. During milling, brown rice is subjected to abrasive or friction pressure to remove bran layers resulting in high, medium or low degrees of milling depending on the amount of bran removed [8],[10]. Milling brings about considerable loss of nutrients and affects the edible properties of milled rice[8],[10]. As most cereals, rice does not show a homogeneous structure from its outer (surface) to inner (central) [11]. As a consequence, information on the distribution of nutrients will greatly help in understanding the effect of milling and aid in improving sensory properties of rice while retaining its essential nutrients as much as possible[12].Therefore, the aim of this study is to generate between clearance of rubber and spindle of speed with moisture of rice using Design of Experiment(DOE) by Response Surface Methodology(RSM) in order to generate the suitable factors.
This study is going to follow the framework set with some modifications to brown rice peels, so that we can investigate the possibility of using Response Surface Methodology to improve our complete of good percent rice results by only varying the period of time.
II. EXPERIMENTAL PROCEDURE
A. Material and Method
The most outer rough shell of paddy is removed. Rubber roll sheller (Fig. 2) is the most common machine that is used for paddy shelling, however friction type browner is sometimes used as a sheller. Paddy goes between six rubber rollers that are rotating in opposite direction with different velocities. There is a small clearance between the rollers so that when paddy passes through, it is subjected to some shear forces and husk is removed from production process of rice peeled [2-3],[6].
B. Method
Design of experiments (DOE) and Response Surface Methodology (RSM) is a collection of statistical and mathematical techniques useful for developing, improving and optimizing process and new products, as well as in the improvement of existing product designs. RSM can take unknown response function and approximate it by coded variables where these coded variables are usually defined to be dimensionless with zero mean and the same spread or standard deviation. Usually a low order polynomial in some relatively small region of the independent variable space is generated. The approach presented in this paper is a statistically based method which combines design of experiments (DOE) and response surface methodology (RSM) [13]. RSM is generally conducted in three phases, as emphasized according to research conducted Myers and Montgomery[14].The fundamentals of RSM are set out in the semina papers of [14]-[18]. Further developments are drawn together in three key review articles, namely those of
[19]-[21].The example presented above demonstrates that designs taken from the RSM paradigm can be used to good effect in a traditional agricultural setting and this point is further underscored by the work of [18],[22]. And according to Hill and Hunter, RSM method was introduced by G.E.P. Box and K.B. Wilson in 1951.Box and Wilson suggested to use a first-degree polynomial model to approximate the response variable. They acknowledged that this model is only an approximation, not accurate, but such a model is easy to estimate and apply, even when little is known about the process [23]. The resulting surfaces, usually linear or quadratic, are fitted to these points. Often statistical methods such as design of experiments are used to determine where in the design space these points should be located in order to obtain best possible fit. In this paper we use linear polynomials to create the response surface. The creation of such response surface models to approximate detailed computer analysis codes is particularly appropriate in the preliminary design stages when comprehensive trade-offs of multiple performance and economic objectives is critical. In many cases, either a second-order model is used. For the case of three independent variables, the second-order model is:
j i n
i n
j ij n
i ii i n
i i
k
x
x
x
x
y
11 1
1 2 1 1 1
0
(1)Where are the coefficients which have calculated using an appropriate method such as the least square method. When the result estimated surface is an adequate approximation of the true response function, the results will be approximately equivalent to analysis of the actual system. The model parameters can be approximated whenever proper experimental designs are used to collect the data. The DOE simulation was accomplished with three parameters : between rubber of clearance, spindle of speed and rice of moisture respectively. It was performed according (see Table II and III), and Diagram of paddy husker production process in Fig. 2. A model fitting was accomplished for the first 23-CCD in Table III.
TABLEII DOE PARAMETERS
Parameter Variable Lower Limit Upper Limit Rubber of Clearance, RC X1(mm.) 1.0 1.40
Spindle of Speed, SS X2(RPM) 1,440 1,480
Fig.2. Diagram of paddy husker production process III. I
MPLEMENTATION AND RESULTS
A. DOE and Surface Response Methodology The DOE simulation was accomplished with three parameters: between rubber of clearance(RC), spindle of speed(SS) and rice of moisture(RM) respectively. It was performed according (see Table II and III), and brown rice peeling machine in Fig 2. A model fitting was accomplished for the first 32-CCD in Table III. The independent (RC, SS with RM) and the dependent variables were fitted to the second-order model equation and examined in terms of the goodness of fit. The analysis of variance (ANOVA) was used to evaluate the adequacy of the fitted model. The R-square value (determination coefficient) provided a measure of how much of the variability in the observed response values could be explained by the experiment factors and their interactions.
DOE order defines the sequence that variables should be introduced in response surface analysis. See Table III shows the results according to simulated analysis performed in MINITAB Release 15.00 used for simultaneous optimization of the multiple responses. The desired goals for each variable and response were chosen. All the independent variables were kept within range while the responses were either maximized. The significant terms in different models were found by analysis of variance (ANOVA) for each response. Significance was judged by determining the probability level that the F-statistic calculated from the data is less than 5%. The model
Preparation of Paddy
-Cleaning -Shelling -Moisture -Thai jasmine rice Hopper
Brown Rice and Husker
Blower
Husker
Brown Rice Motor
3HP
Paddy Husker
Of Rubber
Inverter Control
TABLEIII(CONTINUOUS)
CENTRAL COMPOSITE DESIGN FOR OPTIMIZATION
A B C D E F G H 57 38 0 1 1.30 1,460 12.0 75 36 39 0 1 1.30 1,460 12.0 76 9 40 -1 1 1.13 1,460 12.0 90 42 41 1 1 1.40 1,440 10.0 71 45 42 1 1 1.20 1,440 14.0 86 27 43 1 1 1.20 1,480 14.0 85 33 44 -1 1 1.30 1,460 8.64 76 47 45 1 1 1.20 1,480 14.0 84 10 46 -1 1 1.47 1,460 12.0 70 38 47 0 1 1.30 1,460 12.0 76 23 48 1 1 1.20 1,480 10.0 86 50 49 -1 1 1.47 1,460 12.0 69 4 50 1 1 1.40 1,480 10.0 77 7 51 1 1 1.20 1,480 14.0 82 53 52 -1 1 1.30 1,460 8.64 76 46 53 1 1 1.40 1,440 14.0 73 37 54 0 1 1.30 1,460 12.0 75 6 55 1 1 1.40 1,440 14.0 73 40 56 0 1 1.30 1,460 12.0 76 43 57 1 1 1.20 1,480 10.0 88 15 58 0 1 1.30 1,460 12.0 75 35 59 0 1 1.30 1,460 12.0 74 55 60 0 1 1.30 1,460 12.0 73
Remark:
A= Standard Order B= Run Order C= Point Type D= Blocks
E= RC (Rubber of Clearance) F= SS (Spindle of Speed) G= RM (Rice of Moisture)
H= YIELDS (Percentage of Good Rice)
Control Factors
Rubber of Clearance, (RC)
Spindle of Speed, (SS)
Rice of Moisture, (RM)
TABLEIII
CENTRAL COMPOSITE DESIGN FOR OPTIMIZATION
A B C D E F G H 39 1 0 1 1.30 1,460 12.0 75 19 2 0 1 1.30 1,460 12.0 74 28 3 1 1 1.40 1,480 14.0 70 17 4 0 1 1.30 1,460 12.0 73 22 5 1 1 1.40 1,440 10.0 70 11 6 -1 1 1.30 1,426 12.0 74 56 7 0 1 1.30 1,460 12.0 75 51 8 -1 1 1.30 1,426 12.0 74 54 9 -1 1 1.30 1,460 15.4 75 60 10 0 1 1.30 1,460 12.0 75 44 11 1 1 1.40 1,480 10.0 77 34 12 -1 1 1.30 1,460 15.4 75 20 13 0 1 1.30 1,460 12.0 76 41 14 1 1 1.20 1,440 10.0 80 16 15 0 1 1.30 1,460 12.0 75 52 16 -1 1 1.30 1,494 12.0 76 21 17 1 1 1.20 1,440 10.0 80 13 18 -1 1 1.30 1,460 8.64 76 2 19 1 1 1.40 1,440 10.0 70 14 20 -1 1 1.30 1,460 15. 6 76 30 34 -1 1 1.47 1,460 12.0 72
29 35 -1 1 1.13 1,460 12.0 91
adequacies were checked by R2, adjusted-R2 (adj-R2).The coefficient of determination, R2, is defined as the ratio of the explained variation to the total variation according to its magnitude. It is also the proportion of the variation in the response variable attributed to the model and was suggested that for a good fitting model, R2 should not be more than 75 %. A good model should have a large R2, adj-R2. Response surface plots were generated with MINITAB Release 15.00.
Response surfaces equations were obtained from design of experiments. Using all values (tests 1 to 60) to the system analysis, the following polynomial equations were generated.
The Estimated Regression Coefficients for percentage of good rice using data in uncoded units:
) )( 0552083 . 0 ( ) )( 37500 . 4 ( ) )( 0625000 . 0 ( ) 100729 . 0 ( ) )( 00115460 . 0 ( ) )( 283 . 205 ( ) ( ) 6989 . 83 ( ) )( 58525 . 2 ( ) )( 450 ( 60 . 1761 ˆ 3 2 3 1 2 1 3 3 2 2 1 1 2 2 1 RM SS RM RC SS RC RM RM SS SS RC RC RM SS RC y (2) Equation (2) is generate the graphic shown in Fig. 3 shows optimal solutions considering rubber of clearance , spindle of speed and rice of moisture respectively. Main solutions are positioned at 1,440 and 1,480 RPM distance , there is a range between 1.00 and 1.40 mm of rubber clearance where it is allowable to use other distances and there is a range between 10.00 and 14.00 percent of rice moisture where it is allowable to use other distances (see Table II. DOE parameter). Result of the analysis of variance is given in Table IV. The test statistic F0= 1.49 is less than the critical F.05,5,45 =2.42 value.
There is no significant evidence of lack of fit at a = 0.05. Therefore, this study can conclude that the true response surface is explained by the linear model. To study the effects of three factors, 32 = 20 runs and three replicate are required. Due to space limitations, the treatments, factor values, and the corresponding responses are not shown. Analysis of variance method (ANOVA) is used to find factors with significant effects. EffectsX1,X2,X3,X1X1,X2X2,X3X3 ,X1X2
X2X3,X1,X2,X3and DF are found to be significant ,that is
the most significant effect, has significant interactions with all other factors. Alternatively, these results can be obtained visually from the residual versus fits probability plot of effects method shown in Fig.3 plot the range of the residuals looks essentially constant across the levels of the predictor variable, rubber of clearance , spindle of speed and rice of moisture. The scatter in the residuals at SS between 1,440 and 1,480 RPM with RC at between 1.00,and 1.40 millimeters and rice of moisture between 10.00 to 14.00 percent that the standard deviation of the random errors is the same for the responses observed at each spindle of speed, rubber of clearance and rice of moisture.
Result of Estimated regression coefficients for the response (percentage of good rice) function as surface paddy husker is presented in Table V. This analysis is carried out for a significance level of 5%, i.e., for a confidence level of 95%. The model adequacies was checked by adjusted-R2 (adj-R2) of 96.55%.
The check of the normality assumptions of the data is then conducted, it can be seen in Fig. 4 that all the points on the normal plot come close to forming a straight line. This implies that the data are fairly normal and there is no deviation from the normality. This shows the effectiveness of the developed model. The effect of RM and SS is on the estimated response surface of good rice is depicted in the Fig. 5, the spindle speed remains constant in its maximum level of 1,480 RPM. It can be noted that the good rice increases when the RM increases, the explanation is same, as stated earlier, however with the increase in SS, good rice decreases, this is because when SS increases, there will be an undesirable heat loss which does not contribute to good rice.
TABLEIV
ANALYSIS OF VARIANCE FOR THE EXPERIMENTAL RESULTS OF THE
CENTRAL-COMPOSITE DESIGN
Source DF SS MS F P Regression 9 1,832.75 203.64 184.51 0.000 Linear 3 1,510.50 503.50 456.20 0.000 RC 1 1,475.95 1,475.95 1,337.30 0.000 SS 1 29.51 29.51 26.74 0.000 RM 1 5.04 5.04 4.56 0.038 Square 3 186.46 62.15 56.31 0.000 RC*RC 1 171.67 182.19 165.08 0.000 SS*SS 1 7.77 9.22 8.36 0.006 RM*RM 1 7.02 7.02 6.36 0.015 Interaction 3 135.79 45.26 41.01 0.000
RC*SS 1 0.38 0.38 0.34 0.563 RC*RM 1 18.38 18.38 16.65 0.000 SS*RM 1 117.04 117.04 106.05 0.000 Residual Error 50 55.18 55.18 1.10
Lack-of-Fit 5 7.85 1.57 1.49 0.211 Pure Error 45 47.33 1.05
Total 59 1,887.93 TABLEV
ESTIMATED REGRESSION COEFFICIENTS FOR YIELDS
Term Coef SE Coef T P Constant 74.9744 0.2474 303.078 0.000
RC -6.0021 0.1641 -36.569 0.000 SS 0.8487 0.1641 5.171 0.000 RM -0.3506 0.1641 -2.136 0.038 RC*RC 2.0528 0.1598 12.848 0.000 SS*SS 0.4618 0.1598 2.891 0.006 RM*RM 0.4029 0.1598 2.522 0.015 RC*SS -0.1250 0.2144 -0.583 0.563 RC*RM -0.8750 0.2144 -4.080 0.000 SS*RM -2.2083 0.2144 -10.298 0.000
S = 1.05056 PRESS = 79.4349
The response taken from Table IV revealed that the square coefficients of RC (X1), SS (X2) and RM(X3), have a
remarkable effect on the percentage of good rice yield. Moreover, all the linear and interaction terms of three factor presented in significant effects on the percentage of good rice yield at 5% probability level. Since all coefficients of the above equation (2) are all negative, the response surface is suggested SS have a maximum point in Fig 6. A
significantly brown rice peel was observed as humidity and temperature addition increased (P < 0.05, Fig. 6). This can be partly attributed to the higher SS, higher RM and medium of rubber clearance of these brown rices. Using low percentage of good rice yielded bigger specific volumes, rubber clearance, and subsequently higher SS values. In Fig.6 presents a graphical representation of one of the response surfaces generated through RSM using a full quadratic model of RC (X1), SS (X2) and RM(X3) to predict the
percentage of good rice. As depicted, the normalized search direction to maximize the brown rice is (-1, +1).
IV. CONCLUSION
The results of this study have clearly indicated RSM is an effective method for optimization of good rice. Response surface methodology was successfully applied to optimize rubber clearance, spindle of speed and rice of moisture in brown rice that was not paddy. When productions into the formulation, the optimized levels of R-Squire(adjust) was
96.55 % and standard deviation was 1.05056 yielded good quality peeling. This study clearly showed that RSM was one of the suitable methods to optimize the best operating conditions to maximize the peel removing. Graphical response surface and contour plot were used to locate the optimum point. The statistical fitted models and the contour plot of responses, can be used to predict values of responses at any point inside the experimental space and can be successfully used to optimize the brown rice peeling machine. Also, the size and amount of this surface degradation was noticeably increased as a function of exposure time. The surface methodology was used. The optimal composition of the brown rice established by a central composite design (run order 60) was: rubber clearance 1.13 mm., spindle of speed 1,426 rpm and rice of moisture 15.36 percent. The optimal values for the brown rice peeling parameters were good rice of 99.67 %.
ACKNOWLEDGMENT
Financial support “RMUTL hands – on research project” : Rajamangala University of Technology Lanna, Chiang Mai is gratefully acknowledged.
90 85
80 75
70 2
1
0
-1
-2
Fitted Value
Re
si
d
u
a
l
Versus Fits
(response is YIELDS)
Fig.3. Residual of RC,SS and RM
3 2 1 0 -1 -2 -3
99.9
99
95 90 80 70 60 50 40 30 20 10 5
1
0.1
Residual
Pe
rc
e
n
t
Normal Probability Plot
(response is YIELDS)
Fig.4. Normal probability plot of yields
RPM
MS
1490 1480 1470 1460 1450 1440 1430 15
14
13
12
11
10
9
RC 1.3 Hold Values
> – – – – – – < 72 72 74 74 76 76 78 78 80 80 82 82 84 84 YIELDS
Contour Plot of YIELDS vs MS, RPM
Fig.5. Normal probability plot of yields
70 80
1.1 1.2 1.3 1.4 1
90
10 4
14 12 10
16 4 Y IELDS
M S
RC
RPM 1480 Hold Values
Surface Plot of YIELDS vs MS, RC
REFERENCES
[1] S. Bangphan, S. Lee, “Modeling Material Mixtures to Replace of Rice Polishing Cylinder,” Proceeding of the Conference of Industrial Engineering, IE NETWORK CONFERENCE, 17-19 December 2006. [2] S. Bangphan, S. Lee and S. Jomjunyong, “Development of the
Alternative Composite Material for Rice Polishing Cylinder,” APIEMS & CIIE 2007.,Dec.2007, Proceeding 8th Conference. Industrial Engineeris Taiwan, 2007, p.146.
[3] Oh, C.H. and S.H. Oh, “Effects of germinated brown rice extracts with enhanced levels of GABA on cancer cell proliferation and apoptosis”. Journal of Medical Food, 7(1).2004.
[4] Garrow, J.S. et al., “Human Nutrition and Dietetics”, Harcourt Publishers, London,2000.
[5] Rogelio V. Cuyno, “The National Campaign to Combat Hidden Hunger through Brown Rice Paper presented during Consultative Meeting on Nutritional Aspect of Brown Rice”, at Food & Nutrition Research Institute, Manila Philippines,2003.
[6] S. Bangphan, P. Bangphan., and T.Boonkang, Implementation of Response Surface Methodology Using in Small Brown Rice Peeling Machine : part I,” World Academy of Science, Engineering and Technology; ICIKM 2013 : International Conference on Information and Knowledge ManagementBarcelona, Spain, February 27-28, 2013. [7] Wood, Rebecca., “The Whole Foods Encyclopedia”. New York, NY:
Prentice-Hall Press; 1988.
[8] Chen, H., Siebenmorgen, T.J., “Effect of rice thickness in degree of milling and associated optical measurements”. Cereal Chemistry 74, 821–825,1997.
[9] Chen, H., Siebenmorgen, T.J., Griffin, K., “Quality characteristics of long-grain rice milled in two commercial systems”. Cereal Chemistry 75, 560–565,1998.
[10] Kennedy, G., Burlingame, B., Nguyen, N., “Nutrient impact assessment of rice in major rice-consuming countries”. International Rice Commission Newsletter 51, 33–41,2002.
[11] Itani, T., Tamaki, M., Arai, E., Horino, T., “Distribution of amylose, nitrogen, and minerals in rice kernels with various characters”. Journal of Agricultural and Food Chemistry 50, 5326–5332,2002. [12] Jianfen Liang et al., “Milling characteristics and distribution of phytic
acid and zinc in long-,medium- and short-grain rice” Journal of Cereal Science 48 (2008) 83–91.
[13] Myers R. H., Montgomery D. C., Response Surface Methodology: Process and Product Optimization using Designed Experiments. John Wiley and Sons, New York, 1995.
[14] Myers R.H., Montgomery D.C. (2002), Response Surface Methodology. Wiley, NewYork.
[15] Box G.E.P., Wilson K.B. (1951), “On the experimental attainment of optimum conditions .” Journal of the Royal Statistical Society, Series B, 13, 1–45.
[16] Box G.E.P., Draper N.R. (1959), “A basis for the selection of a response surface design.”Journal of the American Statistical Association, 54, 622–654.
[17] Box G.E.P., Draper N.R. (1987), Empirical Model-Building and Response Surfaces. Wiley, New York.
[18] Khuri A.I., Cornell J.A. (1987), Response Surfaces. Marcel Dekker, New York.
[19] Hill W.J., Hunter W.G. (1966), “A review of response surface methodology : a literature review.” Technometrics, 8, 571–590. [20] Myers R.H., Khuri A.I., Carter W.H. (1989), “Response surface
methodology : 1966-1988.” Technometrics, 15, 301–317.
[21] Myers R.H., Montgomery D.C., Vining G.G., Borror C.M., Kowalski S.M. (2004),“Response surface methodology : a retrospective and literature survey.” Journal ofQuality Technology, 36, 53–77
[22] Edmondson R.N. (1991), “Agricultural response surface experiments based on four- level factorial designs.” Biometrics, 47, 1435–1448. [23] Response surface methodology. http://en.wikipedia.org/wiki/