LC-MS/MS method for the detection of multiple classes
of shellfish toxins
Ling Jan Chiou
1, Tai Sheng Yeh
2*, Jiing Chuan Chen
21Department of Health Business Administration, Meiho University, Pingtung, Taiwan, R.O.C.
2Department of Food Science and Nutrition, Meiho University, Pingtung, Taiwan, R.O.C.
*Corresponding author: [email protected]
Citation: Chiou L.J., Yeh T.S., Chen J.C. (2019): LC-MS/MS method for the detection of multiple classes of shellfish toxins. Czech J. Food Sci., 37: 173–179.
Abstract: Marine shellfish toxins are seafood safety problems of global concern. Herein the analysis of six shellfish toxins, regulated by European Union, with one single run by LC-MS/MS with acidic mobile phase was developed. After 80% methanol extraction of the shellfish toxins, the crude extract was subjected to HLB SPE cleanup before LC-MS/MS analysis. The method was validated according to Commission Decision 2002/657/EC. For azaspiracid-1 (AZA1), domoic acid (DA), dinophysistoxin-1 (DTX1), okadaic acid (OA), pectenotoxin-2 (PTX2), and yessotoxin (YTX) toxins the recovery rate was 99.4, 92.7, 114.1, 90.2, 115.2 and 87.8%, respectively. The intra-day relative stan-dard deviation (RSD) was less than 5% for all of the shellfish toxins except DA. The inter-day RSD was less than 5% for AZA1, DTX1, PTX2, YTX, 7.85% for DA, and 14.63% for OA. The decision limit (CCα) and detection capability (CCβ) for AZA1 were 13.6 and 14.8 ppb; for DA they were 1883 and 2051 ppb; DTX1 12.3 and 13.4 ppb; OA 8.0 and 8.7 ppb; PTX2 12.1 and 13.2 ppb; YTX 36.9 and 40.1 ppb.
Keywords: acidic mobile phase; diarrheic shellfish toxin; LC-MS/MS
Abbreviations: AZA1 – azaspiracid-1; CCα – decision limit; CCβ – detection capability; CRM – certified reference material; DA – domoic acid; DTX1 – dinophysistoxin-1; HAB – harmful algal bloom; OA – okadaic acid; PTX2 – pectenotoxin-2; RSD – relative standard deviation; YTX – yessotoxin
Shellfish are low saturated-fat, high-protein food with rich essential minerals (Prato et al. 2019). Due to global warming and anthropogenic activity, the occurrence of harmful algal bloom (HAB) has increased in many parts of the world (Botana 2016). Consumption of seafood contaminated by phycotox-ins during HAB incidence would cause severe food poisoning and raise consumer concerns (Nicolas et al. 2017). The EU legislated the maximum permitted lipophilic toxin level of 160 µg/kg in okadaic acid (OA) equivalents for OA, dinophysistoxin (DTX) and pectenotoxin (PTX) together; 160 µg/kg for azaspiracid-1 (AZA), 1 mg/kg for yessotoxin (YTX)
and 20 mg/kg for domoic acid (DA) (Alarcan et al. 2018).
Reducing the risk of shellfish poisoning requires routine monitoring of complex shellfish toxin profiles to provide an early warning of harmful algal toxin contamination (Rodríguez et al. 2017). Previously, shellfish toxins were checked by mouse bioassay, but it was not very specific and sensitive compared to LC-MS/MS (Suzuki et al. 2018).
For multiple shellfish toxin analysis, several LC/ MS methods have been developed using acidic (Mc-Nabb et al. 2005; Braña-Magdalena et al. 2016), neutral (Stobo et al. 2005; McCarron et al. 2011),
and basic (Gerrsen et al. 2009) pH mobile phases. Although the LC condition was important, proper sample cleanup was also important for successful LC-MS/MS analysis. These et al. (2009) found that SPE could eliminate the matrix effect in LC-MS/MS analysis of multiple shellfish toxins.
In the present study, the analysis of six EU regulated shellfish toxins with one single run by LC-MS/MS with acidic mobile phase is developed. After methanol extraction of the shellfish toxins, the crude extract was subjected to HLB SPE cleanup before LC-MS/ MS analysis. The method was validated according to the guidelines given in Commission Decision 2002/657/EC.
MATERIAL AND METHODS
Reagents and chemicals. Water was deionized and passed through a water purification system to specific resistance greater than 18.0 MΩ/cm. Acetonitrile and methanol were of HPLC grade and were purchased from Tedia (USA). n-Hexane, ammonium acetate and formic acid for HPLC were purchased from Sigma-Aldrich (USA). OA (CRM-OA-c 14.3 ± 1.5 µg/ml), DA (CRM-DA-f 101.8 ± 2.1 µg/ml), PTX2 (CRM-PTX2 8.6 × 0.3 µg/ml), azaspiracid-1 AZA1 (CRM-AZA1 1.24 ± 0.07 µg/ml) were purchased from the National Research Council, Institute for Marine Biosciences (NRC-CNRC) (Canada). YTX (7.91 ± 0.64 µg/g) and DTX1 (2.55 ± 0.20 µg/g) were purchased from Laboratorio Cifga S.A. (Spain). From the above cer-tified reference material (CRM), series of standard solutions were prepared. Five concentration levels (10, 20, 50, 100, and 200 ppb) of AZA, DTX, OA, and pectenotoxin certified reference material (PTX CRM) solution were added into an uncontaminated Pseudo-cardium sachalinense shellfish extract as calibration solutions. Five concentration levels (1, 2.5, 5, 10, and 20 ppm) of domoic acid certified reference material (DA CRM) solution were added into an uncontami-nated Pseudocardium sachalinense shellfish extract as calibration solutions. Five concentration levels (50, 75, 100, 250, 500 ppb) of yessotoxin certified reference material (YTX CRM) solution were added into an uncontaminated Pseudocardium sachalinense
shellfish extract as calibration solutions.
All the shellfish samples came from self-controls that industries carried out before selling their prod-ucts and were collected by the Bureau of Standards, Metrology and Inspection (Taiwan).
Instruments. HPLC analysis was performed on a sys-tem of Agilent Technologies 1200 series HPLC. Electrospray ionization tandem mass spectrom-etry (ESI-MS/MS) data were acquired on AB SCIEX QTRAP 5500 (Applied Biosystems, Canada) triple quadrupole tandem mass spectrometer. Chroma-tography was carried out on an Agilent Poroshell EC-C18 column (Agilent, Germany). Hettich Mikro 120 (Hettich, Germany) was employed as centrifuge. The vortex mixer was Vortex Mixer VM-1000 (Yihder Co., Ltd., Canada).
Sample preparation. The sample of shellfish flesh was homogenized by using a blender. Methanol extrac-tion was performed in duplicate by weighing 2 g of homogenized sample into a 50-ml plastic centrifuge tube to which 4 ml of 80% methanol/water (80/20, v/v) was added. The extracts were vortexed for 5 min and centrifuged at 4000 rpm for 5 min. The two supernatant extracts were combined and defatted twice with 5 ml
n-hexane. After shaking for 5 min, take the bottom layer and blow dry with nitrogen to 3 ml as a sample solution for SPE cleanup.
The sample solution was loaded on an Oasis HLB SPE cartridge (60 mg, 3 ml) which was previously conditioned with 3 ml methanol and equilibrated with 3 ml water. The cartridges were washed by 3 ml water and 3 ml 10% methanol and eluted by 5 ml methanol. Collect the eluent, evaporate to dry with nitrogen at 45°C. Reconstitute the residue with 1 ml methanol and filter through 0.2 µm filter. After the SPE cleanup, the sample solution was ready for LC-MS/MS analysis.
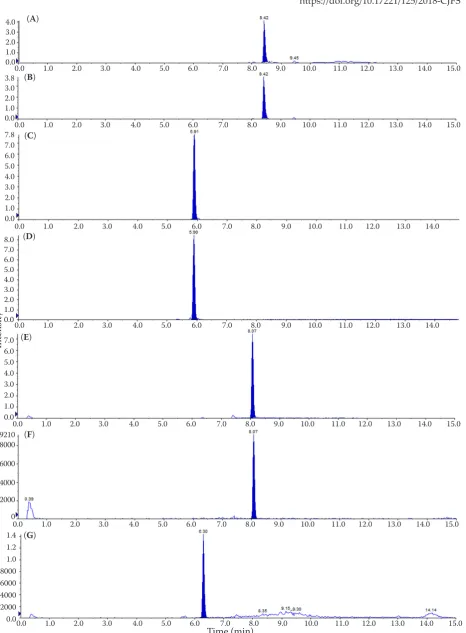
0.1 sec; scan type, multiple reaction monitoring mode (MRM). For each toxin two transitions were monitored using the settings in brackets: DA 312.5.5 > 294.2 (DP: 70.3 V, CE: 22.0 eV) and 312.5 > 266.5 (DP: 70.3 V, CE: 26.0 eV), PTX2 876.7 > 823.8 (DP: 137.7 V, CE: 36.9 eV) and 876.5 > 551.8 (DP: 137.7 V, CE: 37.0 eV), AZA1 842.7 > 824.6 (DP: 110 V, CE: 43.0 eV) and 842.7 > 672.7 (DP: 110 V, CE: 69.0 eV) for the positive mode and OA 803.5 > 563.2 (DP: −157.0 V, CE: −56.6 eV) and 803.5 > 255.5 (DP: −157.0 V, CE: −68.2 eV), YTX 1141.4 > 1061.6 (DP: −119.0 V, CE: −48.6 eV) and 1141.4 > 855.4 (DP: −119.0 V, CE: −105.0 eV), DTX1 817.6 > 255.2 (DP: −220.0 V, CE: −69.5 eV) and 817.6 > 113.1 (DP: −220.0 V, CE: −94.4 eV) for the negative mode. The quantifier ion transition for DA was 312.5 > 266.5, PTX2 876.7 > 823.8, AZA1 842.7 > 824.6, OA 803.5 > 255.5, YTX 1141.4 > 1061.6, DTX1 817.6 > 255.2, respectively. The qualifier ion transition for DA was 312.5.5 > 294.2, PTX2 876.5 > 551.8, AZA1 842.7 > 672.7, OA 803.5 > 563.2, YTX 1141.4 > 855.4, DTX1 817.6 > 113.1, respectively. The structures of these mass fragments are reviewed in detail by Suzuki (2018). The total chromatogram for the shellfish toxins in this study is shown in Figure 1. The observed MRM chromatograms for AZA1, DA, DTX1, OA, PTX2 and YTX are shown in Figure 2A−F.
Method validation. According to Commission De-cision No. 2002/657/EC regulation, the confirmatory analysis of food contaminants must meet the qualitative and quantitative performance criteria. The validation scheme in the present study was adopted from
Ver-don et al. (2007a). Three triplicates, at each of the five spiking levels (10, 20, 50, 100, and 200 ppb) into uncontaminated shellfish samples were analysed for AZA, DTX, OA, and PTX. Three triplicates, at each of the five spiking levels (1, 2.5, 5, 10, and 20 ppm) into uncontaminated shellfish samples were analysed for DA. Three triplicates, at each of the five spiking levels (50, 75, 100, 250, and 500 ppb) into uncontaminated shellfish samples were analysed for YTX. Calibration curves of each toxin for three triplicates were obtained for three days to calculate the CCα and CCβ levels of the shellfish toxins. Qualitative performance was evaluated through retention time, identification point, and ion ratio on three separate days. The quantitative param-eters were assessed through linearity, accuracy and precision, decision limit CCα and detection capability
CCβ. The decision limit CCα and detection capability
CCβ were calculated according to ISO Standard 11843 (Verdon et al. 2007b).
RESULTS AND DISCUSSION
[image:3.595.68.535.513.723.2]Validation of qualitative performance. The quali-tative performance was validated by retention time, identification point (IP), and ion ratio. The relative deviations of the chromatographic retention times for all the toxins were within ± 2.5% tolerance of 657/2002/EC. Two MRM transitions were monitored for each of the toxins as described in the chromato-graphic analysis section, so four IPs were earned and
Figure 1. Total ion chromatograms (TICs) of toxin reference materials: positive ionization (A); negative ionization (B) a − domoic acid (DA) 500 (ng/ml); b − pectenotoxin-2 (PTX2) (10 ng/ml); c − azaspiracid-1 (AZA1) (10 ng/ml); d − okadic acid (OA) (10 ng/ml); e − yessotoxin (YTX) (50 ng/ml); f − dinophysistoxin-1 (DTX1) (10 ng/ml)
In
tensity
Time (min) (A)
(B)
a b
c
d e
f
1.9
1.5
1.0
5.0
0.00.0 1.0 2.0 3.0 4.0 5.0 6.0 7.0 8.0 9.0 10.0 11.0 12.0 13.0 14.0 15.0
0.0 1.0 2.0 3.0 4.0 5.0 6.0 7.0 8.0 9.0 10.0 11.0 12.0 13.0 14.0 15.0 5.7
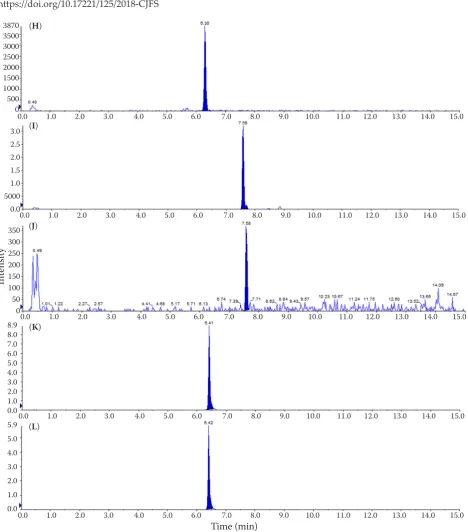
Figure 2. MRM chromatograms of shellfish toxins: AZA1 quantitative (A) and qualitative ion (B); DA quantitative (C) and qualitative ion(D); DTX1 quantitative (E) and qualitative ion (F); OA quantitative (G) and qualitative ion (H); PTX2 quantitative (I) and qualitative ion (J); YTX quantitative (K) and qualitative ion (L); *For abbreviations see Figure 1
In
tensity
Time (min)
(A)
(B)
(C)
(E)
(G) (D)
(F) 4.0 3.0 2.0 1.0 0.0 3.8 3.0 2.0 1.0 0.0
0.0 1.0 2.0 3.0 4.0 5.0 6.0 7.0 8.0 9.0 10.0 11.0 12.0 13.0 14.0 15.0
0.0 1.0 2.0 3.0 4.0 5.0 6.0 7.0 8.0 9.0 10.0 11.0 12.0 13.0 14.0 15.0
0.0 1.0 2.0 3.0 4.0 5.0 6.0 7.0 8.0 9.0 10.0 11.0 12.0 13.0 14.0
0.0 1.0 2.0 3.0 4.0 5.0 6.0 7.0 8.0 9.0 10.0 11.0 12.0 13.0 14.0
0.0 1.0 2.0 3.0 4.0 5.0 6.0 7.0 8.0 9.0 10.0 11.0 12.0 13.0 14.0 15.0
0.0 1.0 2.0 3.0 4.0 5.0 6.0 7.0 8.0 9.0 10.0 11.0 12.0 13.0 14.0 15.0
0.0 1.0 2.0 3.0 4.0 5.0 6.0 7.0 8.0 9.0 10.0 11.0 12.0 13.0 14.0 15.0 7.8
7.0 6.0 5.0 4.0 3.0 2.0 1.0 0.0
8.0 7.0 6.0 5.0 4.0 3.0 2.0 1.0 0.0
7.0 6.0 5.0 4.0 3.0 2.0 1.0 0.0
9210 8000
6000
4000 2000 0
none of the toxins shared the same transitions. The ion ratio deviations observed for AZA, DA, DTX, OA, PTX and YTX were all within the 657/2002/EC requirements for ion ratio.
Linearity of calibration curve. The linearity of the chromatographic response was evaluated by calibration curves in triplicate for three days using 5 calibration concentration points (10, 20, 50, 100, and 200 ppb) for AZA, DTX, OA, and PTX; 5 calibration
concen-tration points (1, 2.5, 5, 10, and 20 ppm) in triplicate for three days for DA; and 5 calibration concentration points (50, 75, 100, 250, and 500 ppb) in triplicate for three days for YTX. Linear regression analysis was carried out by plotting the peak area of the shellfish toxin versus the shellfish toxin concentrations. Linear ranges, slopes, intercepts, and correlation coefficients are listed in Table 1. Good linearity was obtained as all correlation coefficients were ≥ 0.990.
(I)
(K) (H)
(J)
(L)
In
tensity
[image:5.595.66.535.88.621.2]Time (min)
Figure 2. To be continued
0.0 1.0 2.0 3.0 4.0 5.0 6.0 7.0 8.0 9.0 10.0 11.0 12.0 13.0 14.0 15.0
0.0 1.0 2.0 3.0 4.0 5.0 6.0 7.0 8.0 9.0 10.0 11.0 12.0 13.0 14.0 15.0
0.0 1.0 2.0 3.0 4.0 5.0 6.0 7.0 8.0 9.0 10.0 11.0 12.0 13.0 14.0 15.0
0.0 1.0 2.0 3.0 4.0 5.0 6.0 7.0 8.0 9.0 10.0 11.0 12.0 13.0 14.0 15.0
0.0 1.0 2.0 3.0 4.0 5.0 6.0 7.0 8.0 9.0 10.0 11.0 12.0 13.0 14.0 15.0 5.9
Precision and accuracy. The precision and accu-racy were checked by spiking 20 ppb AZA, 2500 ppb
DA, 20 ppb DTX, 20 ppb OA, 20 ppb PTX, and 75 ppb YTX in a blank shellfish matrix in three replicates for three days. The extraction and cleanup steps were performed according to the procedure described above. The method precision and accuracy values are listed in Table 2. For azaspiracid-1 (AZA1), domoic acid (DA), dinophysistoxin-1 (DTX1), okadaic acid
(OA), pectenotoxin-2 (PTX2), and yessotoxin (YTX) toxins the recovery rate was 99.4, 92.7, 114.1, 90.2, 115.2 and 87.8%, respectively. The recovery rate was between 80 and 120%, which was like in the previous study by Braña-Magdalena (2014). The procedure for the calculation of intra-day RSD and inter-day RSD was adopted from Kaloudis (2016) and listed in the supplement file. The intra-day RSD was be-tween 0.93 and 8.43% for all six shellfish toxins. The inter-day RSD was less than 5% for AZA, DTX, PTX, YTX, 7.85 % for DA, and 12.95% for OA.
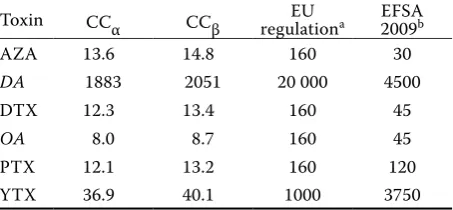
Decision limit (CCα) and detection capability (CCβ ). The decision limit (CCα), detection capability (CCβ), current EU regulation limit and European Food Safety Authority (EFSA) suggested regulation limit (Gerssen
et al. 2010; Paredes et al. 2011) are listed in Table 3. For all the toxins, the decision limits (CCα) are all less than one tenth of the current EU regulation level.
Analyses of real shellfish samples. A total of 20 shellfish samples supplied by the Bureau of Stan-dards, Metrology and Inspection (Taiwan) from local industries that carried out self-controls were analysed by the developed LC-MS/MS method. Most of the samples were not contaminated with shellfish toxins. One Placopecten magellanicus was contaminated with 2.2 ppb PTX, one Patinopecten yessoensis was contaminated with 1.8 ppb PTX, 213 ppb YTX and 9.0 ppb DTX, and one Ruditapes philippimarum with 1.7 ppb PTX and 1.9 ppb OA. The detected toxin levels are all under the EU regulated limits. The results demonstrated the capability of the present LC-MS method for multiple shellfish toxin analysis.
CONCLUSIONS
[image:6.595.63.292.263.370.2]The monitoring of six EU regulated shellfish toxins with one single run by fast polarity switching LC-MS/ MS with acidic mobile phase is demonstrated to be ac-ceptable and is validated according to Commission Decision 2002/657/EC. For azaspiracid-1 (AZA1), domoic acid (DA), dinophysistoxin-1 (DTX1), okadaic acid (OA), pectenotoxin-2 (PTX2), and yessotoxin (YTX) toxins the recovery rate was 99.4, 92.7, 114.1, 90.2, 115.2 and 87.8%, respectively. The intra-day RSD was less than 5% for all the shellfish toxins except for 8.43% for DA. The inter-day RSD was less than 5% for AZA, DTX, PTX, YTX, 7.85% DA, and 14.63% for OA. The decision limit (CCα) and detection capability (CCβ) for AZA were 13.6 and 14.8 ppb; for DA they were 1883 and 2051 ppb; for
Table 1. Linear range, slope, intercept, and correlation coefficients of calibration curves
Linear range
(µg/kg) Slope Intercept Correlation coefficient
AZA1 10–200 103 021 – 617 419 0.998
DA 1000–20 000 987 634 068 0.996
DTX1 10–200 12 030 – 34 551 0.998
OA 10–200 2588 1070 0.999
PTX2 10–200 6265 –24 169 0.998
YTX 50–500 3164 58 816 0.998
[image:6.595.63.291.453.572.2]AZA1 − azaspiracid-1; DA − domoic acid; DTX1 − dinophy-sistoxin-1; OA − okadaic acid; PTX2 − pectenotoxin-2; YTX − yessotoxin
Table 2. Method recovery rate, intra-day RSD and inter-day RSD (n = 3)
Spiked level Recovery Intra-day RSD Inter-day RSD
(ppb) (%)
AZA1 20 99.4 0.93 2.4
DA 2500 92.7 8.43 7.85
DTX1 20 114.1 1.50 2.97
OA 20 90.2 3.10 12.95
PTX2 20 115.2 2.81 2.97
YTX 75 87.8 4.02 3.55
*For abbreviations see Table 1
Table 3. Decision limit (CCα), detection capability (CCβ), EU regulation and ESFA suggested limits (ppb)
Toxin CCα CCβ regulationEU a EFSA 2009b
AZA 13.6 14.8 160 30
DA 1883 2051 20 000 4500
DTX 12.3 13.4 160 45
OA 8.0 8.7 160 45
PTX 12.1 13.2 160 120 YTX 36.9 40.1 1000 3750
[image:6.595.64.291.630.735.2]DTX 12.3 and 13.4 ppb; for OA 8.0 and 8.7 ppb; for PTX 12.1 and 13.2 ppb; for YTX 36.9 and 40.1 ppb.
The present LC-MS/MS method could not only meet the future ESFA requirement but also it could analyse six regulated shellfish toxins in a single run. In the future, further work should be done to reduce human labour in sample preparation and increase the sample throughput of the present method.
References
Alarcan J., Biré R., Le Hégarat L., Fessard V. (2018): Mix-tures of lipophilic phycotoxins: exposure data and toxi-cological assessment. Marine Drugs, 16: 46.
Botana L.M. (2016): Toxicological perspective on climate change: aquatic toxins. Chemical Research in Toxicology, 29: 619–625.
Braña-Magdalena A., Leão-Martins J.M., Glauner T., Gago-Martínez A. (2014): Intralaboratory validation of a fast and sensitive UHPLC/MS/MS method with fast polarity switching for the analysis of lipophilic shellfish toxins. Journal of AOAC International, 97: 285–292.
Gerssen A., Mulder P.P.J., McElhinney M.A., de Boer J. (2009): Liquid chromatography-tandem mass spectrometry method for the detection of marine lipophilic toxins under alkaline conditions. Journal of Chromatography A, 1216: 1421–1430. Gerssen A., van Olst E.H.W., Mulder P.P.J., de Boer J. (2010):
In-house validation of a liquid chromatography tandem mass spectrometry method for the analysis of lipophilic marine toxins in shellfish using matrix-matched calibration. Analytical and Bioanalytical Chemistry, 397: 3079–3088. Kaloudis T., Triantis T.M., Hiskia A. (2016): Basic validation
protocol for the analysis of cyanotoxins in environmental samples. Handbook of Cyanobacterial Monitoring and Cyanotoxin Analysis: 481–485.
McCarron P., Giddings S., Quilliam M. (2011): A mussel tis-sue certified reference material for multiple phycotoxins. Part 2: liquid chromatography-mass spectrometry, sam-ple extraction and quantitation procedures. Analytical and Bioanalytical Chemistry, 400: 835–846.
McNabb P., Selwood A.I., Holland P.T., Aasen J., Aune T., Eaglesham G., Hess P., Igarishi M., Quilliam M., Slattery D., Van de Riet J., Van Egmond H., van den Top H., Yasumoto T. (2005): Multiresidue method for determination of algal toxins in shellfish: single-laboratory validation and interlab-oratory study. Journal of AOAC International, 88: 761–772. Nicolas J., Hoogenboom R.L.A.P., Hendriksen P.J.M., Bo-dero M., Bovee T.F.H., Rietjens I.M.C.M., Gerssen A. (2017): Marine biotoxins and associated outbreaks fol-lowing seafood consumption: Prevention and surveillance in the 21st century. Global Food Security, 15: 11–21.
Paredes I., Rietjens I.M.C.M., Vieites J.M., Cabado A.G. (2011): Update of risk assessments of main marine bio-toxins in the European Union. Toxicon, 58: 336–354. Prato E., Biandolino F., Parlapiano I., Giandomenico S.,
Denti G., Calò M., Spada L., Di Leo A. (2019): Proximate, fatty acids and metals in edible marine bivalves from Italian market: Beneficial and risk for consumers health. Science of the Total Environment, 648: 153–163. Quilliam M.A. (2003): The role of chromatography in the
hunt for red tide toxins. Journal of Chromatography A, 1000: 527–548.
Rodrigues S.M., Vale P., Botelho M.J., Gomes S.S. (2009): Extraction recoveries and stability of diarrhetic shellfish poisoning (DSP) toxins in naturally contaminated samples. Food Additives & Contaminants: Part A: Chemistry, Analy-sis, Control Exposure & Risk Assessment. 26: 229–235. Rodríguez I., Vieytes M.R., Alfonso A. (2017): Analytical
challenges for regulated marine toxins. Detection meth-ods. Current Opinion in Food Science, 18: 29–36. Stobo L.A., Lacaze J.P., Scott A.C., Gallacher S., Smith E.A.,
Quilliam M.A. (2005): Liquid chromatography with mass spectrometry-detection of lipophilic shellfish toxins. Journal of AOAC International, 88: 1371–1382.
Suzuki T., Uchida H., Watanabe R. (2017): LC/MS analysis of marine toxins. In: Diogène J., Campàs M. (eds). Comprehen-sive Analytical Chemistry. Amsterdam, Elsevier: 137–192. These A., Scholz J., Preiss-Weigert A. (2009): Sensitive
method for the determination of lipophilic marine bio-toxins in extracts of mussels and processed shellfish by high-performance liquid chromatography-tandem mass spectrometry based on enrichment by solid-phase ex-traction. Journal of Chromatography A, 22: 4529–4538. Verdon E., Couedor P., Sanders P. (2007a): Multi-residue
monitoring for the simultaneous determination of five nitrofurans (furazolidone, furaltadone, nitrofurazone, nitrofurantoine, nifursol) in poultry muscle tissue thor-ough the detection of their five major metabolites (AOZ, AMOZ, SEM, AHD, DNSAH) by liquid chromatography coupled to electrospray tandem mass spectrometry— In-house validation in line with Commission Decision 657/2002/EC. Analytica Chimica Acta, 586: 336–347. Verdon E., Hurtaud-Pessel D., Sanders P. (2007b):
Evalua-tion of the limit of performance of an analytical method based on a statistical calculation of its critical concen-trations according to iso standard 11843: Application to routine control of banned veterinary drug residues in food according to European Decision 657/2002/EC. Ac-creditation and Quality Assurance, 12: 54–54.