Accepted Manuscript
Title: Firm-level internationalisation and the home bias puzzle
Authors: Jenny Berrill, Colm Kearney
PII: S0148-6195(10)00013-5
DOI: doi:10.1016/j.jeconbus.2010.02.002
Reference: JEB 5544
To appear in: Journal of Economics and Business
Received date: 21-3-2009
Revised date: 20-2-2010
Accepted date: 22-2-2010
Please cite this article as: Berrill, J., & Kearney, C., Firm-level internationalisation and the home bias puzzle, Journal of Economics and Business (2008), doi:10.1016/j.jeconbus.2010.02.002
Accepted Manuscript
Firm-level internationalisation and the home bias puzzle
Abstract
The extent to which internationalising MNEs create value, and the extent to which investors can reap the benefits of firm-level internationalisation remain controversial issues. Using a multi-country dataset with over 3 million observations, we classify 1,143 firms listed on the exchanges of the G7 countries according to the geographical spread of their sales and subsidiaries. We show that more internationalised firms provide greater diversification benefits. By investing in home-based internationalised firms, investors can ‘free ride’ the costs and risks associated with internationalisation at the level of the firm and exhibit home bias while availing of international diversification benefits.
Keywords
International diversification, home bias, mean variance spanning.
JEL Classification
Accepted Manuscript
1 Introduction
Enhanced integration throughout the world’s commodity, industrial and service sectors has created expanding opportunities for firms and investors to reap the synergistic gains from internationalisation. Firms have responded by internationalising their activities across greater geographical and cultural distances through trading, forming alliances, licensing, joint venturing and foreign direct investment (FDI). The extent to which they create value by internationalisation remains a controversial issue, with divergent results across many studies. Investors have responded to greater international integration by holding more geographically and culturally distant foreign assets in their portfolios. The extent to which they diversify internationally, however, remains significantly less than what many analysts and researchers believe should be observable. This is the so-called ‘international diversification puzzle’ or ‘home-bias puzzle’. It arises because although the benefits of international portfolio diversification are significant, and although the costs and risks associated with achieving them appear small relative to those associated with internationalising at the level of the firm, investors continue to hold the majority of their equity portfolios in domestic rather than foreign-based firms.
Accepted Manuscript
In this paper, we provide a different perspective on the home bias puzzle. Combining the resources of Datastream, Dun and Bradstreet’s Who Owns Whom, and Worldscope, we construct a sample of 1,143 firms from the G7 countries: Canada, France, Germany, Italy, Japan, the UK and the US. Our sample comprises the constituent firms of these countries’ main stock indexes for which we have the full set of data. We measure firm-level and market performance using daily returns from January 1999 to June 2007. We classify the degree of multinationality of these firms’ operations from the geographical spread of their sales and subsidiaries as either domestic (D), regional (R), trans-regional (T) or global (G). Our analysis yields several novel findings. First, we show that the greater the firm’s
international reach, the more diversification benefits it can provide. Abstracting from country effects, firms that are more internationalised in their activities tend to provide greater diversification benefits to investors in every country in our sample. Second, we show that investors in each country can gain international diversification without having to invest in foreign-based firms. By investing in internationalised firms listed in their home countries, investors can ‘free ride’ the costs and risks associated with internationalisation at the level of the firm. We suggest that the contradictory findings in prior studies of this issue may be due to inconsistent definitions of ‘multinational’ or ‘international’ firms. When differences in firm-level internationalisation are carefully considered, it is clear that investors can benefit from international diversification while exhibiting ‘home bias’.
Accepted Manuscript
Our paper exhibits several other innovative features. Our firm-level classification provides a new perspective on the construction of empirical samples of multinational enterprises (MNEs). Multinationality is a key dimension of the international business, economics and finance disciplines that spans all theoretical frameworks, levels of empirical analysis and domains of investigation. In empirical studies of MNEs, however, there is no widely accepted measure of the degree of firm-level multinationality. Membership of a particular data set or company list is often used to qualify firms as multinational. This has the effect of combining different kinds of firm into a broad category labelled ‘MNE’, and the resulting sample is used to test hypotheses about the nature, objectives, strategies and performance of MNEs. This issue is also discussed in Pantzalis (2001) and Choi and Jiang (2009). We overcome this problem by introducing a classification system for the degree of firm-level multinationality.
By classifying firms as ‘domestic’, ‘regional’, ‘trans-regional’ or ‘global’, we are able to establish and test a richer set of hypotheses about the benefits of diversification at different degrees of firm-level multinationality than has been investigated by previous researchers. Following Rowland & Tesar (2004), we apply our methodology to the perspective of investors in each of the G7 countries using a significantly larger dataset. Existing studies of the diversification benefits of investing in MNEs (such as Huberman & Kandel, 1987; Bekaert & Urias, 1996; and Errunza, Hogan & Hung, 1999) typically examine the question from a US perspective. The US has one of the most diversified economies and stock markets in the world, and results obtained using US data will not necessarily apply in other countries. Lastly, using mean variance spanning (MVS) tests to calculate the statistical significance of differences in firm-level diversification benefits, and using Sharpe ratios to measure their economic significance, we consider in turn the case in which investors can short sell without costs, and the case with short selling constraints.
Accepted Manuscript
we describe our data, introduce our firm-level classification methodology, and describe the MVS tests. Our hypotheses and results are presented and discussed in section 4. In section 5, we present our robustness analysis for size effects, industry effects, short sales constraints, and alternative specifications of our classification of firms. The final section summarises our paper and draws together our conclusions.
2 Previous related research
If capital markets were perfectly developed, and if international capital mobility was unimpeded, the returns on stocks in each country would include only the value of their contribution to the risk of the fully diversified world portfolio. In such a world, international diversification at the level of the firm would be inconsequential. In reality, however, no country has perfect capital markets, and there are substantial barriers, costs and risks associated with international portfolio investment. Because of this, investors are only partially diversified internationally, and they tend to hold a limited number of stocks (Barberis & Thaler, 2003). In addition, internationalisation of the firm can potentially raise firm value, and investors can obtain at least part of their desired degree of international diversification by investing in home-based internationalised firms. This raises two related questions: how does the degree of internationalisation affect firm performance, and to what extent can investors obtain the benefits of international diversification by investing in home-based internationalised firms?
Accepted Manuscript
from imperfectly competitive factor and product markets. In addition to the initial investment, the costs include higher coordination and management expenses over geographical and cultural distances, enforcement of contracts, protection of patents, and the risks associated with foreign exchange, taxation, and political factors. The many possible patterns of firm-level internationalisation imply alternative combinations of benefits and costs, and following the early work of Errunza & Senbet (1981, 1984), an extensive empirical literature has sought to identify and measure them. The issue, however, remains unsettled. Douglas & Craig (1983), Lecraw (1983), Grant (1987), Allen & Pantzalis (1996) and Brouthers, Werner & Matulich (2000) have found that the degree of internationalisation is positively associated with profitability. In contrast, Mishra & Gobeli (1998) found that greater internationalisation by itself does not deliver greater value, and Berry (2006) found that the benefits depend on the location and industrial patterns of internationalisation relative to the firm’s experience. Gomes & Ramaswamy (1999) concluded that greater internationalisation brings benefits up to a point beyond which they cease, and Kotabe, Srinivasan & Aulakh (2002) found that the benefits are moderated by R&D and marketing capabilities. Doukas & Lang (2003) showed that firms create (destroy) value when they internationalise from their core (non-core) activities. Overviews of the literature on this issue are provided by Annavarjula & Beldona (2000), Majocchi & Zuchella (2003) and Li (2007).
Accepted Manuscript
Salehizadeh (2003) and Rowland & Tesar (2004) all found that investing in home-based MNEs does not yield significant international diversification benefits.
Research on the question of the extent to which investing in multinational firms can substitute for investing internationally has been hampered by the multiplicity of approaches that have been used to gather samples of ‘MNEs’. We provide three examples to illustrate the diversity of MNE samples. Lecraw’s (1983) sample comprises 153 MNE subsidiaries spread across five countries and six industries that have substantial FDI. He found that MNEs’ profitability rises with market share, advertising R&D and tariffs. Lecraw used the multinationality of the industry to classify firms as MNEs, but scant information is provided on the individual firms. With no further information on the criteria for sample selection, we know little about the depth or breadth of the multinationality of these firms. Michel & Shaked (1986) examined Fortune 500 firms in the manufacturing sector, classifying them as MNEs if at least 20 percent of their total sales were foreign and if they had direct investment in at least six countries. The firms were classified as domestic if they had less than 10 percent of their sales, profits and assets abroad. These thresholds are problematic. A firm with 20 percent foreign sales to one country in its home region would be grouped with another firm with 60 percent foreign sales to three continents. Another firm with 15 percent foreign sales spread over six countries in all continents would be classified as neither multinational nor domestic. Errunza, Hogan & Hung (1999) used a sample of the 30 largest US firms from the
Fortune 100 list. Because it is based on total sales without considering their international spread, the sample probably includes firms with very different degrees of multinationality.
Accepted Manuscript
same research question. This has impeded comparisons between related studies, and it has hindered the ability to generalise, replicate and draw conclusions on particular topics. This in turn has curtailed the process of validating, refining and rejecting prevailing theory, which is necessary for advancement of the discipline (Kuhn, (1962); Popper, (1978)). We suggest that research agendas could progress more effectively by the adoption of a common or at least a more carefully considered approach to operationally defining and measuring the degree of firm-level multinationality.
3 Data and methodology
We began our data collection by identifying all 1,289 firms that comprise the main stock indexes in the G7 countries: the Canadian TSX 60, the French SBF 120, the German
HDAX 110, the Italian MIB-SGI 174, the Japanese Nikkei 225, the UK FTSE 100 and the US S&P 500. We measure performance using 2,217 observations of daily firm-level and market-level returns from 1 January 1999 to 30 June 2007, and our proxy for the risk-free rate is the 3-month treasury bill rate for each country. We obtained the geographical breakdown of each firm’s sales from Worldscope using company accounts for December 2005, and of each firm’s subsidiaries from Dun and Bradstreet’s Who Owns Whom
2005/06. All stock price, market index, exchange rate and treasury bill rate data were sourced from Datastream. After removing firms for which these data were not available, our sample comprises 1,143 firms.
We define the degree of multinationality of a firm’s operations along two dimensions:
Accepted Manuscript
sales and investments. Investments, such as joint ventures and subsidiaries, entail a deeper engagement with foreign markets and higher exposures to foreign business, economic and political risks than sales. We combine the breadth and depth dimensions to form our matrix of multinationality below.
Breadth of Geographical Spread
Depth of
Engagement Domestic Regional regional Trans- Global
Trading TD TR TT TG
Investments ID IR IT IG
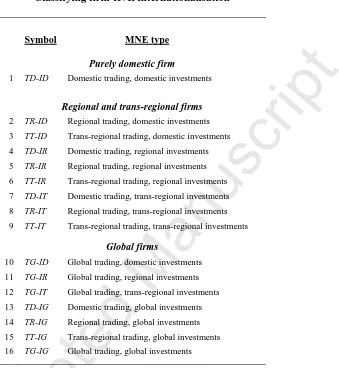
Taking both dimensions together, there 16 different types of firm, ranging from purely domestic firms (TD-ID) that conduct their trading activities and investments entirely within their home countries, to deeply global MNEs (TG-IG) that have trading activities and subsidiaries in all regions of the world. These are presented in Table 1, which describes eight types of regional and trans-regional firm (numbered 2 to 9) and seven types of global corporation (numbered 10 to 16). Looking first at the eight regional and trans-regional firms numbered 2 to 9, we can differentiate between firms that have increasingly broad but shallow patterns of geographical spread (firms 2–3), and those that are more deeply engaged with foreign markets (firms 4–9). One would not expect a type 4 firm (TD-IR) with domestic trading and regional investments to deliver the same international diversification benefits as a type 9 firm (TT-IT) with trans-regional sales and subsidiaries. But this is precisely what many researchers assume when they combine such firms to form their ‘MNE’ data sets – along with purely domestic (TD-ID) and deeply global firms (TG-IG)! Looking next at the seven global firms numbered 10 to 16 in the Table, they can be global in their trading (firms 10–12), their investments (firms 13–15), or both (firm 16). Firm 10 (TG-ID) is shallowly global and deeply domestic, whereas firm 12 (TG-IT) is shallowly global and deeply trans-regional.
Accepted Manuscript
FTSE 100 and the S&P 500.1 First, we generate several country-specific indexes. For each country, we create indexes of domestic (D), regional (R), trans-regional (T) and global (G) firms, using sales data to classify the firms. We then repeat this using subsidiaries to classify the firms. This potentially yields 8 indexes for each country or 56 indexes in total. The resulting number of country-specific indexes is in fact 51 rather than 56, because Canada and Japan have no firms with global (G) sales, Germany and Japan have no firms with regional (R) sales, and Canada has no firms classified as regional (R) in subsidiaries. Second, we construct 8 cross-country indexes that include all of the domestic (D), regional (R), trans-regional (T) and global (G) firms in our 7-country sample, using the sales and then the subsidiaries data. We examine the robustness of our results to currency denomination, by using daily bilateral exchange rates to convert all 59 indexes into each of the five currencies of the G7 countries – the Canadian dollar, the Euro (France, Germany and Italy), the Japanese Yen and the US dollar. Together with the market index and the risk free rate for each country, we have over 3 million (2,534,031 firm-level and 696,138 market and index-level) observations for our analysis.The sources of international firm-level diversification
Errunza, Hogan & Hung (1999) introduced the concept of home-based international diversification (HID) that is achieved by holding claims on foreign assets that trade only in the investor’s home country, and foreign-based international diversification (FID) from holding foreign assets that trade only in foreign markets. Recognising that HID can achieve some of the benefits of FID, they note that this is consistent with observed home bias in investors’ portfolios. We adapt these concepts and apply them to our firm-level analysis by using HID and FID to denote the international diversification benefits available to investors in each country by investing in home-based and foreign-based firms respectively. Thus, while the market index in any country comprises home-based domestic firms (D), it also comprises home-based internationalised firms (R, T and G) through which domestic investors can obtain HID. Equation (1) describes the return on the market index in country i,Rmi , as the sum of the returns on home-based domestic firms multiplied by their value weights, Di
i DR
Accepted Manuscript
equation (2) as comprising the returns on all home-based regional (R), trans-regional (T) and global (G) firms in the index.
i HID i HID i
D i D i
m ω R ω R
R = + with ωiD+ωiHID =1 (1)
i G i G i T i T i R i R i
HID ω R ω R ω R
R = + + with ωRi +ωTi +ωGi =ωHIDi (2)
In Table 2, we detail the number of domestic, regional, trans-regional and global firms classified by the geographical spread of their sales (with percentages in brackets) in each country. Of the 1,143 firms in our sample, 229 (20 percent) are domestic, and this ranges from 30 percent in Italy to 5 percent in Germany. Although the relative sizes of the domestic and international sub-components vary considerably, the vast majority of firms have sales beyond their home regions. Putting this another way, the potential for HID
arises in 80 percent of firms overall; it arises in more than 70 percent of firms in each country, and in over 90 percent of firms in France, Germany, Japan and the UK. The size of the US economy explains the large size of its domestic sector, which in turn implies that the potential benefits of HID are less than in other countries. Of the international firms, 835 (73 percent) are trans-regional, 40 (4 percent) are regional, and 39 (3 percent) are global. The market indexes in every country in our sample are dominated by trans-regional firms to a greater or lesser extent, and these numbers are similar when we use the subsidiary data. The small number of truly global firms is broadly consistent with Rugman & Verbeke (2007, 2008) and Osegowitsch and Sammartino (2008), who use different regional definitions and methodologies.
Correlation analysis
Accepted Manuscript
within-country averages, we condense what would be a large set of correlation matrixes into a small summary table. The first column, Market, gives the average correlation for each stock market with the other 6 stock market indexes. For example, the average correlation of the US stock market with the other 6 stock market indexes is 0.347. Columns [2] to [5] headed D, R, T and G show average correlations between the indexes of domestic, regional, trans-regional and global firms in each country with the 6 foreign stock markets. For example, in column [2] we can see that our index of Canadian domestic firms has an average correlation of 0.185 with the 6 foreign (non-Canadian) stock markets. Looking at the inter-stock market correlations in the first column, the Japanese stock market is the least correlated with the other markets, suggesting that Japanese investors would benefit most from diversification by investing in stocks from the other G7 countries. Investors from mainland Europe would benefit least from international diversification; the French and German stock markets have the highest average correlations with the other G7 stock markets, 0.608 and 0.583 respectively.
The correlations summarised in columns [2] to [5] give some preliminary insight into the extent to which the degree of firm-level multinationality might provide diversification benefits to foreign investors. As expected, domestic (D) firms in most countries have the lowest correlation with foreign markets, with an average correlation coefficient of 0.247, and regional firms are slightly more highly correlated at 0.295. The trans-regional firms in all of the G7 countries are most highly correlated with foreign markets, with an average correlation coefficient of 0.441, and the corresponding figure for global firms is 0.387. These figures suggest that for investors holding a portfolio of home-based firms, the greatest diversification benefits would be gained by investing in foreign-based domestic (D) firms, closely followed by foreign-based regional (R) firms.
Mean Variance Spanning
Accepted Manuscript
comparing the risk adjusted performance of MNEs and domestic firms; comparing firms on the basis of returns, standard deviations, betas, coefficient of variation and performance measures, such as the Sharpe, Treynor and Jensen measures (Jacquillat and Solnik (1978), Mikhail and Shawky (1979), Senchack and Beedles (1980), Fatemi (1984) and Michel and Shaked (1986)); and more recently, MVS tests (Errunza, Hogan and Hung (1999), Rowland and Tesar (2004)). We use the latter methodology because of its analytical rigour in facilitating a series of related tests of the statistical significance of diversification benefits using consistent benchmark portfolios, and we accompany these with Sharpe ratio measures of their economic benefits.
Following the methodology of Huberman and Kandel (1987), De Roon and Nijman (2001) and Kan and Zhou (2001), we apply our MVS tests to examine whether adding international assets can improve the efficient risk-return frontier that confronts investors who hold only domestic assets. In the spanning literature parlance, we consider a set of K
‘benchmark’ (domestic) assets and N ‘test’ (international) assets, and we investigate whether, conditional on the K benchmark assets, the addition of the N test assets can shift the mean variance efficient frontier. Alternatively, conditional on the K+N benchmark and test assets, can the subset of K benchmark assets yield the same diversification benefits? In other words, we are interested in whether the K benchmark assets ‘span’ the extended set of K+N assets. To do this, we define R1,t as the K×1 vector of returns on the
K benchmark assets and R2,t as the N×1 returns on the N test assets at time t, and we
combine R1,t and R2,t in the K+N vector
' '
, 2 '
, 1 , ]
[ t t
t R R
R . The MVS test proceeds by regressing the N test asset returns on the K benchmark returns as below,
t t
t R
R2, 1, (3)
with t~ N(0,), E
R2,t E
R1,t 2 1, and V21V111.Accepted Manuscript
that for every test asset, we can obtain a portfolio of the K benchmark assets that has the same expected return (because 0 and 1) and a lower variance (because R1,t and
t
ε are uncorrelated while Var
t is positive definite). Details of implementing this testare provided in the Appendix.
The null hypothesis is that the benchmark portfolio spans the extended portfolio comprising the benchmark assets and the test assets, implying that the mean variance frontiers coincide at all points. We estimate equation (3) using ordinary least squares OLS. We test the spanning restrictions using Kan & Zhou’s (2001) suggested two-step Wald tests, whereby we first test whether α = 0, and we then test whether β = 1 conditional on α = 0. If we reject the null hypothesis of spanning due to the first test the tangency portfolios are different, and if we reject due to the second test, the global minimum-variance portfolios are different. The OLS tests assume that the error terms are normally distributed and homoskedastic, and to check the robustness of our results, we repeat all tests using the generalised method of moments (GMM) which does not require information about the exact distribution of the error terms3. If the null hypothesis of spanning is rejected, we measure the economic significance of the diversification benefits by changes in the Sharpe ratios between the K benchmark assets and the K + N assets. Different Sharpe ratios indicate that investors can improve their risk-return tradeoffs by investing in the additional assets4.
4 Tests and results
Accepted Manuscript
global firms as the extended sets. Finally, in test 4, the benchmark portfolios comprise home-based domestic firms, and foreign-based firms form the extended sets.
Test 1: Replicating conventional tests of the benefits of international portfolio diversification
Our first test replicates conventional tests of the benefits of international portfolio diversification. To implement this, we set each country’s aggregate market index as the ‘benchmark’ portfolio of K assets, we set the optimally weighted portfolio of the remaining G7 countries’ market indexes converted to the home country’s currency as the extended ‘test’ portfolio of N international assets, and we conduct MVS tests equivalent to equation (3) as in (4), testing the joint null hypothesis that i 0 and i 1 .
i t m i
t m i i j
t
m R
R , , , with i = countries 1 … 7. (4)
The results of these tests are presented in Table 4. The Wald tests indicate that spanning is rejected in all countries. The step-down Wald tests of β = 1 indicate that the minimum variance portfolios of the extended and benchmark assets are statistically different in each country, and the step-down Wald tests of α = 0 indicate that the tangency portfolios are also statistically different in every country except Canada. The latter result is not surprising, because the Sharpe ratio of the benchmark domestic index in Canada, at 4.047, shows that this market performed the best amongst all countries over the sample period. The percentage increase in the Sharpe ratios average 147 percent, ranging from 14 percent for Canada to 289 percent for the United States. Overall, this test confirms the usefulness of our methodology to replicate conventional measures of the statistically and economically significant benefits of international portfolio diversification.
Test 2: International diversification and the degree of firm-level multinationality
Accepted Manuscript
(D) firms, and our ‘test’ assets are the portfolios of all regional (R), trans-regional (T) and global (G) firms. The returns on these four ‘world’ portfolios are, respectively, RWD , RRW,
W T
R and RGW. We therefore conduct three MVS tests equivalent to equation (3) as in
equations (5a) – (5c).
R t , m W t , D R R W t ,
R α β R ε
R = + + (5a)
T t , m W t , D T T W t ,
T α β R ε
R = + + (5b)
G t , m W t , D G G W t ,
G α β R ε
R = + + (5c)
In (5a), we test whether the mean-variance efficient frontier of all domestic firms spans the frontier of all regional firms, and in (5b) and (5c) we do likewise for all trans-regional and global firms. We let h = R, T and G,and test the joint null hypothesis that h 0 and h 1 in each case. To ensure that our findings are robust to the choice of currency, we provide the results converted to the home currencies of each country. This is a novel test that we have not seen in prior research, and it is enabled by our classification of the degree of firm-level multinationality.
Accepted Manuscript
Moving from domestic to global firms, however, the results are more striking. The percentage increase in the Sharpe ratios varies from 29 percent when measured in Japanese yen to 160 percent when we use the Canadian dollar, with an average gain of 84 percent. Overall, therefore, this test confirms that when firms are combined across countries and classified by degree of multinationality, the most internationalised firms tend to provide the greatest diversification benefits to investors. We find that global firms provide the greatest increase in Sharpe ratios regardless of the currency in which we conduct the tests, and this is followed by regional and trans-regional firms, which are broadly similar.
Test 3: International diversification with home-based firms (HID)
In our third test, we examine the extent to which investors in each country can gain home-based international diversification (HID) benefits by investing in home-based internationalised (R, T and G) firms. Our ‘benchmark’ asset comprises the portfolio of all
home-based domestic (D) firms, and our extended ‘test’ assets are optimal portfolios of
home-based regional, trans-regional and global (R, T and G) firms. In our single country analysis in this and the next test, we combine the latter three categories because, as shown in Table 2, there are relatively few regional and global firms. We therefore conduct the following MVS tests equivalent to equation (3) as presented in equation (6), and we test the joint null hypothesis that i 0 and i 1 .
i t i
t , D i i i
t ,
HID α β R ε
R = + + (6)
Accepted Manuscript
percentage increase in the Sharpe ratios vary from 8 percent in Canada to 96 percent in Japan, with an average increase of 36 percent. Interestingly, the most internationalised firms are included in the optimal portfolios of HID in all countries. Our results confirm that there are statistically and economically significant benefits to HID in every country. They are greatest in the UK, the US, Italy and Japan, and they are smallest in Canada, Germany and France. Overall, the average HID across all countries of 36 percent – measured by the average percentage increase in the Sharpe ratios as we move from home-based domestic to home-home-based internationalised firms – is equal to one quarter of the 142 percent average increase in the Sharpe ratios as we move from home-based domestic to foreign-based internationalised firms. These findings shed light on one explanation for home bias – investors in each country can gain part of the total benefits available to international investment by investing in home-based internationalised firms.
Test 4: International diversification with foreign-based firms (FID)
In our fourth test, we examine the extent to which investors in each country can gain foreign-based international diversification (FID) benefits by investing in foreign-based firms with varying degrees of multinationality. The benchmark portfolios comprise all home-based domestic (D) firms in each country, and the test assets are: first, optimal portfolios of foreign-based domestic (D) firms; second, optimal portfolios of foreign-based internationalised (R, T, and G) firms; and third, optimal portfolios of all foreign-based firms (D, R, T and G). We consequently conduct three MVS tests equivalent to equation (3) as in equations (7a) – (7c),
D t i
t , D D D j
t ,
D α β R ε
R = + + (j ≠ i = 1…6) (7a)
RTG t i
t , D RTG RTG
j t ,
RTG α β R ε
R = + + (j ≠ i = 1…6) (7b)
DRTG t i
t D DRTG DRTG
j t
DRTG R
Accepted Manuscript
In these three sets of tests, we alternatively let h = D, RTG and DRTG,and we test the joint null hypothesis that h 0 and h 1 in each case. As before, we provide the results converted to the home currencies of each country to ensure that our findings are robust to the choice of currency.
The results are presented in Table 7. The Wald tests indicate that we reject spanning in all 21 cases. Furthermore, the step-down Wald tests of α = 0 and β = 1 indicate that both the tangency and the minimum variance portfolios of the extended sets are statistically different from the benchmark domestic firms in all cases. This is a strong result, confirming that when we perform a ‘clean’ test of the benefits of foreign-based firm-level diversification in which the benchmark portfolio comprises only home-based domestic firms, there are strongly significant statistical improvements in the mean-variance frontiers at all levels of risk. These differences are also economically significant. As we move from the benchmark home-based domestic firms to foreign-based domestic (D) firms, the Sharpe ratios rise by 148 percent on average, ranging from 37 percent for Canada to 247 for Japan. As we move from the same benchmark of home-based domestic firms to foreign-based internationalised (R, T and G) firms, the Sharpe ratios rise by similar amounts: 142 percent on average, ranging from 36 percent for Canada to 242 percent for Japan. Finally, when all foreign-based (D, R, T and G) firms form the extended set, the Sharpe ratios rise by 174 percent on average, ranging from 49 percent for France to 281 percent for Japan.
Accepted Manuscript
domestic firms – an increase in the Sharpe ratio relative to the purely domestic benchmark of 148 percent.
These findings are consistent with our correlation analysis (in section 3) that showed domestic firms in each country having the lowest correlation with foreign stock markets. This result can be illustrated with an example from Table 7, which shows that a United States investor has a Sharpe ratio of 2.83 on his/her portfolio of home-based domestic (D) firms. By extending this to include foreign-based domestic (D) firms, he/she can raise the Sharpe ratio by 223 percent to 9.14. By investing in an efficient portfolio of all foreign-based firms (D, R, T and G), the investor can increase his/her Sharpe ratio only by a further 1 percent, to 10.11. The reason why investing in all foreign-based firms yields such a small increment relative to investing only in foreign-based domestic (D) firms is that the foreign-based internationalised firms (R, T and G) are likely to have exposures back to the United States. Including foreign-based internationalised firms, therefore, does not yield substantially greater diversification benefits than those available from investing in foreign-based domestic firms.
Our finding that internationalising by investing in foreign-based domestic firms yields similar benefits to diversifying by investing in foreign-based internationalised firms was anticipated more than 30 years ago by Hughes, Logue & Sweeney (1975). ‘If international capital markets are perfectly integrated, if transactions costs are low, and if investors are rational and risk averse, then there are no diversification benefits inherent to multinational firms that could not be obtained by investors making direct portfolio investments in the countries in which the multinational firms would otherwise operate. That is, in the case of perfect financial market integration there is no systematic advantage to owning shares in a multinational firm versus holding shares in a number of
domestic firms in different countries.’ (1975: 628, our italics). Although there is
Accepted Manuscript
5 Robustness analysis
Reliance on sales and other accounting data to measure the degree of firm-level multinationality can be problematic insofar as firms use a variety of geographical groupings to describe their international operations. For example, many firms use the category ‘Other’ or ‘Rest of the World’ as a catch-all to locate their less important international operations, and the countries and regions within these catch-all categories vary from firm to firm. To overcome this, we have conducted all our tests using subsidiary data in addition to sales data, and the results are similar. In this section, we further address this potential bias by re-estimating using variations of our classification system.
Fama and French (1992) show that a firm’s relative size within the local market portfolio is a priced factor. Our sample firms are drawn from each country’s main stock market index, so they are the largest listed firms in each country. However, as average firm size can differ considerably between countries, we test the robustness of our findings to firm size. We next divide all firms into four broad industrial sectors and test the robustness of our results to industry effects. Lastly, we test whether the introduction of short sales constraints, whereby only positive quantities of any stock can be held, affects our results.
Classification of Firms
Accepted Manuscript
in all countries. We therefore conclude that our results are robust to our classification of firms, and that firms with greater global reach provide greater international diversification benefits.
Firm Size
We measure the size of each firm using 2005 sales figures in US dollars. The average size of the firms in our sample is $13,958 billions, and we segregate them into two categories – small (sales below average) and large (sales above average). Within each category, we replicate the MVS and Sharpe ratio tests of our second test, in which we use the domestic firms as the benchmark portfolio, and the regional, trans-regional and global firms as the extended sets. We continue to reject spanning in all tests. Once again, global firms in each size category provide the greatest benefits to diversification across all countries. This is followed by regional and trans-regional firms, confirming that our previous results are robust to firm size. It would be interesting to extend our sample to smaller firms, and this is a topic for further research.
Industry Effects
Accepted Manuscript
results are quite robust to industry effects, and as before, this is a future research project for an extended sample.
Short Sales Constraints
To introduce short selling constraints, we follow De Roon, Nijman and Werker (2001) by running the same regressions, but with inequality constraints5. The elimination of short sales does not significantly affect our results. We arrive at very similar conclusions in relation to the benefits from both HID and FID. We also find that when we combine all firms across all countries as in test 2, firms with global sales provide the best international diversification benefits.
6 Summary and conclusions
Although multinationality is a key dimension within the disciplines of international business, economics and finance, there is no widely accepted measure of the degree of firm-level multinationality. This has led to the use of a multiplicity of operational definitions that has hindered the ability of researchers to replicate and refine prior studies, and to draw definitive conclusions about what is known and what remains to be discovered. In this paper, we have shown how a more careful analysis of the degree of firm-level multinationality provides a new perspective and new insights on the home bias puzzle. Using a multi-country firm-level sample of 1,143 firms from the G7 countries, we classified the multinationality of their operations from the geographical spread of their sales and their subsidiaries. We used mean variance spanning and Sharpe ratio tests to show how firm-level multinationality provides diversification benefits to investors. We also showed how investors can obtain international diversification benefits by investing in home-based firms that have international operations.
Accepted Manuscript
regional, trans-regional and global. In a novel test, we showed that abstracting from country effects, firms with more global operations tend to provide more international diversification benefits. In our third test, we reintroduced country effects and showed how investors in each country can obtain international diversification without having to invest abroad. By investing in internationalised firms that are listed on the exchanges in their home countries, investors can ‘free ride’ some of the costs and risks associated with internationalisation at the level of the firm by reaping a portion of the benefits of international diversification directly from home-based internationalised firms. It follows that the ‘home-bias puzzle’ in international portfolio analysis is overstated.
In our final set of tests, we showed how investors can maximise their international diversification benefits by combining portfolios of home-based domestic firms with portfolios of foreign-based firms with differing degrees of international exposure. We showed that based domestic firms yield similar diversification benefits to foreign-based internationalised firms in all countries, and that most of the available diversification benefits can be obtained by combining home-based domestic firms with foreign-based domestic firms. Finally, we subjected all our firm-level tests to a set of robustness checks including variations in our firm-level classification system; classifying firms based on their subsidiaries as well as their sales; using alternative estimation strategies; controlling for size and industry effects; and allowing short sales constraints on portfolio optimisation.
Accepted Manuscript
References
Agmon, T., & Lessard, D. 1977. Investor recognition of corporate international diversification. Journal of Finance, 32(4): 1049-1055.
Aherne, A. G., Griever, W. L., & Warnock, F. E. 2004. Information costs and home bias: an analysis of US holdings of foreign equities. Journal of International Economics,
62(2): 313-336.
Allen, L., & Pantzalis, C. 1996. Valuation of the operating flexibility of multinational corporations. Journal of International Business Studies, 27(4): 633-698.
Annavarjula, M., & Beldona, S. 2000. Multinationality performance relationship: a review and reconceptualisation. International Journal of Organizational Analysis, 8(1): 48-67.
Aurelio, M.M. 2006. Going global: the changing pattern of US investment abroad.
Federal Reserve Bank of Kansas Economic Review, Third Quarter: 5-33.
Barberis, N., & Thaler, R. H. 2003. A survey of behavioural finance. In Constantinides, M. H., & Stulz, R. (Eds), Handbook of Economics of Finance, Elsevier Science.
Baxter, M., & Jermann J. J. 1997. The international diversification puzzle is worse than you think. American Economic Review, 8(1): 170-180.
Bekaert, G., & Urias, M. 1996. Diversification, integration and emerging market closed-end funds. Journal of Finance, 51(3): 835-869.
Berry, H. 2006. Shareholder valuation of foreign investment and expansion. Strategic Management Journal, 27: 1123-1140.
Brouthers, L., Werner, S., & Matulich, E. 2000. The influence of triad nations' environments on price-quality product strategies and MNE performance. Journal of International Business Studies, 31(1): 39-62.
Brewer, H. L. 1981. Investor benefits from corporate international diversification.
Journal of Financial and Quantitative Analysis, 16(1): 113-126.
Accepted Manuscript
De Roon, F., & Nijman, T. 2001. Testing for MVS: a survey. Journal of Empirical Finance, 8: 111-156.
DeRoon, F., Nijman, T., & Werker, B. 2001. Testing for MVS with short sales constraints and transactions costs: the case of emerging markets. Journal of Finance,
56(2): 721-742.
Douglas, S., & Craig, C. 1983. Examining performance of US multinationals in foreign markets. Journal of International Business Studies, 14(3): 51-62.
Doukas, J. A., & Lang, L. H. P. 2003. Foreign direct investment, diversification and firm value. Journal of International Business Studies, 34(2): 153-172.
Dun and Bradstreet 2005/06. Who owns whom? London: Dun & Bradstreet International. Dunning, J. 1980. Toward an eclectic theory of international production: some empirical tests. Journal of International Business Studies, 11(1): 9-31.
Dunning, J. 1988. The eclectic paradigm of international production: a restatement and some possible extensions. Journal of International Business Studies, 19(1): 1-32.
Errunza, V. R., & Senbet, L. W. 1981. The effects of international operations on the market value of the firm: theory and evidence. The Journal of Finance, 36(2): 401-417. Errunza, V. R., & Senbet, L. W. 1984. International corporate diversification, market valuation and size-adjusted evidence. The Journal of Finance, 39(3): 727-745.
Errunza, V. R., Hogan, K., & Hung, M. W. 1999. Can the gains from international diversification be achieved without trading abroad? Journal of Finance, 54(6): 2075-2107.
Fama, E. F., & French, K.R. 1992. The cross-section of expected stock returns. Journal of Finance, 47 (2): 427–465.
Fatemi, A. 1984. Shareholder benefits from corporate international diversification.
Journal of Finance, 39(5): 1325-1344.
Fidora, M., Fratzscher, M., & Thimann, C. 2007. Home bias in global bond and equity markets: the role of real exchange rate volatility. Journal of International Money and Finance, 26(4): 631-655.
French, K. 2008. The cost of active investing. http://ssrn.com/abstract=1105775.
Accepted Manuscript
Grant, R. 1987. Multinationality and performance among British manufacturing companies. Journal of International Business Studies, 18(3): 79-90.
Hasan, I., & Simaan, Y. 2000. A rational explanation for home country bias. Journal of International Money and Finance, 19(3): 331-361.
Huberman, G., & Kandel, S. 1987. Mean-variance spanning. Journal of Finance, 42(4): 873-888.
Hughes, J., Logue, D., & Sweeney, R. 1975. Corporate international diversification and market assigned measures of risk and diversification. Journal of Financial and Quantitative Analysis, 10(4): 627-637.
Jacquillat, B., & Solnik, B. 1978. Multinationals are poor tools for diversification.
Journal of Portfolio Management, 4(2): 8-12.
Johanson J., & Vahlne, J. 1977. The internationalization process of the firm: a model of knowledge development and increasing foreign market commitments. Journal of International Business Studies, 8(1): 23-32.
Jobson, J. D., & Korkie, D. 1989. A performance interpretation of multivariate tests of asset set intersection, spanning and mean variance efficiency. Journal of Financial and Quantitative Analysis, 24: 185-204.
Kan, R., & Zhou, G. 2001. Tests of MVS. Unpublished Working Paper.
Karolyi, G. A., & Stulz, R. M. 2002. Are financial assets priced locally or globally?
National Bureau of Economic Research Working Paper No. 8992.
Kim, W. S., & Lyn, E. O. 1990. FDI theories and performance of foreign multinationals operating in the US. Journal of International Business Studies, 21(1): 41-54.
Kogut, B., & Zander, U. 1993. Knowledge of the firm and the evolutionary theory of the multinational corporation. Journal of International Business Studies, 24: 625-645.
Kotabe, M., Srinivasan, S., & Aulakh, P. 2002. Multinationality and firm performance: the moderating role of R&D and marketing capabilities. Journal of International Business Studies, 33(1): 79-97.
Kuhn, T. 1962. The structure of scientific revolutions. University of Chicago Press, Chicago.
Lecraw, D. 1983. Performance of transnational corporations in less developed countries.
Accepted Manuscript
Lewis, K. K. 1999. Trying to explain home bias in equities and consumption. Journal of Economic Literature, 37: 571-608.
Li, L. 2007. Multinationality and performance: a synthetic review and research agenda.
International Journal of Management Reviews, 9(2): 117-139.
Logue, D. 1982. An experiment in international diversification. Journal of Portfolio Management, 9(1): 22-27.
Majocchi, A., & Zuchella, A. 2003. Internationalisation and performance: findings from a set of Italian SMEs. Small Business Journal, 21(3): 249-268.
Mathur, I., Singh, M., & Gleason, K. 2001. The evidence from Canadian firms on multinational diversification and performance. Quarterly Review of Economics and Finance, 41(4): 561-578.
Michel, A., & Shaked, I. 1986. Multinational corporations versus domestic corporations: financial performance and characteristics. Journal of International Business Studies,
17(3): 89-100.
Mikhail, A., & Shawky, H. 1979. Investment performance of US based multinational corporations. Journal of International Business Studies, 10(1): 53-66.
Mishra, C., & Gobeli, D. 1998. Managerial incentives, internalization, and market valuation of multinational firms. Journal of International Business Studies, 29(3): 583-597.
Osegowitsch, T., & Sammartino, A. 2008. Reassessing (home-) regionalisation. Journal of International Business Studies, 39(2): 184-196.
Oviatt, B. M., & McDougall, P. P. 1994. Toward a theory of international new ventures.
Journal of International Business Studies, 25(1): 45–64.
Pantzalis, C. 2001. Does location matter? an empirical analysis of geographic scope and MNE market valuation. Journal of International Business Studies, 32(1): 133-155.
Portes, R., & Rey, H. 2005. The determinants of cross-border equity flows. Journal of International Economics, 65(2): 269-296.
Popper, K. 1978. Conjectures and refutations. Routledge & Kegan Paul, London.
Accepted Manuscript
Rugman, A., & Verbeke, A. 2007. Liabilities of regional foreignness and the use of firm-level versus country-firm-level data: a response to Dunning et al. (2007). Journal of International Business Studies, 38(1): 200-205.
Rugman, A., & Verbeke, A. 2008. The theory and practice of regional strategy: a response to Osegowitsch and Sammartino. Journal of International Business Studies, 39(2): 326-332.
Salehizadeh, M. 2003. U.S. Multinationals and the home bias puzzle: an empirical analysis. Global Finance Journal, 14(3): 303-318.
Senchack, A., & Beedles, W. 1980. Is indirect international diversification desirable?
Journal of Portfolio Management, 6(2): 49-57.
Sharpe, W. F. 1966. Mutual fund performance. Journal of Business, Supplement 1, Part 2: 119-138.
Tesar, L. L., & Werner, I. M. 1995. Home bias and high turnover. Journal of International Money and Finance, 14(4): 467–492.
Tobin, J. 1958. Liquidity preference as behaviour towards risk. Review of Economic Studies, 25(2): 65-86.
Accepted Manuscript
Table 1
Classifying firm-level internationalisation
Symbol MNE type
Purely domestic firm
1 TD-ID Domestic trading, domestic investments
Regional and trans-regional firms
2 TR-ID Regional trading, domestic investments 3 TT-ID Trans-regional trading, domestic investments 4 TD-IR Domestic trading, regional investments 5 TR-IR Regional trading, regional investments 6 TT-IR Trans-regional trading, regional investments 7 TD-IT Domestic trading, trans-regional investments 8 TR-IT Regional trading, trans-regional investments 9 TT-IT Trans-regional trading, trans-regional investments
Global firms
10 TG-ID Global trading, domestic investments 11 TG-IR Global trading, regional investments 12 TG-IT Global trading, trans-regional investments 13 TD-IG Domestic trading, global investments 14 TR-IG Regional trading, global investments 15 TT-IG Trans-regional trading, global investments 16 TG-IG Global trading, global investments
Notes. The Table describes 16 types of MNE, ranging from a purely domestic firm to a fully global corporation. It describes two depths of engagement, trading (T) and investments (I). By combining the three ‘within-region’ decompositions (R1, R2
Accepted Manuscript
Table 2
International Classification of Firms
Canada France Germany Italy Japan UK US Sum
D 13 (23) 6 (6) 5 (5) 46 (30) 16 (9) 7 (8) 136 (29) 229 (20)
R 7 (12) 8 (7) 3 (3) 7 (5) 5 (6) 10 (2) 40 (4)
T 37 (65) 87 (81) 84 (85) 90 (59) 152 (91) 71 (78) 314 (67) 835 (73)
G 6 (6) 7 (7) 9 (6) 7 (8) 10 (2) 39 (3)
Total 57 107 99 152 168 90 470 1,143
Accepted Manuscript
Table 3Correlation Structures
[1] [2] [3] [4] [5]
Market D R T G
Canada 0.362 0.185 0.190 0.341
France 0.608 0.194 0.203 0.586 0.486 Germany 0.583 0.237 0.574 0.451 Italy 0.504 0.383 0.491 0.528 0.359 Japan 0.202 0.132 0.220
UK 0.536 0.331 0.362 0.498 0.341 US 0.347 0.270 0.228 0.341 0.296 Average 0.449 0.247 0.295 0.441 0.387
Accepted Manuscript
Table 4
Conventional tests of the benefits of international diversification
Canada France Germany Italy Japan UK US
Wald 564.74
(0.00)
1241.20
(0.00)
1226.08
(0.00)
555.69
(0.00)
674.52
(0.00)
260.36
(0.00)
542.98
(0.00)
α = 0 2.06
(0.15)
6.55
(0.01)
7.41
(0.01)
5.33
(0.02)
8.40
(0.00)
10.28
(0.00)
9.45
(0.00)
β = 1 1126.90
(0.00)
2469.66
(0.00)
2437.71
(0.00)
1103.90
(0.00)
1336.18
(0.00)
508.23
(0.00)
1072.43
(0.00)
SR Benchmark 4.047 2.896 1.698 3.274 3.570 1.680 1.587
SR Extended Set 4.602 5.613 5.400 5.541 7.306 5.752 6.168
SR Change 0.555 2.717 3.702 2.267 3.736 4.072 4.580
SR Change (%) 13.72 93.81 218.07 69.25 104.64 242.44 288.54
Accepted Manuscript
Table 5Diversification benefits of internationalised firms
Canadian
Dollar Euro
Japanese Yen
UK Pound
US Dollar
Regional (R) firms
Wald 66.83 43.27 22.49 41.55 79866.77
(0.00) (0.00) (0.00) (0.00) (0.00)
α = 0 0.18 0.15 0.13 0.16 0.07
(0.67) (0.70) (0.72) (0.69) (0.79)
β = 1 133.52 86.42 44.87 82.98 72.90
(0.00) (0.00) (0.00) (0.00) (0.00)
SR benchmark 1.174 2.184 3.898 1.647 3.099
SR test 1.637 2.395 3.972 1.969 3.190
SR change 0.463 0.211 0.074 0.321 0.091
SR change (%) 39.47 9.67 1.91 19.51 2.92
Trans-regional (T) firms
Wald 95.01 53.20 60.38 61.67 77266.38
(0.00) (0.00) (0.00) (0.00) (0.00)
α = 0 0.092 0.06 0.02 0.05 0.003
(0.76) (0.81) (0.89) (0.82) (0.95)
β = 1 190.00 106.39 120.78 123.34 151.20
(0.00) (0.00) (0.00)
(0.00)
(0.00)
SR benchmark 1.174 2.184 3.898 1.647 3.099
SR test 1.500 2.287 3.910 1.820 3.123
SR change 0.326 0.103 0.012 0.172 0.024
SR change (%) 27.76 4.710 0.310 10.45 0.790
Global (G) firms
Wald 99.78 105.09 42.62 94.17 104854.6
(0.00) (0.00) (0.00) (0.00) (0.00)
α = 0 2.14 2.74 2.28 2.66 2.65
(0.14) (0.10) (0.13) (0.10) (0.10)
β = 1 197.32 207.29 82.91 185.54 129.75
(0.00) (0.00) (0.00) (0.00) (0.00)
SR benchmark 1.174 2.184 3.898 1.647 3.099
SR test 3.048 3.942 5.044 3.522 4.471
SR change 1.874 1.758 1.146 1.875 1.372
SR change (%) 159.59 80.5 29.4 113.82 44.26
Accepted Manuscript
Table 6
The benefits of home-based international diversification
Canada France Germany Italy Japan UK US
Wald 439.50 718.08 2289.54 289.78 274.02 472.01 1.07
(0.00) (0.00) (0.00) (0.00) (0.00) (0.00) (0.34)
α = 0 1.93 5.11 1.46 1.37 1.25 4.15 0.72
(0.17) (0.02) (0.23) (0.24) (0.26) (0.04) (0.40)
β = 1 876.70 1428.39 4576.65 578.10 546.74 938.54 1.42
(0.00) (0.00) (0.00) (0.00) (0.00) (0.00) (0.23)
SR benchmark 5.762 6.597 3.778 3.774 2.809 4.115 2.828
SR test 6.231 7.935 4.393 5.193 3.662 8.085 4.090
SR change 0.469 1.338 0.615 1.419 0.854 3.970 1.262
SR change (%) 8.14 20.29 16.28 37.62 30.39 96.45 44.61
Accepted Manuscript
Table 7
The benefits of foreign-based international diversification
Canada France Germany Italy Japan UK US
Foreign-based domestic firms (D)
Wald 529.56
(0.00) 943.55 (0.00) 6193.66 (0.00) 1013.28 (0.00) 1276.88 (0.00) 2368.91 (0.00) 820.89 (0.00)
α = 0 8.11
(0.00) 10.88 (0.00) 18.96 (0.00) 18.33 (0.00) 19.47 (0.00) 18.73 (0.00) 19.76 (0.00)
β = 1 1047.63
(0.00) 1867.90 (0.00) 12268.86 (0.00) 1992.64 (0.00) 2513.31 (0.00) 4681.64 (0.00) 87.15 (0.00)
SR benchmark 5.762 6.597 3.778 3.774 2.809 4.115 2.828
SR test 7.916 9.184 9.217 9.255 9.755 12.321 9.144
SR change 2.154 2.587 5.439 5.482 6.946 8.205 6.316
SR percentage 37.38 39.22 143.96 145.26 247.31 199.38 223.34
Foreign-based internationalised firms (RTG)
Wald 837.25
(0.00) 941.17 (0.00) 6116.66 (0.00) 1025.62 (0.00) 1508.29 (0.00) 2243.01 (0.00) 997.55 (0.00)
α = 0 8.30
(0.00) 10.12 (0.00) 17.78 (0.00) 14.75 (0.00) 18.90 (0.00) 19.81 (0.00) 19.03 (0.00)
β = 1 1660.72
(0.00) 1864.53 (0.00) 12123.68 (0.00) 2023.92 (0.00) 2973.62 (0.00) 4428.62 (0.00) 1960.11 (0.00)
SR benchmark 5.762 6.597 3.778 3.774 2.809 4.115 2.828
SR test 7.850 9.013 8.956 8.404 9.618 12.613 8.902
SR change 2.088 2.417 5.178 4.630 6.809 8.498 6.074
SR percentage 36.23 36.64 137.05 122.7 242.44 206.48 214.79
Foreign-based domestic and internationalised (DRTG)
Wald 969.47
(0.00) 1195.83 (0.00) 8232.22 (0.00) 1428.77 (0.00) 1671.55 (0.00) 2878.38 (0.00) 1143.34 (0.00)
α = 0 11.92
(0.00) 13.31 (0.00) 24.99 (0.00) 23.23 (0.00) 23.64 (0.00) 24.45 (0.00) 24.81 (0.00)
β = 1 1917.57
(0.00) 2365.20 (0.00) 16263.30 (0.00) 2806.14 (0.00) 3285.85 (0.00) 5672.25 (0.00) 2237.81 (0.00)
SR benchmark 5.762 6.597 3.778 3.774 2.809 4.115 2.828
SR test 8.800 9.805 10.399 10.206 10.690 13.617 10.105
SR change 3.038 3.208 6.620 6.433 7.881 9.502 7.277
SR percentage 52.72 48.64 175.23 170.47 280.61 230.89 257.34
Accepted Manuscript
Appendix
Derivation of the mean variance spanning tests
To construct our MVS tests, we follow Huberman and Kandel (1987), De Roon and Nijman (2001) and Kan and Zhou (2001) by considering a set of K benchmark assets and
N test assets and investigate whether, conditional on the K benchmark assets, the addition of the N test assets can shift the mean variance efficient frontier. Alternatively, conditional on the K+N benchmark and test assets, can the subset of K benchmark assets yield the same diversification benefits? In common parlance, we are interested in whether the K benchmark assets span the extended set of K+N assets. We begin by defining R1,t as the K×1 vector of returns on the K benchmark assets at time t, we define
t
R2, as the N×1 returns on the N test assets at time t, and we combine R1,t and R2,t in the
K+N vector Rt [R1',t,R2',t]'. The expected returns E[Rt]and the variances Var[Rt]on
these K+N assets can be written as
2 1 ]
[
t
R
E
22 21
12 11 ]
[
V V
V V V R
Var t (A1)
The MVS test proceeds by estimating the following model, which regresses the N test asset returns on the K benchmark asset returns,
t t
t R
R2, 1, (A2)
with t~ N(0,), E
R2,t E
R1,t 2 1and V21V111.Accepted Manuscript
To derive the form of the MVS test, we rewrite equation (A2) in matrix notation as
X
R (A3)
with the unconstrained maximum likelihood estimates of β and Σ being determined as usual by
X'X
X'R
ˆ 1
and ˆ 1
R Xˆ
' R Xˆ
T
(A4)
To derive the tests of spanning and to facilitate their geometric presentation, we define
T t t T R 1 ˆ and
T t t t R R V 1 ' ˆ ˆ
ˆ , and we define three constants a, b, c and d
that are important determinants of the location and shape of the efficient frontier. We do this for the efficient frontiers with K and with K+N assets. For K assets, we have
K K
K V
aˆ ˆ ˆ111ˆ '
,
bˆK ˆKVˆ 1K1 11 '
,
cˆK 1ˆKVˆ 1K1 11 '
and dˆK aˆKcˆK bˆK2 . The equivalent
for K+N assets is aˆKN ˆK' NVˆ1ˆKN, bK N K NV KN
ˆ ˆ 1
ˆ ' 1
, cˆKN 1ˆ'KNVˆ11KN and
2 ˆ ˆ ˆ ˆ N K N K N K N
K a c b
d . As we move from the frontier with K benchmark assets to the more general frontier with K+N assets, these constants will change by aˆaˆKN aˆK,
K N
K b
b
bˆ ˆ ˆ
and cˆcˆKN cˆK. We can now form the following two matrices, the
latter of which is termed the marginal information matrix (see Jobson and Korkie (1989)).
K K K K c b b a G ˆ ˆ ˆ ˆ 1
ˆ and
c b b a H ˆ ˆ ˆ ˆ ˆ
(A5)
Accepted Manuscript
1 ~ ˆ
U , the likelihood ratio test of whether the K benchmark assets span the K+N
benchmark and test