Received 11 January 2016 Accepted 13 April 2016
Edited by A. R. Pearson, Universita¨t Hamburg, Germany
Keywords:macromolecular crystallography; fast grid scans; oscillation images; scanning transmission X-ray microscopy; visualization of protein crystals.
Fast two-dimensional grid and transmission X-ray
microscopy scanning methods for visualizing and
characterizing protein crystals
Justyna Aleksandra Wojdyla,aEzequiel Panepucci,aIsabelle Martiel,aSimon Ebner,a Chia-Ying Huang,bMartin Caffrey,bOliver Bunkaand Meitian Wanga*
aSwiss Light Source, Paul Scherrer Institute, 5232 Villigen PSI, Switzerland, andbMembrane Structural and Functional Biology Group, School of Medicine and School of Biochemistry and Immunology, Trinity College Dublin, Dublin 2, Ireland. *Correspondence e-mail: [email protected]
A fast continuous grid scan protocol has been incorporated into the Swiss Light Source (SLS) data acquisition and analysis software suite on the macro-molecular crystallography (MX) beamlines. Its combination with fast readout single-photon counting hybrid pixel array detectors (PILATUS and EIGER) allows for diffraction-based identification of crystal diffraction hotspots and the location and centering of membrane protein microcrystals in the lipid cubic phase (LCP) in in meso in situserial crystallography plates and silicon nitride supports. Diffraction-based continuous grid scans with both still and oscillation images are supported. Examples that include a grid scan of a large (50 nl) LCP bolus and analysis of the resulting diffraction images are presented. Scanning transmission X-ray microscopy (STXM) complements and benefits from fast grid scanning. STXM has been demonstrated at the SLS beamline X06SA for near-zero-dose detection of protein crystals mounted on different types of sample supports at room and cryogenic temperatures. Flash-cooled crystals in nylon loops were successfully identified in differential and integrated phase images. Crystals of just 10mm thickness were visible in integrated phase images using data collected with the EIGER detector. STXM offers a truly low-dose method for locating crystals on solid supports prior to diffraction data collection at both synchrotron microfocusing and free-electron laser X-ray facilities.
1. Introduction
The development of third-generation low-emittance X-ray sources and advances in X-ray optics have made single-digit micrometre-sized beams available for macromolecular crys-tallography (MX) at synchrotron beamlines worldwide (Smith
et al., 2012). Micrometre-sized X-ray beams have enabled MX with crystals as small as a few micrometres in their maximum dimension (Coulibaly et al., 2007) and the location of small volumes in larger crystals with the best diffraction (Bowleret al., 2010). The accurate centering of a micrometre-sized crystal in a micrometre-sized X-ray beam by visible-light microscopy, even with the aid of a high-resolution on-axis camera, is challenging owing to parallax, and borders on the impossible for many membrane protein crystals grown in and harvested from the lipid cubic phase (LCP) because of its frequent opacity at cryogenic temperatures (Caffreyet al., 2012). In the latter case, the X-ray-diffraction-based grid scan (often referred to as rastering) proved to be indispensable for the structure determination of G protein-coupled receptors (Cherezovet al., 2009). In a standard discrete grid scan a loop containing crystals is divided into a two-dimensional grid with a cell size matching that of the X-ray beam. A series of
diffraction images (still or oscillation) are then taken from each cell as it is translated into the X-ray beam center in a discrete stepwise manner. Subsequently diffraction images are analyzed automatically (Zhang et al., 2006) and the results represented graphically as a heat map for the rapid location of diffracting crystals. However, with typical loop sizes of 100– 200mm discrete grid scanning using a micrometre-sized X-ray beam is a time-consuming process. This becomes particularly burdensome when a large number of loops must be screened, as is the case in most structural biology projects. The intro-duction of the hybrid pixel array PILATUS 6M detector (Henrichet al., 2009) has enabled continuous and shutterless data acquisition in MX. With a short readout time of 2.3 ms for the 6M detector (1 ms for the PILATUS3 model; http:// www.dectris.com) it has been possible to implement two-dimensional continuous grid scanning with still diffraction images, where the sample is translated without rotation across the X-ray beam while the PILATUS detector acquires data continuously (Aishimaet al., 2010; Evanset al., 2011; Svensson
et al., 2015). Two-dimensional continuous grid scanning is significantly faster than discrete stepwise scanning. However, the still diffraction images collected in this mode may provide less information than oscillation images.
Improvements in X-ray optics resulting in smaller beam sizes and higher intensity allow measurements on increasingly smaller protein crystals. As a consequence, radiation damage quickly limits data collection and impedes structure determi-nation (Holton, 2009; Holton & Frankel, 2010). Even though diffraction-based grid scanning experiments lead to orders-of-magnitude lower accumulated dose than during the collection of a standard full dataset, there still exists a need for alter-native low-dose imaging methods to localize crystals. The need is particularly apparent for (i) room-temperature data collection; (ii) micrometre-sized crystals with which only partial datasets can be recorded and where a single grid scan exposure represents a significant portion of the total tolerable radiation dose; (iii) the pre-location of crystals on solid supports for use in free-electron laser experiments. Second-order nonlinear imaging of chiral crystals (SONICC) is an optical method used for visualizing protein crystals in crys-tallization trays before mounting on the X-ray beamline (Kissicket al., 2010) or in-line (Maddenet al., 2013). SONICC selectively detects noncentrosymmetric crystals. Unfortu-nately, it is not sensitive to crystals in certain space groups and it cannot discriminate between crystals of proteins and other chiral molecules that may be present in the crystallization drop (Haupert & Simpson, 2011). The application of X-ray microradiography and microtomography to the visualization and location of crystals in opaque media has been demon-strated previously (Brockhauser et al., 2008; Warren et al., 2013). However, X-ray microradiography requires a specia-lized experimental configuration, typically a large defocused X-ray beam in both vertical and horizontal directions to cover the entire sample and a high-resolution X-ray detector that includes a scintillator, a mirror on a translation stage and a CCD detector. Radiography only works when there is suffi-cient X-ray absorption contrast. This, in turn, requires delivery
of a significant radiation dose to the sample. In contrast to this full-field imaging approach, scanning transmission X-ray microscopy (STXM) is a method in which an X-ray microbeam is scanned over the sample and the intensity of the transmitted beam is recorded as a function of sample position. Sophisticated detection schemes, such as differential phase contrast (DPC) and dark-field imaging, provide additional contrast modes and supplementary information about the sample. Importantly, they do not depend on delivering a high potentially damaging X-ray dose to the sample as they are based on refraction and elastic scattering (Bunket al., 2009; Thibaultet al., 2009; Menzelet al., 2010).
In STXM experiments, typically a monochromatic X-ray beam is focused on the sample using a Fresnel zone plate with a pinhole blocking higher diffraction orders and a central spot blocking the unfocused beam. Data are collected by moving the sample stepwise through the X-ray beam and measuring the transmitted photon flux at each position in the area scanned (Bunket al., 2009; Thibault et al., 2009). The trans-mission is obtained by integrating photon counts over the detector area on which the direct beam impinges. The image so obtained is in essence an X-ray radiograph, which amounts to a shadow image of the sample. As the X-rays pass through the sample they also undergo refraction. This changes the direction of the transmitted X-ray beam slightly, usually in the microradians range. With typically employed pixelated detectors and sample-to-detector distances, the shift in the position of the transmitted beam on the detector is well below the size of a detector pixel. Nevertheless, it can be reliably detected if several pixels are illuminated and the beam center is calculated, for example using the center of mass of the intensity pattern. The refraction signal recorded in this way yields DPC images in both horizontal and vertical directions. A key advantage of STXM is that it does not require addi-tional optical elements in the beam path between sample and detector. It can be performed at a non-dedicated setup such as the Swiss Light Source (SLS) MX beamlines by simple beam conditioning and a repositioning of the detector and beam-stop, procedures that can be easily automated.
2. Methods
2.1. Beamline setup
The MX beamline X06SA at the SLS uses a right-handed coordinate system with thezaxis (GMZ in Fig. 1a) along the X-ray beam direction, theyaxis (GMY) pointing up and the!
rotation clockwise around the x axis (GMX). The D3 diffractometer (Fuchset al., 2014) implements a sample posi-tioning system with a stack of three linear translation stages (Aerotech models ALS25020, ATS20010 and AVSI125 as GMX, GMY and GMZ, respectively; unidirectional repeat-ability of less than 1mm) and an air-bearing spindle for the!
rotation (Aerotech ABRT 200; unidirectional repeatability of 0.500). A sample head consisting of two orthogonally mounted linear stages (SmarAct model SLC-1720-S as STY and STZ; 0.001mm resolution), which support the sample magnet, is used to bring the region of interest of the sample onto rotation axis !. Axes GMX, GMY, GMZ and ! are driven by an Aerotech A3200 controller supporting synchronized motions, while axes STY and STZ are driven by SLS standard motor drivers controlled via EPICS (Experimental Physics and Industrial Control System), which in the current configuration are not capable of synchronized motions. The focal spot size (FWHM) at beamline X06SA is 8510mm [horizontal (h)
vertical (v)] with the one-stage focusing mode and 101mm (hv) with the two-stage focusing mode (to be published). At a wavelength of 1 A˚ (12.4 keV) beamline X06SA delivers an X-ray flux of 21012photons s1. Diffraction images were collected with a PILATUS 6M-F (Henrichet al., 2009) or an EIGER 16M (Dinapoliet al., 2011; Tinti et al., 2015)
single-photon counting hybrid pixel area detector (Dectris Ltd, Baden, Switzerland).
2.2. Implementation of grid scan motions
The grid scan protocol is available at all three MX beam-lines at the SLS. During a scan, sample movement is performed and controlled with the D3 diffractometer, as described above (Fig. 1a). Apart from a multi-line two-dimensional grid scan and single-line vertical and horizontal scans with still diffraction images, a unique feature of the system in place at the SLS is that it enables single- and multi-row grid scans to be performed synchronously with sample oscillation. The short readout time of the PILATUS and EIGER detectors provides continuous shutterless data acquisition while the sample is being translated along a row or column in the grid.
[image:3.610.45.566.450.704.2]2.2.1. Position synchronized triggering. A position synchronized output circuit within the motion controller issues a transistor–transistor logic (TTL) signal within prepro-grammed regions (start of a row/column) of the GMX or the GMY axis. The TTL signal is split and sent to both the shutter controller and the detector. The triggering of the detector used to record the diffraction images depends on whether a PILATUS or an EIGER detector is being used. The EIGER detector can be configured to collectnseries, each consisting ofmimages (i.e. n rows bymcolumns), where each series is triggered by one external TTL signal. The PILATUS detector is configured to collect m n images (extmtrig camserver command), each requiring an external trigger, which is
Figure 1
delivered by a digital delay generator (Stanford Research Systems DG645). The DG645 is configured to replicate the incoming trigger from the motion controller into a sequence of
mtriggers along each row of the grid scan.
2.2.2. Continuous grid scan with oscillation. During the ‘grid scan with oscillation’ (Fig. 1b) the GMX and!axes are synchronizedviaa camtable with GMX as the master motor. The camtable is an array ofnelements where each element is a pair of motor positions (GMX,!) calculated to allow for!
oscillation simultaneously with the GMX movement along a row (the ! axis is parallel to the GMX axis; Fig. 1c). The sequence of events required for such a scan is as follows: (i) the sample head is positioned so that the first cell of the grid is centered on the beam position and the first row is aligned along the ! rotation axis; (ii) the motion controller moves GMX to the first position of the camtable (IP in Fig. 1b) and subsequently engages the GMX and the ! axes (from this point on all GMX motion will result in a synchronized !
motion); (iii) a linear move command is given on the GMX axis to reach the last position in the camtable (FP in Fig. 1b), and this will effectively move the sample across the beam in order to scan the first row while the!axis oscillates according to the camtable; (iv) after the movement is finished, the sample head moves the sample to align the next row on the!
rotation axis and the motion controller waits for a ‘start-next-row’ command; (v) the ‘start-next-‘start-next-row’ command is given by the data acquisition server to start another linear movement in the reverse direction towards the initial position. This proce-dure is repeated for as many rows as requested by the user.
2.2.3. Continuous grid scan without oscillation. In the ‘continuous grid scan without oscillation’ the procedure is the same as in the case of grid scan with oscillation (up to step iii) except for the camtable synchronization steps. The procedure continues as follows: (iv) instead of the sample head (as in ‘scan with oscillation’), the GMY axis moves the sample vertically to the next row with minimum delay; (v) the command for linear movement of GMX towards the initial position is issued. This procedure is repeated for as many rows as requested by the user. Similarly, for the vertical line scan without oscillation movements are accomplished with the GMY translation stage.
2.3. Computational setup
The data acquisition and analysis software (DA+) includes components written in Python and Java which communicate
viaa messaging broker and deliver diffraction images through distributed messaging (to be published). The major compo-nents ofDA+are the graphical user interface (GUI) based on the Java Eclipse rich client platform, which provides for user-friendly management of data collection with both standard and advanced protocols, theDA+server, which controls the workflow and interacts with the distributed real-time hard-ware control system EPICS, and the online analysis softhard-ware for processing of grid scan images. DA+ is deployed at all three MX beamlines (X06SA, X06DA, X10SA) at the SLS. Each MX beamline is equipped with a dedicated computing
cluster enabling fast processing of data stored on a GPFS file server. For the computation-intensive diffraction-based grid scan experiments an additional cluster (referred to as the raster cluster) has been installed, consisting of three 24-core nodes, each with 2.70 GHz CPUs and 256 GB RAM.
2.4. Processing of grid scan data
When a grid scan data collection session is started, multiple processes running in the raster cluster receive compressed images collected by the detector as ZeroMQ messages (via
PUSH/PULL; http://zeromq.org), decompress the messages and immediately analyze them, whilst in memory, using routines from the labelit.distl package (Zhang et al., 2006). Results are reported back to theDA+GUIviathe messaging broker and are displayed in the GUI. Albula software (Dectris) displays selected diffraction images during data collection and enables interactive inspection of specific diffraction images based on the results of the evaluation.
2.5. Grid scan in theDA+GUI
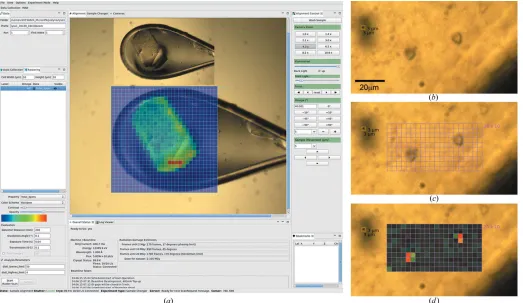
The data collection window in the DA+ GUI includes a rastering tab where data acquisition parameters such as detector distance, oscillation angle, exposure time and X-ray transmission are defined (Fig. 2a). A rectangular grid scan area is defined and overlaid on the in-line camera view of the sample by mouse click-and-drag procedures. In the standard setup, the grid cell width and height correspond to those of the beam. During data collection, images are displayed in the
Albula Viewerand saved in a location with a unique folder name specified by the user. By default, images are ranked on the basis of the number of Bragg peak candidates in each grid cell as evaluated byDISTLand are displayed in the camera view as a heat map superimposed on the original image. The ranking property can be changed in the drop-down menu, as can other analysis parameters, such as high- and low-resolu-tion limits. Moreover, the user can modify the color scheme, contrast and opacity of the displayed heat map.
2.6. Grid scan experiments
Grid scan experiments were carried out with the two-stage focusing setup at beamline X06SA using a PILATUS 6M-F detector. To obtain a horizontal beam size smaller than 10mm at the sample position, the beam was reduced with slits at the position of the intermediate focus. In the vertical direction a beam larger than 2mm at the sample position was achieved by moving the focal point downstream with the vertically focusing mirror. A 1010mm beam with a flux of 5.81010 and 8.21011photons s1was used in the experiments shown in Figs. 2(a) and 3, respectively. A 33mm beam with a flux of 8 1010photons s1 was used in the experiment shown in Fig. 2(b).
2.7. STXM
directions. Subsequently, the beam size was reduced with slits to 1010mm (experiment shown in Fig. 4). In the case of the two-stage focusing setup, the beam was focused on the sample to the desired size of 1010, 36 or 33mm (experiments shown in Fig. 5). Both approaches yielded a uniform, well
defined beam profile suitable for STXM experiments. To enable measurement of the transmitted intensity at each grid point the beamstop was moved out of the direct X-ray beam. The detector (either PILATUS 6M-F or EIGER 16M) was moved to a distance of 1200 mm from the sample to achieve high sensitivity to changes in the direction of the X-ray beam due to its refraction by the sample. The measurements were performed at very low incident intensity below a global count rate of 6 106 photons per second and per pixel for the transmitted beam, which corresponds to about 300 Gy s1for a 33mm beam (Holton, 2009). STXM data were processed with in-house MATLAB (The MathWorks Inc., Natick, MA, USA) routines to obtain transmission and DPC images of the measured samples (Bunket al., 2009).
2.8. Crystals
Insulin crystals were obtained in a cryo-protective condition consisting of 25–32%v/vethylene glycol and were harvested with 20mm diameter nylon loops (Hampton Research; Figs. 2a
[image:5.610.47.570.71.374.2]and 4). Chicken egg-white lysozyme was crystallizedin mesoin IMISX plates using 200 nl mesophase and 1000 nl precipitant solution, as described previously (Huanget al., 2015, 2016). After removal from the outer glass sandwich plate, part of the
Figure 3
A diffraction-based grid scan covering a whole LCP bolus allows diffraction-based identification of crystals suitable for further small-wedge data collection. Images show a 50 nl bolus containing crystals of PepTStin an IMISX COC-windowed well. Data were collected at 100 K with a PILATUS 6M-F detector. (a) Definition of the grid scan area with 400400mm cells. (b) Heat map of the diffraction intensity detected in the grid scan.
Figure 2
[image:5.610.46.295.547.670.2]inner cyclic olefin copolymer (COC)-windowed sandwich plate with eight crystallization wells was mounted on the goniometer (Fig. 5b). Glucose isomerase crystals were obtained in a crystallization condition that included 0.1M
sodium cacodylate pH 6.5, 0.2M magnesium acetate and 30%(v/v) 2-methyl-2,4-pentanediol. Silicon nitride (Si3N4)
solid supports (1.5 1.5 mm, 1mm-thick silicon nitride membrane window centered within a 55 mm, 200mm-thick silicon frame; Silson Ltd, Northhampton, England) were glued with epoxy adhesive to a loopless pin mounted on a magnetic cryocap (Molecular Dimensions). One microlitre of crystal-lization mother liquor containing crystals of glucose isomerase was placed on the window of the silicon nitride solid support and immediately snap-cooled in liquid nitrogen for use in data collection (Fig. 5a). PepTSt (peptide transporter from Strep-tococcus thermophilus) was crystallized by thein mesomethod using either 50 nl (IMISX plate; Fig. 3) or 150 nl (silicon nitride plate; Fig. 2b) of mesophase and 1000 nl of precipitant solution (Huang et al., 2015). Crystallization boluses containing crystals were cut out from the crystallization plate and mounted onto a magnetic cryocap for data collection at 100 K, as described previously (Huanget al., 2016).
3. Results and discussion
3.1. Diffraction-based grid scan
In the first example of a diffraction-based grid scan experiment a large200100mm insulin crystal was snap-cooled to 100 K in a standard nylon loop (Fig. 2ainset). A fast grid scan with oscillation was recorded at 12.4 keV at beamline X06SA in the two-stage focusing mode. The beam size was adjusted to 10 10mm, which gave a total flux of 5.8
1010photons s1 at 10% transmission. Data collection was performed with a PILATUS 6M-F detector at 25 Hz (oscilla-tion angle, 0.1; exposure time, 40 ms) and a detector distance
[image:6.610.45.293.163.662.2]of 200 mm. With a 3030 grid corresponding to an area of
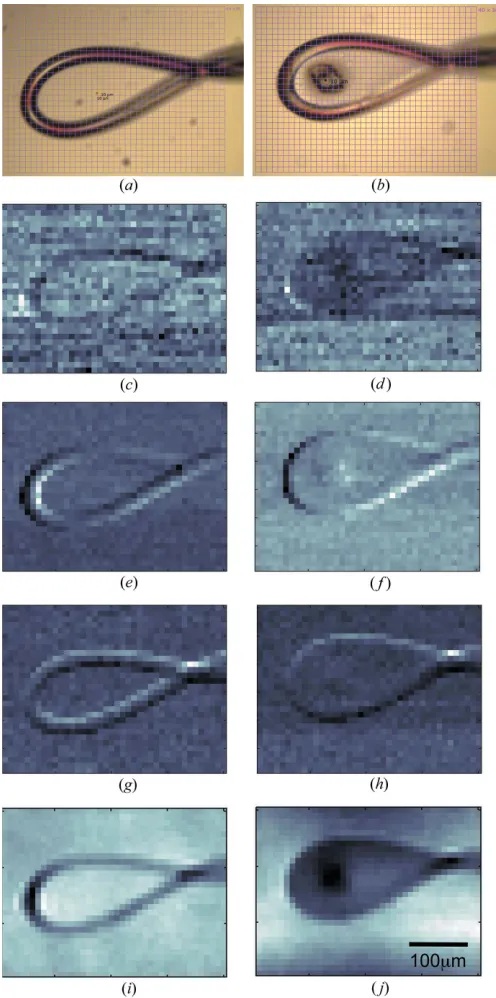
Figure 4
Loop and crystal detection with STXM. Panels on the left show data obtained for an empty nylon loop. Panels on the right show the same loop with a flash-frozen 40 40mm insulin crystal. Data were collected at 100 K with a PILATUS 6M-F detector. (a), (b) On-axis light microscope image, (c), (d) X-ray transmission, (e), (f) differential phase contrast in thexdirection, (g), (h) differential phase contrast in theydirection, (i), (j) integrated phase. The crystal is clearly visible in the integrated phase image.
Figure 5
[image:6.610.314.565.454.643.2]300 300mm, all 900 images were collected in 36 s. The diffraction images were processed on dedicated computing nodes and the results were displayed almost immediately after data collection (Fig. 2a). The results of an analysis performed with the DISTL program using the total-number-of-spots option and a resolution range from 50 to 4 A˚ are shown as a heat map in Fig. 2(a). The shape of the crystal can be clearly seen, as can the diffraction ‘hotspot’ in the crystal, which in this case corresponds to the thickest part of the crystal.
Diffraction-based grid scans are commonly used with a microbeam to identify microcrystals for micro- and serial crystallography of challenging targets such as membrane proteins (Smithet al., 2012; Huanget al., 2015). In the example shown in Fig. 2(b), crystals of the membrane protein PepTStin
LCP between silicon nitride windows were located with a grid scan. Data were collected with a 33mm beam, delivering a flux of 8 1010photons s1 at 50% transmission using the PILATUS 6M-F detector at 10 Hz (oscillation angle, 0.1 ;
exposure time, 0.1 s) and a detector distance of 400 mm. It took 20 s to collect and analyze the 200 diffraction images recorded over the 2010 grid, having an area of 6030mm. Bragg spot evaluation allowed for the accurate location of a small (66mm) PepTStcrystal with the 33mm microbeam.
The example shown in Fig. 2(b) demonstrates that micro-crystals grown in the LCP can be identified readily with a diffraction-based grid scan. However, the region of interest examined in this case is relatively small. Often when working with LCP samples a large volume of mesophase containing tiny crystals must be interrogated. Fig. 3 shows a large 50 nl mesophase bolus containing microcrystals of PepTSt in an
IMISX plate. It was scanned with a 1010mm beam (8.2
1011photons s1) over a 4040 grid covering an area of 400
400mm. All 1600 images were recorded in 64 s with the PILATUS 6M-F detector operating at 25 Hz (oscillation angle, 0.4; exposure time, 40 ms). The recent installation of
the EIGER 16M detector on beamline X06SA can reduce the time needed to collect the same number of images to just 12 s when operating at 133 Hz. Assuming sufficient flux, the pronounced reduction in diffraction-based grid scan data collection time will dramatically improve the efficiency and throughput of serial crystallography at synchrotrons. Typically this will involve an initial ultra-rapid grid scan to identify well diffracting crystals in the mesophase followed by standard data collection where small wedges of diffraction data are acquired on selected crystals in the bolus.
3.2. STXM
STXM measurements were performed at beamline X06SA at the SLS with the experimental setup described inx2.7. Data were collected at an energy of 12.4 keV and at the very low incident beam intensity of 106photons s1, which is 4–5 orders of magnitude lower than the typical flux (1010– 1011photons s1) used for collecting diffraction data. Apart from reducing the experimental overhead for STXM measurements by avoiding changes of the X-ray energy, collecting data at this commonly used energy provides
addi-tional advantages in terms of imaging at low deposited X-ray doses, as explained in the following. According to the litera-ture, protein crystal density values range from 1.22 to 1.47 g cm3with an average of 1.35 g cm3(Matthews, 1968; Andersson & Hovmo¨ller, 1998; Quillin & Matthews, 2000; White et al., 2007). By contrast, the density of the crystal-lization media used in the current study is very close to 1.00 g cm3, the highest being 1.09 g cm3 for the lysozyme crystallization condition (calculated with the online calculator http://sednterp.unh.edu). The dependence of the real and imaginary parts of the refractive index of protein crystals and crystallization solutions on the X-ray energy has two impor-tant properties worth considering in light of our STXM measurements. The absorption contrast given by the imaginary part of the refractive index is much higher at 6 keV than at 12.4 keV. However, maximizing absorption is a disadvantage because it also maximizes radiation damage directly linked to it. On the other hand, at 12.4 keV the difference in the real part of the refractive index of crystal and solution is relatively pronounced (it decays less as a function of energy than the imaginary part). This gives rise to a more sensitive DPC signal in comparison with the absorption (transmission) signal at these hard X-ray energies.
Fig. 4 shows the STXM results obtained for an empty nylon loop and the same loop containing a flash-frozen insulin crystal. Data were collected using a 1010mm beam and a fast grid scan with a grid size of 4030 and 0.1 s exposure. In total 1200 images were collected in 120 s. The size and shape of the loop are clearly discernible in the transmission image, as well as in the differential phase contrast and integrated phase images. The crystal, which is approximately 4040mm in size, can be clearly identified in all images. Upon close inspection of the data in Fig. 4, lines of dark spots or dots at certain locations in the absorption images can be seen. These can be accounted for by recognizing that the SLS ring operates in top-up mode with a stored current of 4001 mA, which is maintained by injections every 1–2 min. The top-up injection process tran-siently increases the diameter of the electron beam. As seen through the beam-defining slits of an MX beamline, a slight and transient drop in beam intensity occurs. The data included in this study have not been normalized with respect to incident photon flux. Hence, the regular small reductions in the intensity of the transmission images observed during the course of data collection reflect these periodic injections.
patterns on thousands of crystals to produce a complete dataset of still images. However, not every FEL pulse hits a crystal or generates a useful diffraction pattern. An approach to optimize hit rates involves establishing the location of crystals on the solid support prior to the SFX study. It is in such an application that STXM may prove useful and tests to evaluate this were performed in the current study. Measure-ments with a 3 3mm beam were carried out with 50
50mm-sized glucose isomerase crystals deposited onto a silicon nitride support, using a PILATUS 6M-F detector operating at 20 Hz. The data in Fig. 5(a) show that, despite the limited resolution, the method clearly works. We believe that STXM performed prior to the FEL experiment on a synchrotron beamline optimized for such measurements will enable the successful location of microcrystals on solid supports and, in turn, faster and more efficient SFX data collection.
The maximum resolution provided in an STXM measure-ment is limited by the size of the beam on the sample (Thibault
et al., 2008). The recent X06SA beamline optics upgrade enables measurements with a beam size down to 2 1mm. Despite this diminutive beam size, currently a crystal size of 4040mm appears to be the lower limit for the detection of protein crystals by STXM on a solid support and in a nylon loop at the X06SA MX beamline. This may be because, despite mimicking a standard STXM experiment as closely as possible, the experimental configuration used in the current study was not ideal in two important ways compared to what is available at dedicated imaging beamlines. First, vibrations that cause the beam position to fluctuate slightly affect a crystal-lography experiment much less than an imaging experiment, although as smaller and smaller beam sizes are used in MX, beam stability requirements continue to rise. Relatedly, imaging measurements are used to quantify beam stability. The second important factor is contrast related to beam conditioning and the detector. Even though the X-ray beam is focused on the sample, the beam divergence is much smaller than prevails at a typical imaging station. Thus, the size of the beam on the detector, even though the detector is 1200 mm away from the sample in this study, is such that the beam only strikes a very few central pixels. This, in turn, impairs the beam position determination and subsequent angular beam-deflec-tion measurement resolubeam-deflec-tion. To investigate this further we performed STXM experiments with an EIGER detector. The EIGER is a hybrid photon counting pixel area detector with a pixel size of 75 75mm (cf. 172 172mm in the case of PILATUS) equipped with a 12 bit single-photon counter. The combination of frame rates of about 750 Hz, flexibility to define various sizes of the region of interest (depending on the detector model and operation mode) and continuous readout with a dead time of only 3.8ms between exposures makes it ideally suited to ultra-fast grid scan experiments. STXM data were collected at room temperature over a 90 50 grid at 50 Hz corresponding to 4500 images acquired in 90 s with a beam size of 3 6mm. Microcrystals of lysozyme grown in LCP were clearly visible in the integrated phase image (Fig. 5b). Using the EIGER 16M detector, with a pixel size
about five times smaller in area than that of the PILATUS detector, thin needles with a thickness of 10mm were successfully identified.
4. Summary and conclusions
Rastering of samples has been incorporated as a standard technique easily accessible via a GUI at many synchrotron MX beamlines around the world (Songet al., 2007; Cherezov
et al., 2009; Aishimaet al., 2010; Bowleret al., 2010; Hilgartet al., 2011). Diffraction-based grid scans are particularly useful in locating small crystals in opaque media such as the LCP, in identifying diffraction ‘hotspots’ in crystals and, in combina-tion with a small intense beam, in serial X-ray crystallography. Fast diffraction-based alignment is more efficient than the traditional manual crystal centering with an in-line light microscope and other techniques such as tomography or SONICC, in the sense that these do not provide information about diffraction quality of crystals. In this paper, we present to our knowledge one of the fastest continuous two-dimen-sional grid scanning protocols that includes collection of still images. The experimental setup at the SLS offers the added unique feature of being able to collect oscillation images during the fast and continuous grid scanning process. While no systematic advantage of collecting oscillation images could be clearly identified for all types of samples, we believe it is a complementary approach to still image data collection that helps in dealing with difficult samples on a case-by-case basis. In our experience the decision concerning grid scan data collection in the static or oscillation mode is very much crystal dependent. For crystals with high mosaicity it is advisable to perform the grid scan with still images, while in the case of crystals with low mosaicity a grid scan with oscillation images is preferred. We plan to implement an automatic loop locali-zation coupled with crystal centering based on grid scan diffraction to enable fully automated screening and data collection at our MX beamlines. The installation of an EIGER 16M detector at the X06SA beamline, which can achieve frame rates of 133 Hz for the full frame and 750 Hz when the central 4M pixels are read out as the region of interest, will significantly further improve data collection speed.
The combination of straightforward experimental setup and ultra-fast grid scanning has been shown to be effective in low-dose detection of protein crystals by STXM. With this method, crystals in standard nylon loops, on solid supports and inin situ
provides a much lower dose alternative to the standard diffraction-based methods for locating crystals in opaque media. The experimental setup available at an MX beamline could be used for performing such experiments prior to crystallographic data collection.
Acknowledgements
We would like to thank the Swiss Light Source Controls Group, especially Jose Gabadinho, as well as Vincent Olieric and the Macromolecular Crystallography Group. This work was funded in part by Science Foundation Ireland (12/IA/ 1255).
References
Aishima, J., Owen, R. L., Axford, D., Shepherd, E., Winter, G., Levik, K., Gibbons, P., Ashton, A. & Evans, G. (2010).Acta Cryst.D66, 1032–1035.
Andersson, K. M. & Hovmo¨ller, S. (1998).Z. Kristallgr.213, 369–373. Bowler, M. W., Guijarro, M., Petitdemange, S., Baker, I., Svensson, O., Burghammer, M., Mueller-Dieckmann, C., Gordon, E. J., Flot, D., McSweeney, S. M. & Leonard, G. A. (2010).Acta Cryst.D66, 855–864.
Brockhauser, S., Di Michiel, M., McGeehan, J. E., McCarthy, A. A. & Ravelli, R. B. G. (2008).J. Appl. Cryst.41, 1057–1066.
Bunk, O., Bech, M., Jensen, T., Feidenhans’l, R., Binderup, T., Menzel, A. & Pfeiffer, F. (2009).New J. Phys.11, 123016. Caffrey, M., Li, D. & Dukkipati, A. (2012).Biochemistry,51, 6266–
6288.
Cherezov, V., Hanson, M., Griffith, M. T., Hilgart, M. C., Sanishvili, R., Nagarajan, V., Stepanov, S., Fischetti, R. F., Kuhn, P. & Stevens, R. C. (2009).J. R. Soc. Interface,6, S587–S597.
Coulibaly, F., Chiu, E., Ikeda, K., Gutmann, S., Haebel, P. W., Schulze-Briese, C., Mori, H. & Metcalf, P. (2007).Nature,446, 97–101. Dinapoli, R., Bergamaschi, A., Henrich, B., Horisberger, R., Johnson,
I., Mozzanica, A., Schmid, E., Schmitt, B., Schreiber, A., Shi, X. & Theidel, G. (2011).Nucl. Instrum. Methods Phys. Res. Sect. A,650, 79–83.
Evans, G., Axford, D. & Owen, R. L. (2011).Acta Cryst.D67, 261– 270.
Feld, G. K.et al.(2015).J. Appl. Cryst.48, 1072–1079. Fuchs, M. R.et al.(2014).J. Synchrotron Rad.21, 340–351. Haupert, L. M. & Simpson, G. J. (2011).Methods,55, 379–386.
Henrich, B., Bergamaschi, A., Broennimann, C., Dinapoli, R., Eikenberry, E. F., Johnson, I., Kobas, M., Kraft, P., Mozzanica, A. & Schmitt, B. (2009).Nucl. Instrum. Methods Phys. Res. Sect. A,
607, 247–249.
Hilgart, M. C., Sanishvili, R., Ogata, C. M., Becker, M., Venugopalan, N., Stepanov, S., Makarov, O., Smith, J. L. & Fischetti, R. F. (2011).
J. Synchrotron Rad.18, 717–722.
Holton, J. M. (2009).J. Synchrotron Rad.16, 133–142.
Holton, J. M. & Frankel, K. A. (2010).Acta Cryst.D66, 393–408. Huang, C.-Y., Olieric, V., Ma, P., Howe, N., Vogeley, L., Liu, X.,
Warshamanage, R., Weinert, T., Panepucci, E., Kobilka, B., Diederichs, K., Wang, M. & Caffrey, M. (2016).Acta Cryst.D72, 93–112.
Huang, C.-Y., Olieric, V., Ma, P., Panepucci, E., Diederichs, K., Wang, M. & Caffrey, M. (2015).Acta Cryst.D71, 1238–1256.
Hunter, M. S.et al.(2014).Sci. Rep.4, 6026.
Kissick, D. J., Gualtieri, E. J., Simpson, G. J. & Cherezov, V. (2010).
Anal. Chem.82, 491–497.
Madden, J. T.et al.(2013).J. Synchrotron Rad.20, 531–540. Matthews, B. W. (1968).J. Mol. Biol.33, 491–497.
Menzel, A., Kewish, C. M., Kraft, P., Henrich, B., Jefimovs, K., Vila-Comamala, J., David, C., Dierolf, M., Thibault, P., Pfeiffer, F. & Bunk, O. (2010).Ultramicroscopy,110, 1143–1147.
Quillin, M. L. & Matthews, B. W. (2000).Acta Cryst.D56, 791–794. Schlichting, I. (2015).IUCrJ,2, 246–255.
Smith, J. L., Fischetti, R. F. & Yamamoto, M. (2012).Curr. Opin. Struct. Biol.22, 602–612.
Song, J., Mathew, D., Jacob, S. A., Corbett, L., Moorhead, P. & Soltis, S. M. (2007).J. Synchrotron Rad.14, 191–195.
Svensson, O., Malbet-Monaco, S., Popov, A., Nurizzo, D. & Bowler, M. W. (2015).Acta Cryst.D71, 1757–1767.
Thibault, P., Dierolf, M., Kewish, C. M., Menzel, A., Bunk, O. & Pfeiffer, F. (2009).Phys. Rev. A,80, 043813.
Thibault, P., Dierolf, M., Menzel, A., Bunk, O., David, C. & Pfeiffer, F. (2008).Science,321, 379–382.
Tinti, G., Bergamaschi, A., Cartier, S., Dinapoli, R., Greiffenberg, D., Johnson, I., Jungmann-Smith, J. H., Mezza, D., Mozzanica, A., Schmitt, B. & Shi, X. (2015).J. Instrum.10, C03011.
Warren, A. J., Armour, W., Axford, D., Basham, M., Connolley, T., Hall, D. R., Horrell, S., McAuley, K. E., Mykhaylyk, V., Wagner, A. & Evans, G. (2013).Acta Cryst.D69, 1252–1259.
Weierstall, U. (2014).Philos. Trans. R. Soc. London Ser. B Biol. Sci.
369, 20130337.
White, E. T., Tan, W. H., Ang, J. M., Tait, S. & Litster, J. D. (2007).
Powder Technol.179, 55–58.