Molecular dynamics and protein function
M. Karplus*†§and J. Kuriyan§¶储
*Department of Chemistry and Chemical Biology, Harvard University, Cambridge, MA 02138;†Laboratoire de Chimie Biophysique,
Institut de Science et d’Inge´nierie Supramole´culaires, Universite´ Louis Pasteur, 67000 Strasbourg, France;¶Howard Hughes Medical
Institute and Departments of Molecular and Cell Biology and Chemistry, University of California, Berkeley, CA 94720-3202; and 储Physical Biosciences Division, Lawrence Berkeley National Laboratory, Berkeley, CA 94720
Edited by Bruce J. Berne, Columbia University, New York, NY, and approved February 15, 2005 (received for review January 18, 2005)
A fundamental appreciation for how biological macromolecules work requires knowledge of structure and dynamics. Molecular dy-namics simulations provide powerful tools for the exploration of the conformational energy landscape accessible to these molecules, and the rapid increase in computational power coupled with improvements in methodology makes this an exciting time for the ap-plication of simulation to structural biology. In this Perspective we survey two areas, protein folding and enzymatic catalysis, in which simulations have contributed to a general understanding of mechanism. We also describe results for the F1ATPase molecular
motor and the Src family of signaling proteins as examples of applications of simulations to specific biological systems.
T
he conformational dynamics of protein molecules is encoded in their structures and is often a critical element of their func-tion. A fundamental appreciation for how proteins work therefore requires an understanding of the connection be-tween three-dimensional structure, ob-tained with increasing rapidity by x-ray crystallography and NMR, and dynam-ics, which is much more difficult to probe experimentally. Molecular dynam-ics simulations provide links between structure and dynamics by enabling the exploration of the conformational en-ergy landscape accessible to protein molecules (1–3). The first molecular dy-namics simulation of a protein was re-ported in 1977 and consisted of a 9.2-ps trajectory for a small protein in vacuum (4). Eleven years later, a 210-ps simula-tion of the same protein in water was reported (5), and the phenomenal in-crease in computing power since then now makes it routine to run simulations of much larger proteins that are 1,000– 10,000 times as long as the original simulation (⬇10–100 ns), in which the protein is surrounded by water and salt (Fig. 1). Significant improvements in the potential functions have also been achieved, making the simulations much more stable and accurate (6).The engineering principles underlying protein design are truly baroque, with evolutionary tinkering resulting in molecu-lar machines that may be effective and efficient but whose three-dimensional structures are often so complicated as to obscure the mechanism of action. Clues to the essential dynamics of the mole-cule are quite often provided by the separation of the protein into domains connected by hinges and the availability of structures corresponding to different functional states, but it is not easy from visual inspection or simple calculations to deduce the workings of these molecu-lar machines. Molecumolecu-lar dynamics
simu-lations can provide the ultimate detail concerning individual atomic motions as a function of time; thus, they can be used to answer specific questions about the properties of a model system often more readily than experiments on the actual system. For many aspects of bi-omolecule function, these details are of interest (e.g., which of the many resi-dues surrounding ATP in a motor pro-tein are most important for coupling ATP binding to molecular movement).
The combination of increased com-puter power and improved potential functions has resulted in an ability to generate simulations that approach the point at which they can survive critical examination by the experimentalists who determine the structures of the proteins being simulated. For small proteins or
protein domains that are not expected to undergo large conformational transi-tions (e.g., an SH2 domain bound to a phosphopeptide), a simulation lasting several nanoseconds in a fully solvated environment and using all-atom poten-tials without truncation of the electro-static interactions will typically result in rms deviations from the crystal struc-ture of⬇1 Å for the backbone atoms of the core region of the protein (7). Such simulations engender a degree of confi-dence that the interesting structural changes that result from the simulation of larger assemblies [e.g., intact Src ki-nases containing SH2 domains (8)] are meaningful, as we describe later.
Simulations are most effective when analyzed in close conjunction with ex-periments on protein function, which play an essential role in validating and improving the simulations (see, for ex-ample, refs. 9–12). One outcome of the increase in readily available computer power and the standardization of simu-lation protocols is that it is now becoming feasible for nonspecialists to reproduce and check some, if not all, of the con-clusions of simulation analyses published by others. This kind of cross-validation will aid in the integration of simulations into the normal process of interpreting newly emerging structural results. A prescription for making the analysis of simulation results more rigorous and a list of possible errors has been pro-vided (13).
In this Perspective, we illustrate the application of molecular dynamics simu-lations to biology by describing several selected examples, emphasizing our own work. We start with a broader survey of two areas, protein folding and enzymatic
This paper was submitted directly (Track II) to the PNAS office.
[image:1.594.212.375.239.398.2]§To whom correspondence may be addressed. E-mail: [email protected] or [email protected]. © 2005 by The National Academy of Sciences of the USA
Fig. 1. Simulation of a solvated protein. This slice through a simulation system shows a Src kinase protein (green) surrounded by⬇15,000 water mol-ecules (oxygen atoms are red and hydrogen atoms are white). The simulation system consists of
⬇50,000 atoms, including potassium and chloride ions (purple and orange spheres, respectively). A 1-ns molecular dynamics trajectory for this system can be generated in 4 days by using a cluster of four inexpensive Linux-based computers. (Courtesy of Olga Kuchment.)
SPECIAL
FEA
TURE:
catalysis, in which simulations combined with experiment have led to a general understanding of mechanism. The ex-plosive growth of structural results for an increasingly comprehensive range of biological processes demands simula-tions that address issues that are specific to particular systems. As examples, we describe simulation results for the F1 ATPase molecular motor and the Src family of signaling proteins.
Protein Folding
An understanding of how the newly syn-thesized polypeptide chain is able to fold to its native structure is fundamen-tal to the description of life at a molecu-lar level. This issue is made all the more critical because misfolding is involved in a range of diseases (14). A synergy be-tween simulation and experiment has led to a conceptual solution for one as-pect of the folding problem that is con-cerned with the mechanism by which the protein chain finds the native conforma-tion despite the immensity of the poten-tial search space. This advance has occurred despite the fact that folding is slow on the simulation time scale. (Even the fastest proteins take microseconds to fold, and the process cannot be simu-lated directly.) Most of the simulations of folding have used simplified models to capture the essential aspects of the process (15–17).
Key insights as to how the native structure can be found by the polypep-tide chain in a reasonable time were obtained by using Monte Carlo dynam-ics for the folding of simplified bead models on a cubic lattice, a process fast enough so that the hundreds of trajecto-ries needed to obtain statistically mean-ingful results could be calculated with the available computers (18). These lat-tice Monte Carlo studies showed that folding to the native state occurred on a time scale many orders of magnitude shorter than that required to sample all of the configurations (the so-called Levinthal time); e.g., with time mea-sured in Monte Carlo steps, only⬇5⫻ 107steps were required for folding a 27-bead polymer that had 1016possible configurations. Although each folding trajectory is very different, the bias to the native state on the free energy sur-face is sufficient that the stochastic search samples only a small fraction of the total configurations in finding the native state. This principle is now gener-ally accepted as the solution of the search problem in protein folding (17, 19), and the objective of present studies is concerned with the specifics of the folding of individual proteins and the ways that misfolding is avoided.
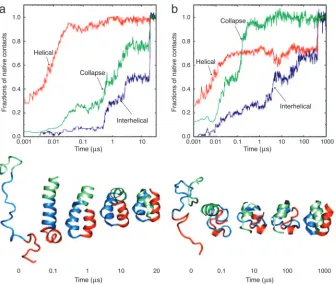
One such study of three-helix bundle proteins used a C␣model to represent
the protein chain and a square well po-tential for the interactions between pairs of nonbonded residues. These simplifica-tions made possible the use of discrete molecular dynamics algorithms for studying the folding process (20). The speed of the latter is such that several hundred folding trajectories could be calculated for different relative weights of native and nonnative interactions in the model potential function. Fig. 2 shows typical trajectories for a model with the native state strongly favored (Go-like potential) and a model in which nonnative interactions make a significant contribution along the folding pathway. In the former model, the heli-ces form first and then diffuse to find the native fold [a limiting case of the diffusion–collision model (21)], whereas, in the latter model, there first is a col-lapse to a relatively disordered globule and the helices form simultaneously with the native tertiary structure. The model results correlate with recent fold-ing experiments and all-atom (unfold-ing) simulations in explicit solvent (22). Interestingly, an extension of the dis-crete dynamics methodology has re-cently been used to simulate fibril
formation from random coil peptides, illustrating a possible mechanism by which large, relatively well ordered
-sheet aggregates could appear in solu-tion (23).
It is not yet possible to do statistically meaningful folding simulations of pro-teins with all-atom models. However, peptides composed of 20 or so residues with a well defined native structure are being simulated by molecular dynamics with implicit (15, 24, 25) and explicit (16) solvent. Although the peptides are small, the complexity of the simulations can be usefully interpreted in terms of disconnectivity graphical (24) and net-work (26) descriptions of the folding process. Given the increase in the speed of computers, particularly through the development of massively parallel ma-chines, it is likely that within the next 10 yearsab initiofolding will reach the stage at which it can be used not only to determine the details of the folding mechanism but also to aid in solving the ‘‘other’’ folding problem, that of deter-mining the structure of the native state directly from the sequence by molecular dynamics simulations.
Enzyme Catalysis
[image:2.594.218.554.48.332.2]Enzyme catalysis can produce rate ac-celerations of a factor of 1019(27). This
process involves ‘‘molecular recognition’’ at the highest level; the catalysis of pro-ton-transfer reactions, for example, re-quires the recognition of a change in a COH bond length of⬇0.5 Å in going from the reactant to the transition state. In 1946, before structural information was available, Linus Pauling (28) pro-posed that enzymes can accelerate reac-tion rates because they bind the transireac-tion state better than the substrate and thereby lower the activation free energy,
⌬G‡. The validity of this key concept in enzyme catalysis has been confirmed by many studies (29, 30), although the dynamical contribution to the preexpo-nential factor,A(T), in the Arrhenius expressionk⫽A(T) exp(⫺⌬G‡兾RT), wherekis the rate constant, has to be considered as well (30).
Computer simulations are essential for understanding the lowering of the activation free energy in terms of the structure of the enzyme and its flexibil-ity. The structure provides a ‘‘preorga-nized environment’’ (31) that enhances catalysis by a greater stabilization of the transition state than of the reactant state, with contributions from interac-tions with the bound substrate (32, 33) and from the enzyme itself. A certain degree of enzyme flexibility is essential for catalysis because atomic motions of the enzyme are required in all reactions (34). Moreover, larger scale motions also can be involved directly in catalysis and in providing a protected catalytic site for the reaction while permitting the substrate to enter and the product to escape. The changes in enzyme structure and vibrational modes associated with the progress along the reaction coordi-nate have been shown to promote catal-ysis most efficiently by lowering⌬G‡. This effect is distinct from the role of such motions in determiningA(T).
One of the enzymes that has been studied in detail experimentally and by simulations is triosephosphate isomerase (TIM), which catalyzes the conversion of dihydroxyacetone phosphate (DHAP) to (R)-glyceraldehyde 3-phosphate. The apparent barrier for the reaction in the enzyme has been calculated to be 11–13 kcal兾mol (1 cal⫽4.18 J) lower than that for the reaction in aqueous solution (35, 36). The rate-determining step is the transfer of a proton from DHAP to Glu-165 and the contributions obtained from a perturbation model (35) of indi-vidual residues to lowering the activa-tion energy of this step are shown in Fig. 3A; the positions of important resi-dues in the active site are shown in Fig. 3B. The charged residue Lys-12 makes the most important contribution, but the neutral His-95 side chain as well as cer-tain main chain NH groups also
contrib-ute. This type of decomposition, which can be validated in part by experiment, also provides a basis for determining the evolutionary variation in⌬G‡for the large number of available TIM se-quences (M.K., unpublished data). Be-cause water can lead to a side reaction, protection of the active site is achieved by a ‘‘lid’’ motion, which makes the active site of TIM accessible to the substrate but closes it off for catalysis (37, 38).
Another enzyme that has been stud-ied extensively is dihydrofolate reduc-tase (DHFR), which catalyzes hydride transfer between nicotinamide adenine dinucleotide phosphate and 7,8-dihydro-folate. Experiments (39, 40) and simula-tions (41, 42) point to the fact that the reaction coordinate is complex, involv-ing motions of parts of the enzyme distant from the active site. Although enzyme motion is involved, the catalysis
is primarily due to the lowering of the activation barriers.
Dynamic effects associated with the preexponential factor,A(T), are nor-mally very difficult to isolate experimen-tally. One contribution concerns the Eyring-type transmission coefficient, which can be less than unity because of the recrossing of the barrier. Simula-tions have shown that, although the recrossing factor is quantitatively inter-esting in terms of a full understanding of the reaction, the magnitude of its effect is generally small (no more than a factor of 2 or 3) as compared with other contributions (30). By contrast, tunneling can be more important in enzymatic reactions, particularly those involving the transfer of hydrogen (hy-drogen atom, proton, or hydride ion) (43–45). Because inferences concerning this effect from isotope studies are indi-rect (46, 47), simulations have been im-portant for a direct determination of the magnitude of the tunneling. At ambient temperatures, the calculated rate en-hancements due to tunneling range from a factor of 1.5 for the intermolecular proton transfer in TIM (43) to 780 for soybean lipoxygenase (48). These rate accelerations are equivalent to thermo-dynamic free energy effects of 0.2–3.9 kcal兾mol, a significant contribution but one that is still small compared with the lowering of the activation free en-ergy by 10 kcal兾mol or more. Detailed calculations of the tunneling contribu-tion in DHFR are providing addicontribu-tional insights concerning its role in enzyme catalysis (49).
Molecular Dynamics Analyses of F1
ATPase
[image:3.594.217.379.50.344.2]The enzyme Fo⫺F1ATP synthase is perhaps the most remarkable of the mo-lecular machines that have been studied at atomic resolution (Fig. 4A). This en-zyme is central to life because it synthe-sizes ATP by harnessing the chemical potential of proton gradients across cell membranes. One component of Fo⫺F1 ATP synthase (Fo) is mainly within the membrane and is responsible for con-verting the chemical energy of the pro-ton gradient into rotatory motion of a drive shaft that is located within the sec-ond component, which is known as F1 ATPase (50). The rotational motion of the drive shaft is converted by F1 ATPase into the production of ATP from ADP and Pi(inorganic phosphate, H2PO4⫺). The landmark crystal struc-tures of F1ATPase (51, 52), along with the results of single molecule studies (53) and more conventional biochemical experiments (54), have provided the ba-sis for a series of simulations aimed at understanding how F1ATPase works.
Of particular interest is the demonstra-tion that F1ATPase, which by itself normally hydrolyzes ATP, can also synthesize ATP if the central shaft is rotated by external forces (55). High-resolution structures for the Fo compo-nent are not available at present, but this experiment demonstrates that it is reasonable to hope to understand how F1ATPase synthesizes ATP without in-cluding the Focomponent in simulations (but see ref. 56 for a simulation analysis of how Fofunctions).
The major structural element of F1 ATPase is a hexameric assembly of three␣-subunits and three-subunits surrounding the␥-subunit, which has a globular base and an extended coiled-coil domain (51) (see Fig. 4A). All six of the␣- and- subunits bind nucleotides, but only the three-subunits are cata-lytically active. The crystal structures of F1ATPase have proven to be enor-mously informative regarding the mech-anism of the motor because each crys-tallographic snapshot provides views of three distinct states of the catalytic
-subunits (51, 52, 57). The centrally located and asymmetric␥-subunit forms a shaft, and its orientation determines
the conformation of the-subunits. The original crystal structure of F1ATPase led to the identification of three confor-mations of the-subunit:E(empty),
TP(ATP bound), andDP(ADP bound) (51). The open conformation of theE-subunit is different from that of theTP- andDP-subunits, which are both closed and very similar to each other.
The prescient analysis of kinetic data by Paul Boyer (58) led to his proposal (in advance of structural information) of a remarkable and unprecedented ‘‘bind-ing change mechanism’’ that described the action of F1ATPase. In terms of this mechanism, ATP synthesis proceeds by the cyclical conversion of the -subunit from an ‘‘open’’ state that binds ATP only weakly to a ‘‘loose’’ state that has higher affinity for ATP to a ‘‘tight’’ state that has the highest affinity for ATP. The crystal structure (51), with its three distinct conformations of the
-subunits and asymmetric disposition of the␥-subunit shaft, clearly supported the binding change mechanism proposed by Boyer (58).
Molecular dynamics simulations have made contributions to our understand-ing of two aspects of the mechanism of F1ATPase. As is usually the case in crystallography, the structures are silent about the nature of the transitions from one state to the other and the forces involved. Simulations have been useful in piecing together at least some of what must happen as the motor moves through its duty cycle, and we discuss these studies first (59–61). The second issue concerns the identification of par-ticular conformations of the-subunit with the open, loose, and tight states of the binding change mechanism. It is ap-parent that the empty conformation (E) is the low-affinity state of the
-subunit, but theDPandTPstates are very similar to each other, and it has not been possible on the basis of experi-mental data alone to identify which of the two is the high-affinity binding site for ATP. Free energy difference sim-ulations of nucleotide binding to the
-subunits have resolved these ambigu-ities (62), allowing the large body of ex-perimental data on the complex to be integrated into a detailed kinetic scheme that models the catalysis of ATP hydro-lysis by F1ATPase in the absence of the Focomponent (63).
Conformational Transitions in F1ATPase. The time scale for one rotation of the␥ shaft is in the microsecond to millisec-ond range (53) and is therefore not ac-cessible to the submicrosecond time scales probed by standard molecular dy-namics simulations. Because the
begin-ning and end states corresponding to a 120° rotation of the␥-subunit are known (51), the challenge is essentially one of mapping a low-energy path that connects one stable conformation of the system to another, a general problem that is receiving considerable attention at present (64). The earliest attempt to characterize the intermediate structures in F1ATPase used an interpolation method in a cyclindrical coordinate sys-tem defined by the rotation axis of the
␥-subunit (65). These interpolated struc-tures were recently used after local relaxation by molecular dynamics to an-alyze the breaking of interactions be-tween the ATP and the protein as the system is driven from theTPstate to theEstate (59). More details concern-ing the conformational transitions in F1 ATPase were obtained by molecular dynamics simulations in the presence of biasing forces that were applied to the
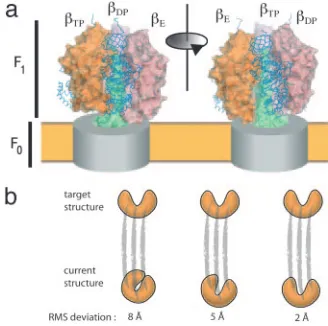
␥-subunit alone (60, 61) or to the entire structure in a procedure that drives the system from one state to the other with-out explicitly constraining the nature of the transition path (61). The spirit in which these simulations are done entails ‘‘pushing’’ on the molecular assembly (e.g., by forcing the␥-subunit to rotate) and analyzing how the rest of the struc-ture responds (Fig. 4B). Because the time scale of the forced rotational tran-sition of the␥-subunit is orders of mag-nitude faster than the actual rotation rate, the implicit assumption in such studies is that meaningful information concerning the mechanism can be still be obtained.
Both of these studies demonstrated that the rotation of the␥-shaft triggers the opening of the nucleotide-bound
TP-subunit and the closure of the open
E-subunit (60, 61). The importance of a track of ionic residues on the␥-shaft and on the inward-facing surfaces of the
␣- and-subunits has been highlighted (61). These ionic residues provide a mechanism for smooth rotation of the
␥-subunit by enabling the sequential handover of ion pairing interactions. The functional difference between the
␣- and-subunits is demonstrated by smooth bypass of the␣-subunits by the rotating␥-subunit. In contrast, interlocking elements from the␥- and
-subunits generate responses in the
-subunits as the␥-subunits move. One interesting phenomenon that emerged from both sets of simulations (60, 61) is the rapid relaxation of the
[image:4.594.41.205.51.214.2]E- subunit once the steric block im-posed by the␥-subunit is removed by rotation. Although solution NMR data for the isolatedE-subunit indicate that the equilibrium is shifted toward the open conformation until the nucleotide
Fig. 4. F1ATPase and targeted molecular dynam-ics. (a) Structure of Fo⫺F1ATP synthase based on crystal structures of the F1ATPase (51, 52). The Fo component is indicated as a gray cylinder within the membrane (yellow), and the␥-subunit shaft is shown in green. The three␣-subunits are indicated by blue backbone traces, and the molecular sur-faces of the three -subunits are shown. The
␥-subunit rotates in a clockwise direction during ATP synthesis, as viewed from the membrane, and the effects of a 120° rotation of the␥-subunit are manifested as a change in the conformation of the
binds, the rapid closure of theE -subunit seen in the simulations with (61) and without (60) nucleotides is consis-tent with the results of normal mode calculations (66), which show that one of the lowest frequency (i.e., most readily excitable) normal modes of the
-subunit accounts for a significant frac-tion of the conformafrac-tional difference between the open and closed forms of this subunit.
Free Energy Simulations of F1ATPase.The simulations described so far do not ad-dress the energetics of ATP binding to the various states. The essential diffi-culty here arises from the striking simi-larity in structure between theDPand
TPstates (52, 57). A recently deter-mined high-resolution structure of F1 ATPase has the ATP analog ADP.AlF4 bound at theDPand theTPsites, with tight coordination of the nucleotide in both cases (52). Which site features high-affinity ATP binding and which site more closely resembles the structure of the subunit when the chemical catalysis step occurs? Answers to these questions have been provided by free energy dif-ference simulations in which ATP.H2O is converted computationally to ADP.Pi (62). These calculations, which are often referred to as ‘‘computational alchemy,’’ provide estimates of the standard free energy change,⌬Go, for the conversion of ATP into ADP at each of the occu-pied binding sites. This free energy change is calculated to be⫺9 kcal兾mol in theDPsite (i.e., ADP is strongly fa-vored over ATP at this site) and 1.5 kcal兾mole at theTPsite (i.e., ATP and ADP have almost the same chemical potential at this site).
Solution measurements have shown that, under ‘‘unisite’’ hydrolysis conditions (i.e., when the ATP concentration is so low that only the strongest binding site is involved), the reaction free energy is near zero; the experimental value is 0.4 kcal兾 mol for the mitochondrial enzyme, whose structure has been determined, and⫺0.6 kcal兾mol for theEscherichia colienzyme (63). Given the free energy simulation results just cited, it is possible to identify theTPas the strong binding site for ATP and theDPsite as the intermediate bind-ing site. This ‘‘missbind-ing link’’ between the solution measurements and the crystal structure has made possible a complete assignment of the measured binding con-stants not only for ATP but also for ADP.Pi(62). Interestingly, it was also shown that theDPsite is the strong bind-ing site for ADP.Pi(63). These results indicate that there are two major contri-butions to the driving force (actually a biasing free energy) that rotates the
␥-subunit when ATP is hydrolysed by F1
ATPase. The first contribution is the in-crease in the binding free energy of ATP in going from theEto theTPstate; this result is in agreement with the original model of Wang and Oster (65). However, the second contribution is a new result; it arises from the fact that once hydrolysis has taken place and ADP.Pi occupies the binding site, the conformation is biased towardDP. A detailed kinetic model for ATP hydrolysis by F1ATPase has been developed with these results and solution kinetic constants identified with the dif-ferent-subunits (63).
Dynamics of the Src Tyrosine Kinases
The Src tyrosine kinases are a family of closely related proteins that transmit sig-nals initiated by growth factor receptors in human cells (67). A mutant and constitu-tively activated form of Src is encoded by the first oncogene to be discovered (v-Src; so named for the sarcomas caused by the expression of this retroviral gene). The Src proteins contain a tyrosine kinase do-main that catalyzes the transfer of phos-phate from ATP to tyrosine residues on substrate proteins. The inappropriate activation of tyrosine kinases such as Src can have deadly consequences in terms of the onset of cancers because phosphory-lated tyrosines serve as targeting signals for SH2 domains in signaling proteins that control cell growth and differentia-tion (68).
The Src kinases themselves contain an SH2 domain and another peptide-binding module known as the SH3 domain, both of which are important for the mainte-nance of the inactive state of these pro-teins. Crystal structures of inactive Src kinases unexpectedly revealed that the SH2 and SH3 domains bind to the distal face of the kinase domain, rather than near the active site (69, 70). How do the SH2 and SH3 domains affect the catalytic activity of the kinase domain without be-ing located near the active site? One pos-sibility is that these domains affect the global dynamics of the protein, making it more difficult for the kinase domain to undergo the change in conformation from the observed inactive state (69, 70) to the structurally different active form (71).
Molecular dynamics simulations of the Src kinases c-Src and Hck have revealed an unexpected feature of the SH2 and SH3 domains that may be a key to the regulation of the Src kinases (8). Before the simulation analysis, the SH2 and SH3 domains were considered to be flexibly linked and independently functioning modules (72, 73). Thus, it came as a sur-prise that the simulations showed the SH2–SH3 unit of the assembled Src pro-teins to be coupled together relatively rig-idly. Unbiased simulations extending for several nanoseconds revealed that the
SH2 and SH3 domains tended to move together as a unit, with the linker between them playing a particularly important role in clamping these domains to the kinase domain. In contrast, NMR studies of iso-lated SH2–SH3 units of Src kinases had shown that these domains are linked to-gether flexibly (73). Indeed, simulations of isolated SH2–SH3 domains do reveal them to be extremely flexible in terms of their relative orientation (8), suggesting that the linker between them functions as an ‘‘inducible snap lock,’’ a term intro-duced by Wright and coworkers (74) to describe flexible connections between cer-tain zinc finger modules that snap into rigidity when the zinc fingers bind to their cognate DNA recognition elements. In the Src proteins, the linker between the SH2 and SH3 domains is stabilized in the assembled and inactive state by several hydrogen bonds. When released from the interactions with the kinase domain, simu-lations show that these hydrogen bonds are broken by water molecules and the linker becomes flexible (8).
Targeted molecular dynamics simula-tions in which an ‘‘activation loop’’ that is located near the active site of the kinase domain is driven from the inactive confor-mation to the active conforconfor-mation while leaving the SH2 and SH3 domains unre-strained showed that movements at the active site of the kinase reverberate through to the SH2 domain, even though it is located⬎40 Å away (8). The cou-pling between the SH2 and SH3 domains is the key to this intersite communication in Src and underlies the importance of the phosphotyrosine–SH2 linkage at the base of the distal surface of the kinase domain. If this linkage is broken, as in the form of the protein produced by the v-Src onco-gene, the kinase activity of Src is turned on constitutively (67). The molecular dy-namics simulations show that the residues in the SH2 domain that interact with the phosphotyrosine residue in the tail move significantly when the activation loop in the kinase domain is displaced. The SH2– phosphotyrosine linkage would be ex-pected to resist these movements of the activation loop and, thereby, to impede the activation process.
years of prior experimental investigation into Src function.
The Abelson (Abl) Kinase and the Specificity of Imatinib Mesylate (Gleevec)
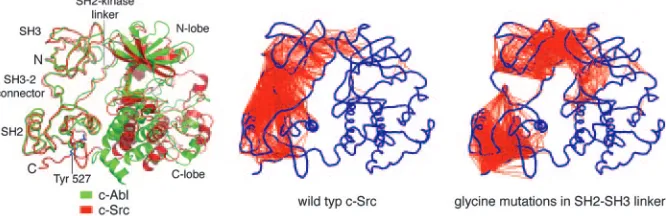
An interesting corroboration of these re-sults from molecular dynamics was pro-vided by a subsequent structural analysis of the Abl tyrosine kinase (75). A close relative of the Src kinases, Abl contains SH2 and SH3 domains that are similar in sequence to those of Src, and, although it lacks the tyrosine residue that anchors the SH2 domain to the kinase in Src when phosphorylated, the overall structure of autoinhibited Abl is similar to that of Src (75). Molecular dynamics simulations of Abl carried out as for Src suggested that these domains form a similar snap lock in Abl (75). As in Src, mutations in the SH2–SH3 linker activate the Abl kinase (76, 77). The difference is that the SH2 domain in Abl is anchored to the kinase domain not by a phosphotyrosine-medi-ated linkage, which keeps the SH2 and kinase domains apart in Src, but through an intimate and direct interface that forms between the SH2 domain and the kinase domain.
The Abl kinase domain is the target of the successful cancer drug Gleevec, which works by blocking the catalytic activity of a form of the Abl protein that is activated in chronic myelogenous leukemia (78). Gleevec binds with high affinity to the inactive Abl kinase do-main but not to that of Src, even though all of the residues that make contact with the drug in Abl are conserved in Src (79, 80). The striking feature of the structures of the inactive forms of Abl and Src is that it is the conformation of the SH2–SH3 unit and not that of the kinase domain that is conserved be-tween the two proteins (Fig. 5). It ap-pears that the rigidity of the SH2–SH3 unit, which is a feature of the Src and Abl simulations (8, 75), is manifested as a conservation of the structure of the SH2–SH3 unit in the inactive states of both proteins. Because the SH2 domain in Abl is closer to the kinase domain than in Src, the SH3 domain in the rigid SH2–SH3 unit swings away, and the ki-nase domain adjusts its conformation so as to preserve the interaction with the SH3 domain. As a result, the kinase do-main of Abl is more open, and it is this
difference in conformation to which Gleevec is sensitive.
Future Prospects
It is now often the case that experimental structures are available for more than one functional state of a molecular assembly, so that the problem of finding transition paths between low-energy regions of a complex conformational space is becom-ing increasbecom-ingly important. Despite the difficulties inherent in the difference be-tween the experimental and simulation time scales, it is likely that creative solu-tions to the problem will be found, as il-lustrated by the recent application of a transition path sampling method (64) to the problem of fidelity checking by DNA polymerases (81). It will be particularly interesting to be able to calculate the free energy barriers to conformational transi-tions, which has not as yet been widely done for protein conformational changes because of the difficulties in specifying the reaction coordinate for the transition. A prominent exception occurs in the study of ion channels, for which the reaction coordinate is essentially defined by the system (82). Alternatively, the generation of multiple targeted molecular dynamics trajectories could be used to extract the free energy directly (83).
It is to be hoped that experimental structural biologists, who know their systems better than anyone else, will make increasing use of molecular dy-namics simulations for obtaining a
deeper understanding of particular bio-logical systems. When molecular dynam-ics simulations are a routine part of structural biology, it will become clearer what refinements and extensions of the methodology are most needed to im-prove the results and to perfect the con-structive interplay between the simula-tions and experiment. These conclusions will, in turn, provide challenges for the simulation experts and catalyze new de-velopments in the field. In addition to reaction path search methods, improved treatments of solvent by implicit meth-ods (84) are likely to play a role here. Although simulations with explicit water molecules are the gold standard, implicit solvent models make possible the testing of hypotheses by repeated simulations (e.g., with different mutants and兾or with different constraints) for larger systems. Given the availability of several molecu-lar dynamics programs, molecu-large amounts of computer time, and examples for which molecular dynamics has really played a role in furthering our understanding of protein functions, we look forward to a wide field of biological applications for molecular dynamics in the future.
We thank the National Energy Research Sci-entific Computing Center for supercomputing resources and Lore Leighton for preparing Fig. 4. J.K. thanks Matthew Young for many stimulating discussions regarding molecular dynamics. M.K. thanks M. Viloca-Garcia, J. Gao, and D. G. Truhlar for helpful discus-sions and collaboration on ref. 30, which forms the basis of the enzyme kinetics text.
1. Karplus, M. & McCammon, J. A. (2002)Nat. Struct. Biol.9,646–652.
2. Wang, W., Donini, O., Reyes, C. M. & Kollman, P. A. (2001)Annu. Rev. Biophys. Biomol. Struct.
30,211–243.
3. Hansson, T., Oostenbrink, C. & van Gunsteren, W. (2002) Curr. Opin. Struct. Biol. 12, 190 – 196.
4. McCammon, J. A., Gelin, B. R. & Karplus, M. (1977)Nature267,585–590.
5. Levitt, M. & Sharon, R. (1988)Proc. Natl. Acad.
Sci. USA85,7557–7561.
6. Mackerell, A. D., Jr. (2004)J. Comput. Chem.25,
1584–1604.
7. Price, D. J. & Brooks, C. L., III (2002)J. Comput.
Chem.23,1045–1057.
8. Young, M. A., Gonfloni, S., Superti-Furga, G., Roux, B. & Kuriyan, J. (2001)Cell105,115–126. 9. Case, D. A. (2002)Acc. Chem. Res.35,325–331. 10. Soares, T. A., Daura, X., Oostenbrink, C., Smith, L. J. & van Gunsteren, W. F. (2004)J. Biomol. NMR30,407–422.
[image:6.594.219.552.54.162.2]11. Krieger, E., Darden, T., Nabuurs, S. B., Finkel-stein, A. & Vriend, G. (2004)Proteins57,678–683.
12. Horita, D. A., Zhang, W., Smithgall, T. E., Gmeiner, W. H. & Byrd, R. A. (2000)Protein Sci.
9,95–103.
13. van Gunsteren, W. F. & Mark, A. E. (1998)
J. Chem. Phys.108,6109–6116.
14. Dobson, C. M. (2003)Nature426,884–890. 15. Cavalli, A., Ferrara, P. & Caflisch, A. (2002)
Proteins47,305–314.
16. Simmerling, C., Strockbine, B. & Roitberg, A. E. (2002) J. Am. Chem. Soc. 124, 11258 – 11259.
17. Wolynes, P. G. (2005)Philos. Trans. R. Soc.
Lon-don A363,453–467.
18. Dobson, C. M., Sali, A. & Karplus, M. (1998)
Angew. Chem.37,868–893.
19. Karplus, M. (1997)Fold Des.2,S69–S75. 20. Zhou, Y. & Karplus, M. (1999)Nature401,400–
403.
21. Islam, S. A., Karplus, M. & Weaver, D. L. (2002) J. Mol. Biol.318,199–215.
22. Gianni, S., Guydosh, N. R., Khan, F., Caldas, T. D., Mayor, U., White, G. W., DeMarco, M. L., Daggett, V. & Fersht, A. R. (2003)Proc. Natl.
Acad. Sci. USA100,13286–13291.
23. Nguyen, H. D. & Hall, C. K. (2004)Proc. Natl.
Acad. Sci. USA101,16180–16185.
24. Krivov, S. V. & Karplus, M. (2004)Proc. Natl.
Acad. Sci. USA101,14766–14770.
25. Zhou, R. (2003)Proteins53,148–161. 26. Rao, F. & Caflisch, A. (2004)J. Mol. Biol.342,
299–306.
27. Wolfenden, R. & Snider, M. J. (2001)Acc. Chem. Res.34,938–945.
28. Pauling, L. (1946)Chem. Eng. News24,1375–1377. 29. Schowen, R. L. (1978) in Transition States of Biochemical Processes, eds. Gandour, R. D. & Schowen, R. L. (Plenum, New York), pp. 77–114. 30. Garcia-Viloca, M., Gao, J., Karplus, M. & Truhlar,
D. G. (2004)Science303,186–195.
31. Villa, J. & Warshel, A. (2001)J. Phys. Chem. B105,
7887–7907.
32. Dinner, A. R., Blackburn, G. M. & Karplus, M. (2001)Nature413,752–755.
33. Fromme, J. C., Bruner, S. D., Yang, W., Karplus, M. & Verdine, G. L. (2003)Nat. Struct. Biol.10,
204–211.
34. Brooks, C. L., Karplus, M. & Pettitt, B. M. (1988) Proteins: A Theoretical Perspective of Dynamics,
Structure and Thermodynamics (Wiley, New
York).
35. Cui, Q. & Karplus, M. (2002)J. Phys. Chem. B106,
1768–1798.
36. Feierberg, I. & Åqvist, J. (2002)Theor. Chem. Acc.
108,71–84.
37. Joseph, D., Petsko, G. A. & Karplus, M. (1990)
Science249,1425–1428.
38. Kursula, I., Salin, M., Sun, J., Norledge, B. V., Haapalainen, A. M., Sampson, N. S. & Wierenga, R. K. (2004)Protein Eng., Des. Sel.17,375–382. 39. Schnell, J. R., Dyson, H. J. & Wright, P. E. (2004)
Annu. Rev. Biophys. Biomol. Struct.33,119–140.
40. Sawaya, M. R. & Kraut, J. (1997)Biochemistry36,
586–603.
41. Rod, T. H., Radkiewicz, J. L. & Brooks, C. L., III (2003)Proc. Natl. Acad. Sci. USA100,6980–6985. 42. Watney, J. B., Agarwal, P. K. & Hammes-Schiffer,
S. (2003)J. Am. Chem. Soc.125,3745–3750. 43. Cui, Q. & Karplus, M. (2002)J. Am. Chem. Soc.
124,3093–3124.
44. Billeter, S. R., Webb, S. P., Iordanov, T., Agarwal, P. K. & Hammes-Schiffer, S. (2001)J. Chem. Phys.
114,341–349.
45. Truhlar, D. G., Gao, J., Alhambra, C., Garcia-Viloca, M., Corchado, J., Sanchez, M. L. & Villa, J. (2002)Acc. Chem. Res.35,341–349. 46. Jonsson, T., Glickman, M. H., Sun, S. J. &
Klin-man, J. P. (1996)J. Am. Chem. Soc.118,10319– 10320.
47. Basran, J., Sutcliffe, M. J. & Scrutton, N. S. (1999)
Biochemistry38,3218–3222.
48. Tresadern, G., McNamara, J. P., Mohr, M., Wang, H., Burton, N. A. & Hillier, I. A. (2002)Chem. Phys. Lett.358,489–494.
49. Hammes-Schiffer, S. (2004) Curr. Opin. Struct. Biol.14,192–201.
50. Boyer, P. D. (1997) Annu. Rev. Biochem. 66,
717–749.
51. Abrahams, J. P., Leslie, A. G., Lutter, R. & Walker, J. E. (1994)Nature370,621–628. 52. Menz, R. I., Walker, J. E. & Leslie, A. G. (2001)
Cell106,331–341.
53. Kinosita, K., Jr., Adachi, K. & Itoh, H. (2004)
Annu. Rev. Biophys. Biomol. Struct.33,245–268.
54. Weber, J. & Senior, A. E. (2003)FEBS Lett.545,
61–70.
55. Itoh, H., Takahashi, A., Adachi, K., Noji, H., Yasuda, R., Yoshida, M. & Kinosita, K. (2004)
Nature427,465–468.
56. Aksimentiev, A., Balabin, I. A., Fillingame, R. H. & Schulten, K. (2004)Biophys. J.86,1332–1344. 57. Kagawa, R., Montgomery, M. G., Braig, K., Leslie, A. G. & Walker, J. E. (2004)EMBO J.23,2734– 2744.
58. Boyer, P. D. (1993)Biochim. Biophys. Acta1140,
215–250.
59. Antes, I., Chandler, D., Wang, H. & Oster, G. (2003)Biophys. J.85,695–706.
60. Bockmann, R. A. & Grubmuller, H. (2002)Nat. Struct. Biol.9,198–202.
61. Ma, J., Flynn, T. C., Cui, Q., Leslie, A. G., Walker, J. E. & Karplus, M. (2002)Structure (Cambridge,
MA, U. S.)10,921–931.
62. Yang, W., Gao, Y. Q., Cui, Q., Ma, J. & Karplus, M. (2003)Proc. Natl. Acad. Sci. USA100,874– 879.
63. Gao, Y. Q., Yang, W., Marcus, R. A. & Karplus, M. (2003)Proc. Natl. Acad. Sci. USA100,11339– 11344.
64. Bolhuis, P. G., Chandler, D., Dellago, C. & Gei-ssler, P. L. (2002)Annu. Rev. Phys. Chem. 53,
291–318.
65. Wang, H. & Oster, G. (1998)Nature396,279–282. 66. Cui, Q., Li, G., Ma, J. & Karplus, M. (2004)J. Mol.
Biol.340,345–372.
67. Martin, G. S. (2004)Oncogene23,7910–7917. 68. Pawson, T. & Nash, P. (2003)Science300,445–
452.
69. Sicheri, F., Moarefi, I. & Kuriyan, J. (1997)Nature
385,602–609.
70. Xu, W., Harrison, S. C. & Eck, M. J. (1997)Nature
385,595–602.
71. Yamaguchi, H. & Hendrickson, W. A. (1996)
Nature384,484–489.
72. Engen, J. R., Smithgall, T. E., Gmeiner, W. H. & Smith, D. L. (1999)J. Mol. Biol.287,645–656. 73. Arold, S. T., Ulmer, T. S., Mulhern, T. D., Werner,
J. M., Ladbury, J. E., Campbell, I. D. & Noble, M. E. (2001)J. Biol. Chem.276,17199–17205. 74. Laity, J. H., Dyson, H. J. & Wright, P. E. (2000)
J. Mol. Biol.295,719–727.
75. Nagar, B., Hantschel, O., Young, M. A., Schef-fzek, K., Veach, D., Bornmann, W., Clarkson, B., Superti-Furga, G. & Kuriyan, J. (2003)Cell112,
859–871.
76. Hantschel, O., Nagar, B., Guettler, S., Kretzschmar, J., Dorey, K., Kuriyan, J. & Superti-Furga, G. (2003)Cell112,845–857.
77. Brasher, B. B., Roumiantsev, S. & Van Etten, R. A. (2001)Oncogene20,7744–7752. 78. Druker, B. J. & Lydon, N. B. (2000) J. Clin.
Invest.105,3–7.
79. Schindler, T., Bornmann, W., Pellicena, P., Miller, W. T., Clarkson, B. & Kuriyan, J. (2000)
Science289,1938 –1942.
80. Nagar, B., Bornmann, W. G., Pellicena, P., Schindler, T., Veach, D. R., Miller, W. T., Clark-son, B. & Kuriyan, J. (2002)Cancer Res. 62,
4236 – 4243.
81. Radhakrishnan, R. & Schlick, T. (2004)Proc. Natl.
Acad. Sci. USA101,5970–5975.
82. Berneche, S. & Roux, B. (2001)Nature414,73–77. 83. Hummer, G. & Szabo, A. (2001)Proc. Natl. Acad.
Sci. USA98,3658–3661.