Brain
activity
detection
by
estimating
the
signal-to-noise
ratio
of
fMRI
time
series
using
dynamic
linear
models
Alicia Quirós
a,∗
, Simon
P. Wilson
b,
Raquel Montes Diez
c, Ana
Beatriz Solana
d,
Juan Antonio Hernández Tamames
caHospitalClínicoSanCarlos,Spain bTrinityCollegeDublin,Ireland cUniversidadReyJuanCarlos,Spain dGEGlobalResearch,Munich,Germany
a
r
t
i
c
l
e
i
n
f
o
a
b
s
t
r
a
c
t
Articlehistory:
Availableonlinexxxx
Keywords:
Bayesiananalysis Dynamiclinearmodels fMRI
Resting-state
Thiswork showsan example ofthe application of Bayesian dynamiclinearmodels infMRI analysis. Estimating the error variances of such a model, we are able to obtain samples from the posterior distributionof thesignal-to-noise ratio for eachvoxel,whichis used as acriterionfor thedetection ofbrainactivity.Thebenefitsofthisapproachare:(i)thereducednumberofparameters,(ii)themodel makesnoassumptionsaboutthestimulationparadigm,(iii)aninterpretablemodelbasedapproach,and (iv) flexibility.The performance ofthe proposed methodisshown bysimulations and furtherresults are presented on the application ofthe model for the analysis ofa real fMRIdata set, in order to illustratesomepracticalissuesandtocomparewithpreviouslyproposedtechniques.Theresultsobtained demonstrate the ability of the model to detect brain activity, even when the stimulus paradigm is unknown,constitutinganalternativetodatadrivenapproacheswhendealingwithresting-statefMRI.
©2015ElsevierInc.All rights reserved.
1. Introduction
During the last few decades, functional Magnetic Resonance Imaging (fMRI) has contributed to the development of a more profound knowledge of brain functioning in both neuroscience anddiseaseby providingameasureofbrainactivation,observing hemodynamicresponse.Thispaperdescribesa newapproach for determiningwhichpartsofthebrainshow activationinresponse toanendogenousorexogenousstimulusinbloodoxygenlevel de-pendent(BOLD)contrast[26]fMRIdata.
AfMRIstudy,whichcanbeinterpretedasathreedimensional movie of the brain, results in a vast amount of noisy data with acomplicatedspatiotemporal correlation structure. InBOLD fMRI statisticalanalysis,therearetwomainapproaches:datadrivenand modeldriven.The formerreducesthe wholespatiotemporal data setintocertainmultivariate componentswithsimilar characteris-tics.Bycontrast,thelatterfitsamodeltotheobserveddata,taking intoaccountthepriorinformationprovidedby neuroscientific ra-tionaleorpreviousexperiments.Thetwoapproachesaretherefore fundamentallydifferentinperspectiveandassumptions[20].
*
Correspondingauthor.E-mailaddress:[email protected](A. Quirós).
DatadrivenproceduresincludeIndependentComponent Analy-sis(ICA)[24,1],principalcomponentanalysis[9]andcluster anal-ysis[14,4],amongothers.Thesetechniquesattempttocharacterise reliable patternsinthe data,andrelate those patternsto physio-logical activity posthoc. As statedin Lindquist [21], while these methods provide a fair amount of flexibility, not containing any modelinformation,theycaptureregularitieswhateverthesource, and, therefore, they are highly susceptible to noise and compo-nentsareoftendominatedbyartifacts.
Regardingmodel drivenliterature,inference aboutbrain activ-ityinfMRIdataiscommonlyaddressedthroughtheGeneralLinear Model(GLM)analysis,introducedbyFristonet al.[10],inwhicha linear dependency ofthe BOLD signal and the hemodynamic re-sponsefunction(HRF)isassumed. Generally,thestimuluspattern isfitsimplyasabox-shapedwave, whichisthenconvolvedwith an HRF template. Several kernels have been considered for the HRF template, including Poisson[11], Gaussian [10], and gamma [19,2]. The convolution approach is attractive for its simplicity. However, it imposes restrictions to themodel, e.g. it forces anti-symmetry andmonotonicityon each halfcycle, asmentioned by Crellin,HastieandJohnstoneinthepublisheddiscussionsofLange andZeger[19].AsstatedbyLindquistandWager[22],among oth-ers,usingthecanonicalHRF inthegenerallinearmodelcanbea very restrictive assumption,commonly making model driven ap-proaches unable to analyse studies in which the subjectneither
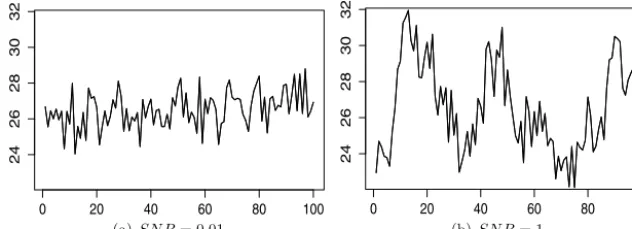
Fig. 1.Two examples of time series with different SNR.
undergoes a controlled stimulation nor performs a precisely de-fined task, asit is thecase ofresting-state studies in physiology andpathology.
Here we propose a less restrictive model driven approach, whichmakesnoassumptionsontheshapeoftheHRForthe stim-ulation paradigm presented during the experiment.In fMRI time seriesanalysis, an increase ofsignal followedby a slowdecayto baseline(orinactivitylevelinthecaseofresting-state)isgenerally expectedintheactiveregionsofthebrain.Hence,itisreasonable toassumethattheSNR,definedastheratioofthesignalvariance to the variance of the system noise, is larger foractive than for non-active voxels, dueto the signal fluctuationsobserved in the brain[8,3].The estimationof theSNR foreach voxelis therefore a keyfactor inthe detectionofbrain activity,forwhich we pro-pose the employment of dynamic linear models (DLM), under a Bayesianparadigm.
Takingintoaccountthequantityofdataandthat,inmostcases, wehavepriorinformationaboutactivity,Bayesianstatistics consti-tuteanidealframeworktocarryoutsignalandimageprocessing, beinga naturalbut rigoroustheory forcombining prior and ex-perimental information,see for instance Fitzgerald et al. [7] and Fitzgerald[6].AsstatedbyZhanget al.[35],whoprovideareview ofthemostrelevantBayesianmodelsforfMRIdataanalysis devel-opedin recentyears,Bayesian approacheshavegreatpotential in fMRI applications,asthey allow flexible modellingof spatial and temporalcorrelationinthedata[34].
In addition,DLM provides a very rich class ofmodels forthe analysis of time series data: see West and Harrison [33], the overviewby Migon et al. [25], andreferences therein.DLM con-sidersa timeseriesastheoutput ofadynamicsystemperturbed by random disturbances. They allow natural interpretation of a time series as the combination of several components, such as trend,seasonalorregressivecomponents.Therefore,theyare flex-ible enough tocapturethe mainfeatures of awide range of dif-ferentdata. Atthe sametime, they havea powerfulprobabilistic structure, allowing manyof the relevantinferences tobe carried outexactlyusingtheKalmanfilter[18].Thuscomputationscanbe implemented by recursive algorithms, computing the conditional distributionofthequantitiesofinterest,giventheavailable infor-mation.Inthissense,theyarenaturally treatedwithinaBayesian framework.
Therestofthepaperisstructured asfollows:inSection 2we formally state the model, Section 3 outlines the algorithm im-plemented to make inferences about the unknown parameters, Section 4 presents the results obtained forsimulations fromthe model, simulated data, anda real data set and Section 5 is de-votedtoconclusionsandfuturedirectionsofresearch.
2. The model
LetusassumethatthetimeseriesforavoxelinafMRI study, y1:T
= {
yt}
t=1,...,T,followsaconstantDLMdefinedbyyt
=
μt
+
vt,
vt∼
N
(
0,
V)
(1)μ
t=
Gtμ
t−1+
wt,
wt∼
N
(
0,
W=
r V)
(2)where V andW are unknownconstants andtheerrorsequences areindependent,bothwithinandbetweenthem.
Equation (1)is calledtheobservationequation for themodel, defining the sampling distribution for yt conditional on the level,
μ
t.Notice that,givenμ
t, yt isindependentofalltheother observationsandparametervalues.Equation(2)istheevolution,stateorsystemequation,defining the time evolution of the signal level. The conditional indepen-dencepropertyshowsaone-step Markovevolution sothat,given
μ
t−1 andthevaluesofGt andW,μ
t isindependentofthepast. Thatis,givenμ
t−1,thedistributionofμ
t isfullydetermined inde-pendentlyofvaluesof yt−1 andthelevelvaluesandobservations prior totimet−
1.Thedeterministiccomponentoftheevolution isthetransitionfromstateμ
t−1toGtμ
t−1,alineartransformation ofμ
t−1.HereweassumethatGt isknown,andfollowingthe rec-ommendationsofPetriset al.[28] tooptimisetheperformanceof thealgorithmused(seeSection3)forthemodelproposed,we de-fineGt=
G=
0.
9,leadingtoan autoregressive modelforthelevel oftheseries.TheSNR foreach voxel,definedastheratioofthesignal vari-ance to thevariance ofthesystemnoise, canbe estimatedusing thisDLMmodelas
r
=
WV (3)
which isa broadly acceptedmeasure forcomparingperformance characteristicsbetweendifferenttimeseries[33,28].Twoexamples oftime serieswithdifferentSNRare showninFig. 1.Alow SNR, likein(a),leads toatypicallocallyconstantlevel,whereasin(b) theSNRis100timeslarger,resultinginmuchgreatervariationin thelevel.
As we are interested in estimating the unknown parameters of the model –
μ
t, V, W – a fully Bayesian analysis is devel-oped. The model is then completed with the initial information aboutthelevelattimet=
0 thatdescribesourpriorbeliefsaboutμ
0,V,andW.Inparticular,assume thatprior informationabout theunknownparametersisavailableandsummarisedbyagamma distribution forφ
=
V−1, aGaussian distributionforμ
0 and, fol-lowing the recommendationsof Gelman[12],a log normalprior distribution forW.Formally,define prior distributionsforμ
0, V,andW by
μ
0∼
N
(
m0,
C0)
(4)φ
∼
G
(
αV
, β
V)
(5)W
∼
logN
(
mW,
σ
W2).
(6)Onthecontrary,theposteriordistributionofW conditionalon
μ
t andV doesnothaveaknownform,W
|
μ
0:T∝
W−T
2−1exp
−
1 2σ
2W
(
log(
W)
−
mW)
2×
exp−
1 2WT
t=1
(
μt
−
Gtμ−1)
2.
Lastly,letRt
=
G2Ct−1+
W,andQt=
Rt+
V,thentheposterior distributionofμ
t attimet isrecursivelydefinedbyμt
|
yt,
μt
−1,
V,
W∼
N(
mt,
Ct)
withmt
=
Gμ
t−1+
QRtt(y
t−
Gμ
t−1) andCt=
Rt−
Rt
Qt
2Qt (see WestandHarrison[33]forfurtherdetails).
3. Calculation
ForeachfMRIexperiment,theanalysisisperformedona slice-by-slicebasis,andonlythosevoxelsinsidethebrainareanalysed. Firstly,eachvoxel’stimeseriesisstandardisedsothatitsvariance is1anditsmeanis0.
WhenGt,V,andW are known,theKalmanfilter[18] canbe usedtoperforminferenceaboutthelatentprocess
μ
t.Inpractise theseparametersareunknownandnumericalintegrationmethods, suchasMCMC,arerequiredfortheBayesianstatisticalanalysis.Inourcase,thesetofunknown parameterscanbepartitioned intwoblocks:V andW;and
(
μ
1,. . . ,
μ
T)
.Inparticular,following Petris et al. [28], we use a Gibbs sampling schemefor posterior inference,infoursteps:(1) DrawV(k)fromp(V
|
μ
(k−1)0:T
,
y1:T)
,asdefinedinequation(7); (2) Drawμ
(0k:)T from p(μ
0:T|
V(k),
W(k−1),
y1:T)
;(3) SimulateW(k) fromfullconditionaldensityofW given
μ
(0k:)T, (4) Obtainr(k)=
W(k)V(k),
where the superscript (k) indicates the sample. Step (1) is a Gibbssamplingstep for V; forstep (2),we usethe Forward Fil-tering Backward Sampling (FFBS) algorithm, using the functions
probability ofany event ofinterest. Forinstance, the probability thattheSNRofatimeseriesisabovesomethreshold,
P
(
r>
r0|
y)
=
1 Kk
I r(k)
>
r0.
(8)Wedecidethevalueofthisthreshold,r0,basedonthecontrol ofthefalsediscoveryrate,asexplainedinGenoveseet al.[13].For the N voxelsbeingtested,theprocedureisasfollows:(i)selecta bound,q,forthefalsediscoveryrate;(ii)ordertheprobabilities,in ourcase, p
=
1−
P(r
>
r0|
y),and(iii)findthelargesti forwhich p(i)≤
Niq
c(V),where
(i)
denotestheorderingindex. Inthe discus-sion,Genoveseet al. [13]give recommendationsonthechoice of qandc(V)
intheframeworkofneuroimagingdataanalysis.4. Results
4.1. Simulationsfromthemodel
Wesimulateadatasetfrommodelequations(1)and(2),using differentvaluesforr
=
WV,rangingfrom10to0.01.Foreachvalue ofr,wesimulated10timeseriesoflength T=
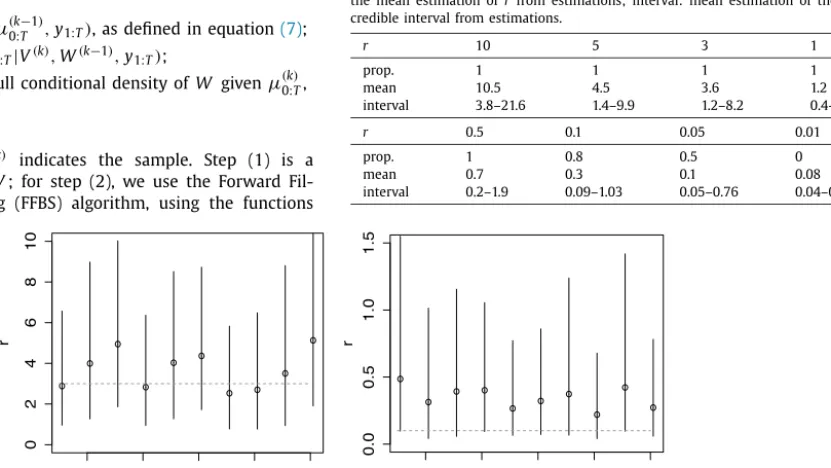
50.Table 1shows the proportion of times that the model proposed recovered the valueofr(includedintheposterior95%credibleinterval)and,for each value ofr,a summary ofthe meanestimations ofr andof the95%credibleintervalsobtainedforeachsimulatedtimeseries. Fig. 2showstwoexamplesoftheperformanceofthemodelfor twodifferentvaluesofr.Table 1
Simulationsfromthemodel.r:Valuesofrconsidered;prop.:Proportionoftimes thatthemodelproposedrecoversthecorrespondingvalueofr;mean:summaryof themeanestimationofrfromestimations;interval:meanestimationofthe95% credibleintervalfromestimations.
r 10 5 3 1
prop. 1 1 1 1
mean 10.5 4.5 3.6 1.2
interval 3.8–21.6 1.4–9.9 1.2–8.2 0.4–2.7
r 0.5 0.1 0.05 0.01
prop. 1 0.8 0.5 0
mean 0.7 0.3 0.1 0.08
[image:3.612.145.561.490.724.2]interval 0.2–1.9 0.09–1.03 0.05–0.76 0.04–0.42
Fig. 3.Simulated time series corresponding to an active and a non-active voxel.
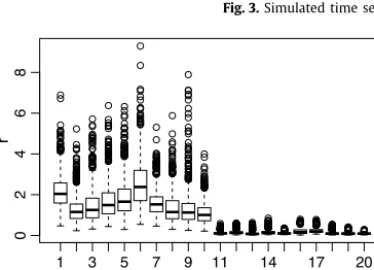
Fig. 4.BoxplotofrsamplesforeachofthesimulatedfMRItimeseries.Eachbox plotcorrespondstoonesimulatedtimeseries,wheresimulatedseriesfrom1to10 areactive–correspondingtothetenboxplotsintheleft–andsimulatedseries from11to20arewhitenoise–correspondingtothetenboxplotsintheright.
Asr isameasureoftheSNR ofthetime series,itisexpected thatthealgorithmfailstorecoverthesignalthelowerr is.When r
=
0.
01,wecheckedthat,evenifthetruevalueisnotincludedin theinterval,valuesoftheestimatedraresmall.A robustness study with respect to the prior hyperparame-terschoice wasperformedobserving thatthe procedureprovides similar results withall the options considered. In particular, we assess the performance of the model by changing the values of
α
V=
β
V=
1,
10,
100.Choosingan informativeprior,asdefinedbyα
V=
β
V=
1,leadsto slightlypoorerrecoveryforthelowest val-uesofr.4.2. SimulatingfMRIdata
Inordertocheck theabilityofthemodelofdetectingactivity, we simulate10 active voxels and10 non-active ones, using the
fmri
R library [31]. An exampleof each group oftime series is showninFig. 3.Wefirst standardisethetime series,thenfit themodeltothe dataandfinallysavethesamplesofr foreachsimulatedtime se-ries,fromwhichwecompute themeanand95% credibleinterval andthe P
(r
>
r0).The threshold r0 iscomputed asexplained at theendofSection3.TheresultsobtainedcanbecheckedinFig. 4 andinTable 2.Fromtheseresults,wecanconcludethatthemodelgivesriseto highervaluesofrinactivevoxels,showingitsabilitytodistinguish betweenactiveandnon-activevoxels.
4.3. Realdata
With the aim of illustrating that the model proposed can be usedforanalysingchallengingrealfMRIdata,weapplythemodel toa studypreviously analysed inSolanaet al.[30].In thatwork, twocryptogenicgeneralised epileptic(CGE)Fixation-offSensitivity (FoS)females (32 and18 years) underwent a simultaneous EEG-fMRI scan session. Based on the previous knowledge about FoS andonprevious clinicalstudies, thehypothesis ofthatwork was
thatthealteredbrainrhythms(EEG)intheseepilepticpatients af-fect theorganisation oftheir resting-state networks(fMRI),when closingtheeyesorlosingfixation.Inordertoestimatethe resting-statenetworks, twofMRIserieswereperformed:resting-state un-der (A) open-eyes and (B) closed-eyes (120 images each) condi-tions, as thesetype ofpatients are expectedto behave normally whentheireyesareopen.InSolanaet al.[30]ICAonthe resting-state fMRI series was applied using the MELODIC toolbox [1] in FSL,whichisconsideredthegoldstandardtechniqueforanalysing resting-statefMRItimeseries.Itisimportanttonotethat,although theconditionofinterestwasclosed-eyes,theopen-eyesstudywas requiredbytheusedICAmethodologyasthecontrolcondition.
4.3.1. Thedata
In this work, we apply the model to the closed-eyes resting-state studyofone ofthepatientspresented inSolana et al.[30]. The MRI data were collected at the Research Center for Neu-rological Diseases Foundation using a General Electric Signa 3.0 T MR scanner (General Electric Healthcare, Milwaukee, WI) us-ing a whole-bodyradiofrequency (RF)coilsignal excitation anda 8-channel brain coilforreception. fMRI data were acquiredwith continuous Gradient-Echo EPI sequence (2.4 mm slice thickness, gap between slices
=
0.3 mm, 96×
96 matrix, FoV=
22 cm, TE=
28.4 ms, TR=
2.88 s,flip angle=
83◦,completeframe 36 slices). The subjectwas instructed to be relaxedwithout moving the eyes and not to fall asleepduring the closed-eyescondition. TheMRstructuralimageswereacquiredthroughahigh-resolution 3DT1-weightedSPGR(SpoiledGradientRecalledecho)sequence.AsinSolanaet al.[30],thepreprocessingofthedatawas per-formedusingFSLsoftwarepackage[17].TheEPIwereslice-timing corrected, realignedto the middlevolume ofthe fMRI series us-ing McFLIRTalgorithm [16],andhigh-pass filtered(100 seconds), andtheskullwassubtractedusingtheBETtool[29].Next,images were coregistered to the individual 3D T1 structuralimage, nor-malised toMNI152 2 mmtemplateandsmoothed usinga6 mm FWHM.Notethatthesamepreprocessingwasusedinboth analy-sis,althoughthenormalisation toMNIisnotrequiredfora single-subjectanalysis.
4.3.2. Results
Inorderto obtainamap ofactivitywe followthe recommen-dations in Genovese et al. [13], defining c(V
)
=
1 and q=
0.
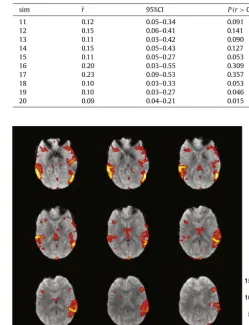
05 andcontrolthattheexpectedfalsediscoveryrateislowerthanq. Therefore, we calculatethe posterior probability that r is greater than 0.25, anddepict onlythose voxels wherethat probability is greater than0.995. Fig. 5 presentsthisposteriorprobability map. As stated previously, thispermits a numericalquantification and characterisation oftheactivationpattern. Asexpected, the activa-tionmapismainlycomposedbytemporo-frontalareas,aswellas byparietalareas,brainregionsrelatedtoattentionalprocesses.4.3.3. ComparisonwithICA
6 2.57 0.88–5.33 1.000
7 1.61 0.69–3.29 1.000
8 1.35 0.50–3.15 1.000
9 1.32 0.44–3.52 1.000
10 1.09 0.31–2.33 0.995
16 0.20 0.03–0.55 0.309
17 0.23 0.09–0.53 0.357
18 0.10 0.03–0.33 0.053
19 0.10 0.03–0.27 0.046
20 0.09 0.04–0.21 0.015
Fig. 5.Posteriorprobabilitymapofactivation,P(r>0.25)≥0.995,forthecentral slices(12–20)ofthestudy.(Forinterpretationofthe referencestocolorinthis figurelegend,thereaderisreferredtothewebversionofthisarticle.)
showstheindependent componentexplaining5% ofthe variance ofthetimeseriesthatwasidentifiedasbiologicallyplausible net-workwiththehighestamplituderestinglow-frequencyfluctuation (seventhcomponentordering from highestexplained variance to lowestvariance).Inthesefigures, itcanbe appreciatedthat both techniquesleadtothesameactivitymap.Thisisnotsurprisingas theactivitymapsprovidedby ICAarea measureoftheSNR (see McKeownet al. [24] fora detaileddescription or Martínezet al. [23]forabriefexplanation).
Themethodpresentedachievessimilarresultstothose ofICA, usingasimplerapproachthat doesnotrequirehumaninteraction andadvanced expertise of the final user and, in addition, using only one of the two fMRI series required by ICA. On the other hand,ICA methodology is able to detect other resting-state net-works. Nevertheless, with the approach presented here, we are ableto directlyestimate the mostclinicallyrelevant resting-state network,whichissimilartothatidentifiedbycliniciansusingICA –underthepointofviewofthestudiedpathology.
5. Conclusions
[image:5.612.309.559.88.414.2]ThisresearchdescribestheemploymentofDLMtoanalysethe timeseriesforavoxelinafMRIexperiment.Estimatingtheerror variancesof such a model and using Bayesian inference, we are abletoobtainsamplesfromtheposteriordistribution ofthe SNR forthatvoxel.Thisenablesustoprovidenotjustapointestimate oftheSNR for eachvoxel butalsoto compute theprobability of
Fig. 6.Resting-statenetworkobtainedbyICAanalysis(z>2.3,FWEcorrected)for patient1inSolanaet al.
[30]
.(Forinterpretationofthereferencestocolorinthis figurelegend,thereaderisreferredtothewebversionofthisarticle.)anyeventofinterest.Theresultsobtaineddemonstratetheability ofthemodeltodetectbrainactivity.
Thebenefitsofthisapproachare:(i)thereducednumberof pa-rametersintheDLM,(ii)themodelmakesno assumptionsabout the stimulation paradigm, (iii) a model based approach, hence more interpretable than a data driven one, and (iv) potential of includingawiderangeofotherfeatureslikespatialdependencies, linearorseasonaltrends,etc.,duetotheflexibilityofDLM.
In model driven approacheslike the GLM, a canonical HRF is oftenused. Accordingto Lindquist andWager[22], thiscan bea restrictiveassumption.As themodelproposedmakesno assump-tions on the shape of the HRF and allows a dynamic temporal modelling, it doesnot sufferfrommostof theissues that model basedapproacheshave.
[image:5.612.42.295.89.423.2]AlthoughHRFestimationisoutofthescopeofthiswork,which aimsataddressing theactivitydetectionproblem, itis important to note thatthe level,
μ
t,contains all the informationaboutthe HRF for each voxel. This allows us to compute any estimate of interest,asforexamplethemagnitudeoftheresponse,the time-to-peak,orthedurationofactivation.DLMisapowerfultool,unexploredintheanalysisoffMRIdata. InordertodealwithHRFestimation,other DLMcan beexplored as,forexample,dynamicregressionorseasonalmodels[32].
This work has several limitations. Firstly, this method relies on the identification of voxels with highSNR which, apart from neuronal activity, might in some cases carry SNR spatial depen-dency[5],orphysiologicalnoise[15].Itisthusimportanttocount on a neuroscientist for the clinical interpretation of the results. Secondly,detection ofactive voxels may be improvedby consid-ering spatial dependencies in the model. Future versions of our modelwillincludespatialpriorinformationinordertoperforma fullyBayesianspatiotemporalanalysisofthewholebrain. Thirdly, themodelisconcerned withsingle subjectdata.It isamatter of futureworktoextenditinordertoincorporateinformationfroma groupofsubjects.Multi-subjectfMRIdataisintrinsically hierarchi-calinnature and,therefore,Bayesianinference isanideal frame-work for performing it. Lastly, the modelis applied to a dataset acquiredwitha3TMRscanner.Furtherworkisneededonthe ap-plicabilityofthemethodtoscannerswithothermagneticfieldsor its dependenceon fMRI acquisition parameters, if itis to be ap-plied for supporting clinical decisions. It is important to remark againthat, in the interpretationof the resultsobtained, itis the joboftheneuroscientisttorecognise thosepatternsthat are gen-uinelyneuronalandrelevantforthepatientunderstudy.
Acknowledgments
This work was funded by the grant Tec2012-39095-C03-01 fromtheMinistryofEconomy andCompetitiveness (Spanish Gov-ernment) and by the Trinity College Dublin Visiting Professors Fund and by Insight Centre for Data Analytics, Grant Number SFI/12/RC/2289. Theauthorswouldlike tothankJ.ÁlvarezLinera (Neuroradiology,HospitalRuberInternational,Madrid,Spain),and A. Gil-Nagel, R. Toledano, I. García Morales, andV. San Antonio-Arce (Epilepsy Program, Hospital Ruber International, Madrid, Spain)for fMRI acquisition andepilepticpatient recruitment and discussion.
References
[1]C. Beckmann, S. Smith, Probabilistic independent component analysis for functionalmagneticresonanceimaging,IEEETrans.Med.Imaging23(2004) 137–152.
[2]G.Boynton,S.Engel,G.Glover,D.Heeger,Linearsystemsanalysisoffunctional magneticresonanceimaginginhumanv1,J.Neurosci.16(1996)4207–4221. [3]R.L. Buckner,J.R. Andrews-Hanna, D.L.Schacter,Thebrain’s defaultnetwork
anatomy,functionandrelevancetodisease,Ann.N.Y.Acad.Sci.1124(2008) 1–38.
[4]K.Chuang,M.Chiu,C.Lin,J.Chen,Model-freefunctionalMRIanalysisusing Kohonen clusteringneuralnetworkandfuzzyCmeans,IEEETrans.Med. Imag-ing18(1999)1117–1128.
[5]O.Dietrich,J.G.Raya,S.B.Reeder,M.F.Reiser,S.O.Schoenberg,Measurement ofsignal-to-noiseratiosinMRimages:influenceofmultichannelcoils, paral-lelimaging,andreconstructionfilters,J.Magn.Reson.Imaging26 (2)(2007) 375–385.
[6]W.Fitzgerald,MarkovchainMonteCarlomethodswithapplicationstosignal processing,SignalProcess.81 (1)(2001)3–18.
[7]W.Fitzgerald,S.Godsill,A.Kokaram,J.Stark,Bayesianmethodsinsignaland imageprocessing,in:Bayesian Stat.,vol. 6, OxfordUniversityPress,Oxford, 1998,pp. 239–254.
[8]M.Fox,M.Raichie,Spontaneousfluctuationsinbrainactivityobservedwith functionalmagneticresonanceimaging,Nat.Rev.Neurosci.8(2007)700–711. [9]K.Friston,Functionalandeffectiveconnectivityinneuroimaging:asynthesis,
Hum.BrainMapp.2(1994)56–78.
[10]K.Friston,A.Holmes,J.Poline,P.Gransby,S.Williams,R.Frackowiak,R.Turner, AnalysisoffMRItimeseriesrevisited,NeuroImage2(1995)45–53.
[11]K.Friston,P.Jezzard,R.Turner,AnalysisoffunctionalMRItime-series,Hum. BrainMapp.1(1994)153–171.
[12]A.Gelman,Priordistributionsforvarianceparametersinhierarchicalmodels, BayesianAnal.1 (3)(2006)515–533.
[13]C.Genovese,N.Lazar,T.Nichols,Thresholdingofstatisticalmapsinfunctional neuroimagingusingthefalsediscoveryrate,NeuroImage15(2002)870–878. [14]C.Goutte,P.Toft,E.Rostrup,F.Nielsen,L.Hansen,OnclusteringfMRItime
series,NeuroImage9(1999)298–310.
[15]X.Hu,T.H.Le,T.Parrish,P.Erhard,Retrospectiveestimationandcorrectionof physiologicalfluctuationinfunctionalMRI,Magn.Reson.Med.34 (2)(1995) 201–212.
[16]M.Jenkinson,P.Bannister,J. Brady,S.Smith,Improvedoptimisationfor the robustandaccuratelinearregistrationandmotioncorrectionofbrainimages, NeuroImage17 (2)(2002)825–841.
[17]M.Jenkinson,C.Beckmann,T.Behrens,M.Woolrich,S.Smith,FSL,NeuroImage 62(2012)782–790.
[18]R.Kalman,Anewapproachtolinearfilteringandpredictionproblems,J.Basic Eng.,Ser.D82(1960)35–45.
[19]N.Lange,S. Zeger,Non-linear Fouriertimeseries analysisfor humanbrain mappingbyfunctionalmagneticresonanceimaging,Appl.Stat.46(1997)1–29. [20]N.Lazar,TheStatistical AnalysisofFunctionalMRIData,Springer-Verlag,New
York,2008.
[21]M.Lindquist,ThestatisticalanalysisoffMRIdata,Stat.Sci.23(2008)439–464. [22]M.Lindquist,T.Wager,Validityandpowerinhemodynamicresponse model-ing:acomparisonstudyandanewapproach,Hum.BrainMapp. 28(2007) 764–784.
[23]K. Martínez,A.B. Solana,M. Burgaleta, J.A.Hernández-Tamames, J. Álvarez-Linera,F.J.Román,E.Alfayate,J.Privado,S.Escorial,M.A.Quiroga,S.Karama,P. Bellec,R.Colom,Changesinresting-statefunctionallyconnectedparietofrontal networksafter videogamepractice, Hum. BrainMapp. 34 (12) (2013Dec.) 3143–3157.
[24]M.McKeown,S.Makeig,G.Brown,T.Jung,S.Kindermann,A.Bell,T.Sejnowski, AnalysisoffMRIdatabyblindseparationintoindependentspatialcomponents, Hum.BrainMapp.3(1998)160–188.
[25]H.Migon,D.Gamerman,H.Lopes,M.Ferreira,DynamicModels,Handbookof Statistics,vol. 25,Elsevier,2005.
[26]S.Ogawa,T.Lee,A.Kay,D.Tank,Functionalbrainmappingbyblood oxygena-tionlevel-dependentcontrastmagneticresonanceimaging.Acomparisonof signalcharacteristicswithabiophysicalmodel,Biophys.J.64(1990)803–812. [27]G.Petris,AnRpackagefordynamiclinearmodels,J.Stat.Softw.36 (12)(2010)
1–16.
[28]G.Petris,S.Petrone,P.Campagnoli,DynamicLinearModelswithR,Springer, NewYork,2009.
[29]S.Smith, Fastrobust automated brainextraction,Hum.BrainMapp. 17 (3) (2002)143–155.
[30] A.B. Solana, K. Martínez, J.A. Hernández-Tamames, V.S. Antonio-Arce, R. Toledano, I. Garcia-Morales, J. Álvarez-Linera, A.Gil-Nagel, F. delPozo, Al-tered brain rhythms and functional network disruptions involved in pa-tients with generalised fixation-off epilepsy, Brain Imaging Behav. (2015), http://dx.doi.org/10.1007/s11682-015-9404-6.
[31]K.Tabelow,J. Polzehl,Statisticalparametricmapsforfunctionalmri experi-mentsinR:thepackagefmri,J.Stat.Softw.44 (11)(2011).
[32]M. West, Bayesian inferencein cyclical componentdynamic linear models, J. Am.Stat.Assoc.90(1995)1301–1312.
[33]M. West, J. Harrison, Bayesian Forecasting and Dynamic Models, Springer-Verlag,NewYork,1997.
[34]M.Woolrich,BayesianinferenceinfMRI,NeuroImage62(2005)801–810. [35]L.Zhang,M.Guindani,M.Vannucci,BayesianmodelsforfMRIdataanalysis,
Comput.Stat.7(2014)21–41.
AliciaQuirósiscurrentlyaresearcheratHospitalClínicoSanCarlos, Madrid.ShereceivedherMathematicsdegree in2003fromUniversidad Autónoma de Madrid and herPh.D. from Universidad Rey Juan Carlos, Madrid,wheresheworkedasassistantprofessoruntil2012.Herresearch ismainlyfocusedontheapplicationsofBayesianstatisticstobiomedical signalsandimages.
SimonP.WilsonisaprofessorintheSchoolofComputerScienceand Statistics,TrinityCollegeDublin,andafundedinvestigatorintheInsight Research Centre for Data Analytics. He received his Ph.D. in stochastic modelling from the George WashingtonUniversity, WashingtonDC. His researchinterestsare inBayesian methodsappliedto complexdataand addressingthescaleabilityofBayesianmethodsinvariousapplications.