The supply chain management is quite complex and comprises several aspects and viewpoints, all of which have an ultimate goal, though: delivering the finished product to the client as soon as possible and at the lowest cost. Among the activities of the supply chain, it is important to highlight the maintenance, and more specifically the spare parts and tools. In a nutshell, the challenges to meet are: a quick and reliable delivery, under the minimum costs of the spare parts inventory.
According to Bányai et al. (2015), those who attempt to optimize the maintenance management, consider that one of the basic points of improvement is the link between maintenance and the process of purchasing the necessary materials to conduct it.
In the companies with intermittent or stationary productions, it is necessary to use the risk analysis of the supply chain (Dolgui et al. 2008). For that pur-pose, it is necessary to influence the management of the spare parts inventories and thus to minimize the
extra costs. Likewise, it is possible to minimize the risk impact in the supply management.
At present, new concepts have been coined concern-ing the optimization of the supply chain management, exemplifying the management of spare parts and the logistic chain (Fabry and Schmitz-Urban 2010). The problems of the insufficient maintenance are due to the lack of spare parts, a poor servicing of the equip-ment or personnel. All of that can result in failures or breakdowns. Minimizing the time of the maintenance system and, on the other hand, assuring the costs of the supply chain, can result in a proper prevention of the failures (Zuccolotto et al. 2013).
Companies need to develop global supply service mechanisms. According to these services, a resulting high service quality is likely to happen, but also, a short response time towards the needs of the client and a low price are expected. By reducing the life-cycle of the products, the companies are forced to focus on the service they provide as an improvement
Integration of the SMED for the improvement of the
supply chain management of spare parts in the food
sector
Jorge LOZANO
1, Juan Carlos SAENZ-DIEZ
2, Eduardo MARTINEZ
1,
Emilio JIMENEZ
2, Julio BLANCO
1*
1Department of Mechanical Engineering, University of la Rioja, Logrono, Spain 2Department of Electrical Engineering, University of la Rioja, Logrono, Spain *Corresponding author: julio.blanco@unirioja.es
Lozano J., Saenz-Diez J-C., Martinez E., Jimenez E., Blanco J. (2017): Integration of the SMED for the improvement of the supply chain management of spare parts in the food sector. Agric. Econ. – Czech, 63: 370–379.
Abstract:Th eSingle Minute Exchange of Die (SMED) methodology is well-known. A great variety of studies in the fi eld of manufacturing and production process use it, but there are few applications of this methodology in the area of the supply chain management. In the paper, the philosophy of the SMED methodology is applied to the part of the supply chain that includes the spare parts and fi xtures in the food sector. Th is involves studying the relationship with the supplier of the in-stallation of spare parts and fi xture on the machine. Th e study shows how the spare parts management has several phases: the coordination and purchase of the spare parts to the supplier, the storage of these spare parts, the coordination of these spare parts and the scheduled maintenance, and the installation of these spare parts on the machine. Th e implantation of the developed working methodology has obtained a relevant improvement in the coordination and management of the spa-re parts. In such a way, that storage time has been spa-reduced (inside the company’s storages) and the performance has been increased, focusing on and detailing the maintenance task and scheduling the available resources.
compared to other companies (Hansen and Bönker 2014; Jiang et al. 2014; Sayem et al. 2014; Bojar et al. 2015).
The main goal of this research is the optimization of the spare parts management integrated in the supply chain by the means of the design of a work methodology using the Lean Manufacturing analy-sis tools, mainly the Single Minute Exchange of Die (SMED). Likewise, this work attempts to obtain an improvement both in economic and organizational results of the companies that have applied it.
The work methodology presented has been ap-plied in several factories of the food sector, more specifically in those where the main activity is the manufacture of food products based on cereals. This research has focused on the area of the spare parts and tools management of a factory, in a way that the spare parts supply has been linked with their replacement in the machinery and the optimization of the process.
Spare parts
The service of the spare parts inventory manage-ment differs from that of the manufacture inventory management, mainly due to the specific function of the maintenance. Besides, the management of the spare parts supply demand proves to be more complex and differs from other productions. It is also important to highlight that both inventories share the information and play a role in the optimization of the effectiveness of the spare parts demand system. Kerkkänen and Huiskonen (2010) suggest that the prerequisites to predict the demand of spare parts depend, mostly, on the responsibility of the maintenance and on the fact whether it shares the supply chain or not. In general, the distribution structure distinguishes different paths to share the responsibility, from the point of view of the spare parts suppliers.
Klueber et al. (2009) affirm that the improvement of the spare parts supply chain is obtained by expand-ing the logistics through the Internet, based on the software as service solutions. As a result, it is pos-sible to integrate great operations across the globe with different infrastructures and environments that increase the total service to the client improving the delivery and distribution of the spare parts.
The spare parts from an external supplier must have a fixed delivery time. The optimization of the spare parts flow requires a classification according
to their level of importance within the quality that they provide (Boudhar et al. 2013).
Dombrowski and Weckenborg (2013) show the importance of the service of the suppliers in the calculation of the optimal spare parts stock level. They assert that the optimal stock level has a high dependence on the clients demand and influences the process in the terms of benefits. The challenege of adapting to the clients demands is another aspect to take into account in order to be competent. It is necessary to design the dynamic stock level and, with the help of the client, to determine the exact variation of the spare parts .
Inventory
The purchases and the real inventory of the ware-house play an important role in the fulfillment of the main manufacture process in an industrial company. To optimize it, regulations must be added to reduce the maintenance costs and carry out an uninter-rupted production; that is the main challenge of the industries. The effectiveness of the flow in the management of spare parts is essential to define the strategy to repair machinery and equipment. The selection of the strategy has a significant impact in the process of the spare parts purchase (Grondys et al. 2014). It is important to point out that the purpose of the spare parts inventory is to maintain the normal operation of the equipment; thus, the best indicator to measure the optimal spare parts inventory is the safety of the equipment, always below the total cost of the spare parts supply chain.
The reliability and the level of the spare parts inven-tory are the factors that determine the level of main-tenance in the machinery as long as the equipment is original in the manufacturers (Selçuk and Agrali 2013). Three different measurements of reliability are considered: An addition of the efficiency ratio, the average inactive time per system and per year, and a total study of long stops throughout the year.
MATERIALS AND METHODS
The methodology proposed (Figure 1) analyses separately the current situation of the spare parts management and the bases of the SMED methodol-ogy. In this way, it is possible to make a combination of both analyses and to define the premises that will remain in the management of spare parts within the maintenance schedule, both preventive and autono-mous. Once the two analyses have been combined and added to the maintenance management, it is necessary to monitor the indicators of the mean time between failures (MTBF), the mean repair time (MTTR) and the overall efficiency of the equipment (OEE in Spanish). Finally, the graphs resulting from the monitoring of parameters are interpreted, and if an overall im-provement is achieved, the study is considered to be satisfactory, and if it is not the case, the maintenance is applied again to make the necessary modifications.
The study is considered unsatisfactory and thus the combination of both techniques is revised again when
the graphs show a negative tendency and instead of an improvement, the conditions worsen.
Table 1 shows the basic criteria and variables where the proposed work methodology will be applied.
To correctly apply the inclusion criteria in factories which will implement the project, it is important that the lines or machines where it will be applied have executed at least 80% of the planned maintenance. The reason is that the machine failures due to other reasons than changes in the machine should be minimized, because otherwise, when a fault occurs, it cannot be determined whether it is due to the project related with the spare parts and tools or due to the lack of maintenance. In addition, the project will be imple-mented gradually, since in this type of factories it is common to have several thousand types of different spare parts, which requires that the implementation of a project to improve the supply chain tools and parts is consolidated step by step.
The inclusion criteria do not take into account the packaging and raw materials because the treatment in this type of factories is different for them. Both the packaging and raw materials have a more or less constant consumption, to the point that in some cases at the beginning of the year, it is possible to know the quantities that will be necessary of each of them; while with the spare parts it is not possible, because in addition to a much greater uncertainty, which leads to a more complex management, dealing with suppliers is differentiated and closer.
To show these data, a histogram-type graph is used, which allows showing the current data, objectives, long-term data, tendencies. The data is collected on a monthly basis.
[image:3.595.62.291.95.271.2]It is important to point out that the methodology requires the monitoring of the application of improve-ments and changes in management. The monitoring
Table 1. Application criteria
Criteria
Inclusion
Only those companies conducting at least 80% of the planned maintenance will be included. The spare parts and tools of one of the manufacture lines will be taken into account and once its objectives are obtained, the rest will be used gradually.
Exclusion The materials necessary for the consumption of the machinery will not be taken into account (Packaging, etc.) The raw materials of the productive process are excluded from the study.
Study variables
Parameters Global efficiency of the production line.Global efficiency of equipment.
[image:3.595.65.534.609.757.2]allows the analysis and evolution of the results of the selected values shown in the graphs.
Study parameters
Global Efficiency (GE)
It is the index that quantifies the global efficiency in the production of a line or equipment. It can be understood as the operation time of a line, adding it to the availability index of the planned stops and non-planned stops. It is a percentage where all the activities that occur in a line or equipment are meas-ured, while this line or equipment is available for use:
GE = PP + PNP +TO (1)
The variables being:
– PP: Planned Stops. Time during which the machinery or equipment is stopped in a planned way; during this time, the planned tasks are performed, which are necessary for the proper functioning of a line. – PNP: Non-planned Stops. The time during which
the line or equipment is stopped in an unplanned manner; this time is unforeseen and is used for the corrective tasks to bring the line back to its normal functioning and it increases the operational time. – TO: Operational Time: The time during which the
line or equipment is producing, that is, delivering good products.
Overall Efficiency of Equipment (OEE)
It is a percentage that allows measuring the pro-ductive efficiency of one or several machines. The OEE results from the multiplication of other three percentages, such as the availability, efficiency and quality. The OEE is one of the available measurements to optimize the manufacturing processes and it is related directly to the operation costs and informs on the losses and the process bottlenecks (stops/ failures, configuring and setup, short stops, speed reduction, production rejections, etc.) (Faccio 2013; Kemal Karasu et al. 2014).
Stops/failures and setups affect the availability. Short stops and the speed reduction affect the per-formance, and rejections due to a set in motion and the pro-production rejections affect quality.
Availability is the result of dividing the time dur-ing which the machinery has been producdur-ing by the time during which the machinery should have been
producing. The time during which the machinery should have been producing is the total time minus the periods when it was not planned to produce due to the legal issues, holidays, scheduled mainte-nances, cleaning reasons, etc., it is what comprises the planned stops.
Performance results from dividing the amount of parts produced by an equipment or line between the amounts of parts that could have been produced. The amount of parts that could have been produced is obtained by multiplying the production time by the capacity of the nominal production of the equipment.
Quality takes into account the product quality losses. It is measured in percentages of the satis-factory units with respect to the total number of manufactured units.
The units produced can be satisfactory, good, un-satisfactory, bad or rejections. Sometimes the unsat-isfactory units can be reprocessed and then turned into satisfactory units. The OEE only considers as good those units that are satisfactory for the first time, not the reprocessed ones.
Therefore, the quality results from dividing the good parts produced by the total of parts produced includ-ing the remanufactured parts or the rejected ones.
Anderon and Bellgran (2015) show how many manu-facture industries use the OEE as an example of what they use to measure and improve their processes. It is important to point out that the use of the TPM models by the manufacture industry based on the OEE is an optimal tool to measure the performance and how to use it (Binti Aminuddin et al. 2015; Bon and Lim 2015). Besides, if combined with the JIT, TPM IL6S, TQM and Six Sigma, the performance increases substantially (Cakmakci 2009; Jain et al. 2015; Olivella and Gregorio 2015).
Data quantified in the study
Mean Time between Failures (MTBF)
The mean time between failures influences both the confidence and availability of the equipment. Confidence is the capacity of the equipment of per-forming the required functions or works. And avail-ability is the degree of the functionality or accessibility of the equipment as such.
ap-proximately when the next failure will take place, and also focalize the tasks or actions to reduce that time.
In this article, it will be taken as an indicator of the failures frequency tendency throughout the develop-ment of the project.
The MTBF allows quantifying the parameters to improve the development of the product, obtain-ing models and developobtain-ing systems to protect the equipment against failures (Ellen et al. 2014; Iudean et al. 2014).
Mean Time to Repair (MTTR)
The MTTR is the time occupied by the failure repair in a machine or system specifically. This indicator implies several concepts, such as: difficulty of the repair work to be made, the availability of the nec-essary resources to solve the failure (technical staff, spare parts, tools, etc.), or if it is a common failure or one that occurs frequently (Galvan et al. 2013). Furthermore, it influences the availability, but not confidence. To conclude, to measure a failure, at a lower MTTR time, the system or machine is better because the repair time is lower and a reduction of the costs of maintenance and optimization takes place (Hoffa and Pawlewski 2015).
STUDY CASE
Context
The work methodology proposed has been ap-plied in several factories of the food industry. The production of foods based on cereals is divided into 6 interlinked stages: the transportation of raw ma-terials, the reception of raw mama-terials, the storage of raw materials, the processing and reconversion of foods, the preservation of the processed foods and the delivery of foods to the consumers.
Specifically, the factories studied the product pro-cess of the snacks sector (biscuits, cream sweets, and chocolates to eat between meals). The analysed process contemplates from the receipt of raw materials (flour, sugar, cocoa, oil, chocolate, etc.) to the processing of this raw material in the final product and its packaging process. These processes generate many production references. The sector analysed operates between 50 and 200 different references spread over approximately 40 different products. In the case studied, the number of the spare part references far exceeds 10 000.
Th e analysis of the human capital of the case study companies shows a great diversity in the academic train-ing and professional experience, from the experts on chemistry and food analysis to food engineering, food technology, production and lean manufacturing, etc.
The organizational systems of the companies pres-ent a great diversity and deficiencies, the majority do not have a department dealing with spare parts, that is, the mechanics themselves ask for the spare parts from the suppliers. These deficiencies foster an incorrect management since the relation with the suppliers is not always the same, the prices are not negotiated, etc. The most affected aspect, which actu-ally brings about this study, is that the maximum and minimum stocks are not controlled and the purchase of equipment is not coordinated with the planned maintenance activities (be it autonomous, preventive or predictive maintenance).
It is important to point out that the preventive maintenance conducted is not based on an optimized maintenance plan. That is, the equipment that has frequent maintenance does not have the tasks very well specified; they rely on the mechanic’s expertise to detect the deteriorated components, and once detected, if there is a spare part available, it is re-placed, and if there is no spare part in stock, it is requested from the supplier. This management has several disadvantages:
– Only the parts about to break or deteriorated are replaced.
– Reliance on the mechanic´s expertise and experience. – Lack of work preparation.
Another aspect is the lack of measurement. In the study case factories, no priorities have been estab-lished for the maintenance interventions to be made, causing a lack of the necessary spare parts for the given maintenance. There is no optimization of the management of spare parts, thus generating long storage periods; and of course, there is no preparation of the works, causing that the maintenance activities start with the components to be replaced not being set or prepared (lubricated, tested, etc.).
Application of the work methodology
The implementation of the methodology proposed starts by analysing separately the systems of the man-agement of spare parts and tools.
the minimum time possible in storage, are placed and functioning, thus optimizing the time and cost destined to those spare parts.
On the other hand, one of the tools of Lean Manufacturing will be used, the SMED, which is used to improve the changes of the equipment. In most occasions, the changes of equipment are understood as a change of format, a change of product, a change of material or tool, etc. But in this case, it will be used for the change of parts; that is, implemented in the technique of any kind of maintenance (preventive, autonomous, or corrective).
The idea is to minimize the necessary changes when performing the maintenance on the machines, guiding the management of spare parts, so that the preparatory work is considered essential.
Taking into account the various parts of the available methodology, they must be understood in this way: – First stage: Internal and external settings. The
ini-tial conditions of the situation of the spare parts management in detail. This is made by analysing the necessary spare parts, generating a list of spare parts for the machines, introducing the spare parts in the replacement tasks, deadline, participation of the spare parts suppliers in the organization of the maintenance tasks, the design of an automatic spare parts requisition system, etc.
– Second stage: Separating internal settings form the external ones. Domestic settings are those to be performed when the machines are stopped (search of the spare parts, the preparation of tools used for maintenance, contacting suppliers who provide the spare parts urgently, etc.). External settings are those that encompass all management tasks conducted before and after the machines have stopped (request for the spare parts needed before the maintenance, improvement of the flow of reception, replacements and delivery of the spare parts, upgrades to the replacement of parts, operators training, the inte-gration of suppliers, etc.). These are adjustments made with the machinery in operation.
– Third stage: Transformation of the internal adjust-ments into the external ones. It aims at eliminat-ing adjustments increaseliminat-ing the breakdown time: the lack of preparation or coordination, the non-simultaneousness of tasks, etc., and turn them into the external adjustments, that is, those adjustments must be conducted when the machines are operating (the optimization of spare parts, the replacement instructions, training, the improved planning of stops, the implication of suppliers, etc.).
– Fourth stage: Rationalization of all aspects related to settings. The aim of the last stage is to eliminate the maximum of settings. For that purpose, the management system must be run by itself insofar as possible. The idea is to create management strate-gies in a way that the different system tasks work as a chain within the global management system. This avoids the intervention of people and therefore the malfunctioning or lack of preparation. Some of the systems that must be created to avoid losses are: Personnel training system, automatic spare parts request system, negotiation of the price of spare parts at a long-term, planning and follow-up of the tasks to be conducted with machines while operating, including machinery suppliers so that they begin the maintenance strategies, etc.
The combination of the two techniques in the meth-odology developed provides a management method which optimizes the spare parts management within the supply chain.
Finally, once the model has been determined, it is applied to the management of maintenance (pre-ventive, autonomous, predictive and corrective). Subsequently, the stops are monitored to obtain the aforementioned graphs: the MTBF, MTTR and OEE. In this way, the improvement or not of the spare parts and tools management can be assessed and to what extent it has improved or not. In addition, if this condition is not met, the application of both methodologies in maintenance is reviewed.
RESULTS
As discussed above, the data monitored generates information that is transformed into the process indicators.
The first indicator used is the global efficiency of the system or equipment (GE). It is used in a way that the efficiency is monitored both when the ma-chines are operating and when they are stopped for the scheduled tasks. That is, in this way, the planned stops and non-planned stops are encompassed in one single indicator.
the machine stopped) are higher than the external adjustments (performed with the machine while op-erating); as the study unfolds and passes through the stage of making the internal adjustments into the external ones (third step of the SMED), better results are obtained, thus the results are obtained from period 3 onwards.
The next indicator used is the overall efficiency of the machinery or equipment (OEE). That is, the efficiency of such equipment is measured during the operation thereof excluding the instances when the equipment is stopped by a scheduled event.
Figure 3, which corresponds to the graph of the efficiency of the equipment not considering the un-planned stops, also shows an upward trend, as in the overall efficiency.
The operation of the machinery or equipment is closely related to the management of the spare parts, because it is very important not only changing the parts when necessary but also placing the appropriate spare parts and not copies or similar parts (both are the signs of a poor management of the spare parts). This is reflected in Figure 3, since when performing this optimization, it is shown in the results.
Although the months when the objectives are met do not have to coincide in the graphs of Figures 2 and 3,
they do so in this case, since the tasks conducted are closely related. That is, during the planned stops, only extra tasks of the improvement of the spare parts management have been added (in addition to those that occur always during the equipment stops). Since these tasks are closely related to the operation of the equipment, it can be seen that the objectives are met in the same month.
The mean time between the breakdowns or failures of a system or machine (MTBF) is measured con-sidering the total operating time in a defined period (shift, day, month, etc.) by the number of failures in that timeframe.
Figure 4, which represents the mean time between the failures, shows how the evolution of the indica-tor is favourable until it finds a balance in the final months of the measurement.
What can be drawn as a conclusion from this graph is that the quality of the management of spare parts and consequently the maintenance is better, since reaching all the improvements in the management of spare parts results in a higher stability at the time of working on the machines.
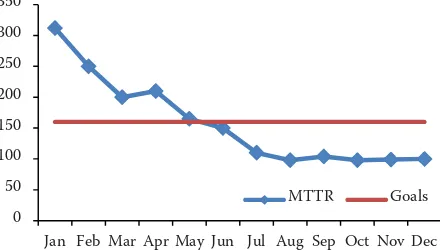
[image:7.595.307.525.96.222.2]The last indicator used is the mean time to repair (MTTR); it consists of monitoring the time it takes to make repairs on the machine or system studied,
[image:7.595.65.286.96.221.2]Figure 5. Mean time to repair
Figure 2. Global efficiency of the system Figure 3. Efficiency of the machinery and equipment
Figure 4. Mean time between the breakdowns or failures
64 66 68 70 72 74 76 78 80
Jan Feb Mar Apr May Jun Jul Aug Sep Oct Nov Dec
GE Goals
70 75 80 85 90 95
Jan Feb Mar Apr May Jun Jul Aug Sep Oct Nov Dec
OEE Goals
0 100 200 300 400 500
Jan Feb Mar Apr May Jun Jul Aug Sep Oct Nov Dec
MTBF Goals
0 50 100 150 200 250 300 350
Jan Feb Mar Apr May Jun Jul Aug Sep Oct Nov Dec
[image:7.595.67.286.612.739.2] [image:7.595.309.529.613.738.2]in a way that the measurement is made considering the time during which the machine is being repaired by the period of time defined.
Figure 5, which refers to the mean repair time when the equipment or machine is broken, shows the posi-tive evolution overtime.
If this is compared to Figure 3, it can be seen that it takes more time to meet the objectives. This makes sense because this graph deals mainly with the part of the unplanned stops, i.e. it is the response time when there is an unplanned stop in the machines and is generally higher than what implies Figure 3, which is the mean time between the stops, i.e., if the quality of management in the planned stops is improved, the mean time between the stops will improve.
All these indicators help to evaluate the progress and final results of the study, since with them, one can draw conclusions about whether the management of spare parts has improved or not by including it in the supply chain.
CONCLUSIONS
During this research, it has been seen that the com-panies from the productive sector analysed did not invest resources into the management of the spare parts and, let alone connecting this management with the supply chain. For this reason, the aim of the research was to apply the SMED tool, very common of the Lean Manufacturing, in order to optimize the supply chain and improve the management of the area of spare parts of these companies.
To begin with the study, firstly, the needs of these companies are identified facing the decadence and the lack of optimization of the spare parts management; besides, it has also been seen that there is not much connection with the supply chain per se.
For improved results, a work methodology that utilizes the tools used in the companies implement-ing the Lean Manufacturimplement-ing philosophy is developed, which is the SMED. The difference here is that in-stead of applying it to the machinery or equipment, it is applied to the whole system of the spare parts management.
By applying the SMED, the work methodology does not attempt to modify the machines or the methods of the machine repair, but to define the necessary steps to conduct the spare parts management and to optimize those steps. It is thus necessary to intervene with the organizational model, improving the
com-munication with suppliers, involving suppliers in the maintenance works, etc.
The results obtained are completely satisfactory, as all the objectives that were set at the beginning of the research have been met, as well as the stability in the results. The improvement, analysed through the parameters of the efficiency measurement, not only implies good economic results, but also enables a further inclusion of the tasks related to this study or other kinds of tasks to be conducted in the production lines to enable a further improvement. Likewise, the indicators of the repair time and the time between the unplanned stops can evolve positively in the results and continue to improve the objectives.
To apply this study, it is not possible to use just any tool of the Lean Manufacturing, since the point is to define the tasks properly, to organize and then to optimize them. Therefore, one of the main limi-tations of the study is the inability of using any tool that cannot be adapted to optimize the supply chain. This study can be applied in other productive con-texts since the tool used is quite versatile.
One of the main advantages of the methodology developed is that it allows improving what has al-ready been achieved. That is, more challenging goals must be set and then continue to apply such stud-ies. Therefore, the work methodology will further enhance the connection between the spare parts management and the supply chain and will improve the spare parts management per se; as well as the ability of applying it to other contexts and needs of the industry, such as: the optimization of the supply chain of commodities and materials, optimizing the organization of production, etc.
To conclude, it is easy to compare a factory that does not apply the tools of the Lean Manufacturing against another that does. The Lean Manufacturing not only provides tools, as in this case, where the essence of the SMED tool has been applied, but it is a working philosophy. The traditional manufactur-ing method does not apply any productive method of work; only the planning and scenario analysis are made, which results in several losses:
– The excess of the spare parts and the lack of the standardization of them.
– Parts that are not suitable for the planned task, since there are so many references to handle, the errors appear in the shipments, orders, storage, etc. – The lack of the staff to develop the maintenance. – The lack of the involvement of suppliers.
– Etc.
REFERENCES
Andersson C., Bellgran M. (2015): On the complexity of using performance measures: Enhancing sustained pro-duction improvement capability by combining OEE and productivity. Journal of Manufacturing Systems, 35: 144–154.
Bányai T., Veres P., Illés B. (2015): Heuristic supply chain optimization of networked maintenance companies. Procedia Engineering, 100: 46–55.
Binti Aminuddin N.A., Garza-Reyes J.A., Kumar V., An-tony J., Rocha-Lona L. (2016): An analysis of managerial factors affecting the implementation and use of overall equipment effectiveness. International Journal of Pro-duction Research, 54: 4430–4447.
Bojar W., Knopik L., Żarski J., Kuśmierek-Tomaszewska R. (2015): Integrated assessment of crop productivity based on the food supply forecasting. Agricultural Economics – Czech, 61: 502–510.
Bon A.T., Lim M. (2015): Total productive maintenance in automotive industry. In: Proceeding of 2015 International Conference on Industrial Engineering and Operations Management (IEOM 2015), Dubai, March 3–5, 2015. Boudhar H., Dahane M., Rezg N. (2013): A new inspection
heuristic for a condition-based maintenance policy in a spare part returns context. Proceedings of 2013 IEEE International Conference on Systems, Man, and Cyber-netics, SMC 2013, Oct 13–16, 2013: 1300–1305. Cakmakci M. (2009): Process improvement: Performance
analysis of the setup time reduction – SMED in the automobile industry. International Journal of Advanced Manufacturing Technology, 41: 168–179.
Dolgui A., Pashkevich A., Pashkevich M., Grimaud F. (2008): Forecasting risk analysis for supply chains with intermit-tent demand. International Journal of Risk Assessment and Management, 9: 213–224.
Dombrowski U., Weckenborg S. (2013): Determination of the spare parts demand for maintenance, repair and overhaul service providers. IFIP Advances in Information and Communication Technology, 414: 433–440. Ellen C., Böschen M., Peikenkamp T. (2014): MTBF
incon-sistency analysis on inferred product breakdown struc-tures. In: Bondavalli A., Ceccarelli A., Ortmeier F. (eds): Computer Safety, Reliability, and Security. SAFECOMP 2014. Lecture Notes in Computer Science, 8696: 108–118. Fabry C., Schmitz-Urban A. (2010): Maintenance supply
chain optimisation within an IT-platform: In: Proceedings of Network Service Science and Management, Interna-tional Conference on Management and Service Science (MASS 2010), Aug 24–26, 2010.
Faccio M. (2013): Setup time reduction: SMED – balanc-ing integrated model for manufacturbalanc-ing systems with automated transfer. International Journal of Engineering and Technology, 5: 4075–4084.
Galvan R., Rucabado J.J., Rubio Arvilla C.A. (2013): Impor-tance of preventive and predictive maintenance plan in reducing occurrences of failures (MTBF-MTTR) – Rod pumping systems: Hydro-pneumatic surface units, ex-perience in Mexico. In: 2013 SPE Artificial Lift Confer-ence – Americas: Artificial Lift, Cartagena, May 21–22, 2013: 161–168.
Grondys K., Kadlubek M., Starostka-Patyk M. (2014): The management of the inventories of facturing equipment spare parts in Polish industrial enterprises. In: Proceed-ings of 2014 International Conference on Advanced Lo-gistics and Transport (ICALT), May 1–3, 2014: 195–200. Hansen J.R., Bönker T. (2014): The next generation of flex-ible crane systems in wind turbine nacelles. In: Proceed-ings of European Wind Energy Association Conference and Exhibition 2014 (EWEA 2014), Barcelona, March 10–13, 2014: 303–313.
Hoffa P., Pawlewski P. (2015): Dynamic approach to mod-eling MTBF/MTTR in industrial and logistics systems. In: Nowakowski T. et al. (eds.): Safety and Reliability: Methodology and Applications. Taylor & Francis Group: 2085–2090.
Iudean D., Munteanu R., Dan Zaharia V., Dobra M. (2014): Reliability indicators analysis for the cam box module of industrial knitting machines. In: Proceedings of Power Engineering Conference (UPEC), 49th International Universities, Cluj, Sept 2–5, 2014.
International Journal of Quality and Reliability Manage-ment, 32: 503–516.
Jiang L., Cui X., Xu X., Jiang Y., Rounsevell M., Murray-Rust D., Liu Y. (2014): A simple global food system model. Agricultural Economics – Czech, 60: 188–197. Kemal Karasu M., Cakmakci M., Cakiroglu M.B., Ayva E.,
Demirel-Ortabas N. (2014): Improvement of changeover times via Taguchi empowered SMED/case study on in-jection molding production. Journal of the International Measurement Confederation, 47: 741–748.
Kerkkänen A., Huiskonen J. (2010): Responsibility sharing in the supply chain of Industrial maintenance. In: Pro-ceeding of 53rd Conference of the Operational Research Society 2011: 133–135.
Klueber R.G., McCann H., Wehrle R., Knopf T. (2009): Service innovation in spare parts logistics in the business aviation industry. In: 2009 IEEE Conference on Com-merce and Enterprise Computing, CEC 2009, Vienna, July 20–23, 2009: 317–323.
Olivella J., Gregorio R. (2015): A case study of an integrated manufacturing performance measurement and meeting
system. Journal of Manufacturing Technology Manage-ment, 26: 515–535.
Persson F., Saccani N. (2007): Managing the after sales logistic network – A simulation study of a spare parts supply chain. IFIP International Federation for Informa-tion Processing, 246: 313–320.
Sayem A., Islam M.A., Khan M.M.A. (2014): Productivity enhancement through reduction of changeover time by implementing SMED technique – In furniture industry. International Journal of Industrial and Systems Engi-neering, 17: 15–33.
Selçuk B., Agrali S. (2013): Joint spare parts inventory and reliability decisions under a service constraint. Journal of the Operational Research Society, 64: 446–458. Zuccolotto M., Pereira C.E., Hellingrath B., Frazzon E.M.,
Espíndola D., Henriques R.V.B. (2013): I2MS2C – in-telligent maintenance system architecture proposal. Chemical Engineering Transactions, 33: 241–246.