03A2037
Tools for integrating diagnosis in the design process
An application to the Common Rail air and fuel delivery systems
Luca Console, Gianluca Correndo, Claudia Picardi, Marino Segnan Dipartimento di Informatica, Università di Torino - Italy
Rosanna Bray, Alessandro Buffo, Fulvio Cascio, Paola Marchesini Centro Ricerche Fiat, Torino - Italy
Abstract. The development of diagnostic software is very critical in current generation automotive systems. However, the activities related to diagnosis (e.g., FMEA generation, analysis of diagnosability, generation of software to be embedded in the ECU) are usually not supported by specialized tools and, as a consequence, not strictly integrated with other design phases (e.g., design of control and definition of control strategies and software). In this paper we discuss how the design process can be re-organized including the activities above by using a set of tools which support the activities themselves. The work originated from the IDD1 project,
which was started in 2000 with the goals of bringing diagnostic related activities to the core of the design process, by providing designers with a set of tools to perform these activities. After sketching the re-engineered design process, we present the implemented tools and we briefly comment on the application to the common rail air and fuel delivery system.
1 INTRODUCTION
The importance of diagnosis in on-board automotive systems is constantly growing together with the complexity of the systems themselves. The average dimension of the diagnostic software inside a modern electronic control unit (ECU) is now more than 50% of the whole code. However, if one analyses the design process of any significant mechatronic automotive component, it is very common to see that diagnostic issues are usually taken into account only at the end of the process and are not integrated with the rest of it. In particular, during the critical phases of the design process, when the actual architecture of the system is conceptualized, the control strategies are defined and models or prototypes of the system are simulated, diagnostic issues are not taken into account. Not only does this mean that the diagnostic software is not developed together with the control software, but, more critically, that issues such as the diagnosability of the system being designed or the analysis of the FMEA (Failure Modes and Effects Analysis, which is very useful to discover safety critical faults or failures) are only partially considered in this phase. Usually, these activities are performed by separate teams and most of the times after the design decisions have been taken . In many cases the diagnostic team has to face serious problems since the pieces of information that are needed for diagnosing a system (i.e., the sensors in the system) are very different from those that are needed to control a system. However, as the design has been almost completed, there is no opportunity to ask for modifications (e.g., addition or replacement of sensors) so that compromises have to be accepted in the development of the
1 IDD (Integrated Design process for on-board Diagnosis) is a V Framework project supported by the EU (contract GRD1-1999-11263); partners: CRF, Daimler
diagnostic software. Let us consider the case of on-board diagnostic software, i.e., software that has to decide about recovery actions whenever there is an evidence of a fault in the system under examination. If the system is not diagnosable, that is, there are cases in which it is not possible to single out the fault (which in practice means that many faults are possible), the recovery action to be taken is the strongest one, that is the one which guarantees safety in the worst possible case. This is clearly a non-optimal but necessary choice and has a negative impact on aspects such as the availability of the vehicle and the satisfaction of the driver (customer). This problem has been previously experienced in the VMBD2 project, when applying Model-based
Diagnosis to the “Common rail injection system” (see [2]). In that demonstrator few sensors were available on-board, thus in many cases it was impossible to discriminate between very critical faults and less critical ones. Being unable to discriminate, the diagnostic software could only perform the strongest action (i.e. stopping the engine) to avoid the worst case problems. This situation could lead to a potential reduction of the vehicle availability with uneasy condition for the driver. The correct way for dealing with this kind of problem is to analyze and manage it during the design phase of the on-board systems. The European Fifth Framework project IDD pursues the goal to formalize and standardize the diagnostic design process, and to enable the introduction of such diagnostic analysis early in the chain. This methodological goal has to be combined with another important objective: giving the designers a set of tools that can help them in evaluating and understanding the effects of each choice on the system being designed.
In particular, the Model-based approach to diagnosis (see [5]) is suitable for this integration, both from the methodological and the practical point of view. In fact, the basic modeling principles adopted in the process of designing a system and its control software have some similarities with those adopted in model-based diagnosis. In the project we exploit these similarities to define a new design process and to develop supporting tools. The discussion of this process and tools is the main goal of this paper, reports the experience made in IDD and the tools implemented at CRF and Università di Torino.
2 THE DESIGN PROCESS
A major effort in the first phase of IDD has been devoted to the analysis of the current design process. The design process has been analyzed by the industrial partners, considering different types of systems, interviewing several people working in the design departments and analyzing documents (guidelines) that describe the process organization. A first aim of the project was having a general view of the process as a whole, singling out the different phases that lead from the conceptualization of a new system to its implementation and testing. We aimed also at highlighting when and how models are adopted and which are the tools that are used to support the design process. In a more specific way, the goal is singling out precisely when issues related to diagnosis are taken into account. Some examples of diagnosis-related issues are: “When and how are diagnosability issues considered?” “Do sensor selection and placement take diagnosability into account?”, “When and how is FMEA performed?”, “When and how is the diagnostic software developed?”, “Is this development related with the development of the control software?”
The reader interested in this analysis is referred to [6]; here we simply summarize when and how diagnosis related activities are performed and, in particular, we point out some weaknesses, especially as concerns the role of these activities. The overall process can be considered as a set of nested loops in which the core loops regard the definition and simulation of control (which is supported by commercial tools for mathematical
modeling, e.g., Matlab Simulink) and the selection and layout of components. Diagnosis-related activities,
however, are not part of these loops and in particular at least the following weaknesses emerged from the analysis:
1. FMEA and diagnostic development are sequential activities and they are mainly performed using experience and without model-based supporting tools.
2. Usually the development of FMEA and diagnostics is carried out in parallel with control design (the core loops above); however the two activities do not interact and if additional requirements or constraints emerge from one of the two tasks they are taken into account in the other one only when (and if!) a new loop is performed.
3. Since FMEA and diagnostics development are carried out after component design/layout, diagnostic-related issues have an impact on system design only if a middle or outer loop is performed. This does not often happen, and usually diagnostic issues alone are not enough for choosing this (expensive) option.
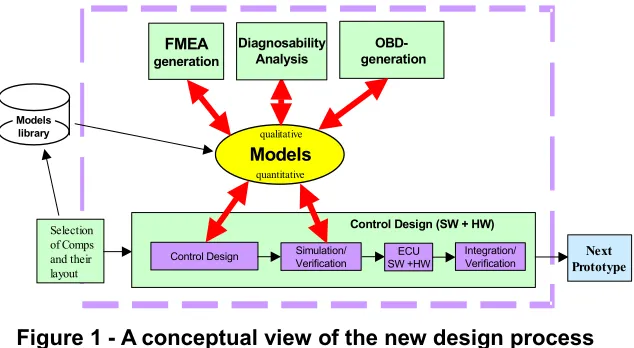
This analysis led us to the definition of a new design process, in which the various activities are more tightly integrated. In particular the activities we considered are:
• design of the physical system;
• design and simulation of control algorithms;
• generation of the FMEA;
• development of on-board diagnostic (OBD) software.
These activities should be integrated in the core loop of the design process and should immediately influence each other, leading to a better design of a system in which both control and diagnosis related issues are simultaneously taken into account.
Moreover, new activities should be introduced, that help in optimizing system design with respect to diagnostic software; these activities are:
• analysis of the diagnosability, i.e. investigation of which faults are detectable and discriminable from each other;
The redefinition of the design process can be made possible by providing designers with a set of tools that (i) automate some of the tasks, in particular the new ones, thus softening the transition to the new design process; (ii) simplify the integration of different tasks, by offering a uniform interface and re-using as much information as possible among different tools; (iii) support designers in exploiting the output of the different tasks for the improvement of the design.
A central role in this new process is played by the model of the system being designed, which is the core of the whole process and must support both the types of analysis needed by control design and simulation (bottom part of the figure 1) and those needed by model-based diagnosis/FMEA generation and diagnosability analysis, On board Diagnostic (OBD) software generation.
Indeed, as we shall discuss in more detail in the next section, modeling plays a central role both in design and in diagnosis and some of the modeling principles are similar, although the models are very different.
3 MODELING SYSTEMS
In the previous section we highlighted how models play a central role in the definition of the new design process. In this section we analyze the types of models that are currently being used in the two main activities to be integrated: (i) design of the system and of the control and simulation (i.e. “design models”) (ii) diagnosis related activities (i.e. “diagnostic models”). The models that are generally used have some similarities but also some very important differences; these similarities and differences generate at the same time some opportunities and some problems.
Let us start with the similarities. First of all, both design and diagnosis models are based on a “component centered” philosophy and are compositional. Each component is characterized by a set of interfaces, which can be used for connecting components (each interface is characterized by a physical type, e.g., hydraulic vs. electric). For example, a pump may have an hydraulic interface which may be connected to a corresponding hydraulic interface of a pipe.
Each component has an associated model, which is formed by a set of mathematic relations. In particular, the model relates a set of interface variables (associated with the interfaces, e.g., a flow variable associated with an hydraulic interface), plus possibly a set of variables that are internal to the component (some of these
Selection of Comps and their layout
FMEA generation
Control Design (SW + HW) OBD-
generation
Control Design Simulation/Verification SW +HWECU Integration/Verification Models
Diagnosability Analysis
qualitative
quantitative
Models library
[image:4.595.145.462.52.226.2]Next Prototype
variables define a notion of “state” for the component, whose models, in most of the cases have a dynamic nature).
What makes design and diagnosis models completely different is the nature of the variables and of the mathematic relations constituting the models.
While design models are usually quantitative (which means that the variables range over real numbers), diagnosis models are usually qualitative. A qualitative model is characterized by variables ranging over a discrete set of qualitative values (for example, we may consider only three values: “positive”, “negative” or “zero”). Consequently, models can be regarded as a set of relations (or constraints) between these variables. For example, a very simple model of a pipe could say that the derivative of the pressure inside a pipe is positive whenever the input flow is greater than the output flow.
Why does diagnosis adopt qualitative models rather than quantitative ones? There are several reasons that support the use of these simpler models, showing that they are sufficient for performing diagnosis. Let us briefly recall the basic principles of Model-based Diagnosis [5]. The idea is that one can use a model to make predictions about the behavior of a system, then diagnoses can be computed by comparing these predictions with the actual observations. In this way one can isolate the faulty components (in case only the correct behavior has been modeled) or can identify the faults of the components (in case some information about the faulty behavior has been modeled). In most of the cases qualitative relations are sufficient to perform fault isolation or identification. Moreover, these models are easier to simulate (and often more efficient). Notice that while it is not very complex to produce qualitative fault models, in most cases it would be impossible to build quantitative fault models. On the other hand, qualitative models would not be sufficient for design, especially for control design and simulation, for which very precise models are needed.
This means that in order to support the different tasks constituting the new design process, two types of models are needed: quantitative ones and qualitative ones. There is a long tradition in engineering and control theory for the development of the former types of models, while various methodologies and languages have been proposed in the last decades in the AI community for developing the latter type. In particular, these different methodologies rely on different modeling assumptions [4] i.e., on different abstractions, and thus each of them is suitable for some applications and problems. Recent research on automotive applications showed that simple models, based on signs and possibly involving qualitative deviations, can be sufficient for achieving interesting diagnostic capabilities ([1][2][3][5]).
A first proposal for extracting a simple form of qualitative models (in terms of qualitative deviations) can be
synthesized starting from Matlab model. We also developed a program which performs this task in a
semi-automatic way.
Qualitative deviations is a form of modeling which proved to be very useful in automotive applications, especially for on-board on-line diagnosis (see [1][2][7])
Deviations represent the difference between the value a variable has and the value it should have; the
deviation of a variable X is usually represented as ∆X = X - Xref.
Qualitative deviations abstract away the deviation value, and record only its sign. They thus express only whether the value of a variable is equal, greater or lower than expected. The qualitative deviation of X is
denoted as [∆ x] = sign(X - Xref), and its possible values are 0, − and +3.
Qualitative deviations can be combined with operators and they can be used in equations in order to describe a behavior. In particular such equations state:
• how a variable deviates from its nominal value when a fault occurs;
• how the deviations of input variables influence the deviation of output variables.
Let us consider the simple example of a component which merges the flows from two hydraulic pipes into a third flow. F1 and F2 represent the two input flows, while Fo represents the output flow. The corresponding
model with qualitative deviations could for example contain the equation [∆Fo] = [∆F1] ⊕ [∆F2]. The behavior of
the same component when it is leaking is described by: [∆Fo] = [∆F1] ⊕ [∆F2] ⊕−.
This approach is very interesting and powerful, especially in all those cases where the actual quantities (or signs) of variables do not matter for recognizing a system behavior or for performing diagnosis but only the deviations with respect to references values (whatever these values are) actually matter. This is the case in many technical domains and especially in on-board applications. The proposed approach for automatically deriving deviation models from quantitative ones is based on the study of function derivatives. In particular, given a system component, we derive its deviation model by analysing the derivative of its input/output function. For the sake of simplicity, we will describe how the approach works in the case of a function of one variable (i.e. a component with only one input); then we will show the result of the tool on a model of the Common Rail fuel injection system.
Let us thus consider a function Y = f(X). We need to determine the relation between [∆X] and [∆Y]. If f is
monotonically increasing we have: [∆Y] = sign(f(X) - f(Xref)) = sign(X - Xref) = [∆X]
On the other hand, if f is monotonically decreasing: [∆Y] = sign(f(X) - f(Xref)) = sign(Xref - X) = \[∆X]
If f is not monotonic, we can split its domain in sub-intervals so that the restriction of f to each interval is monotonic. If I1, …, In are such intervals we obtain a set of equations of the form:
[∆Y] = Qi[∆X] if X,Xref ∈ Ii where Qi is ⊕ (if f is increasing on Ii), or \ (if f is decreasing on Ii) or 0 (if f is
constant on Ii).
3 This is the mathematical definition used in the algorithm. When the resulting data are interpreted for diagnostic purposes one must take into account the fact that
In order to study the function derivative, our tool exploits Simulink®, simulating the component for a sufficient
number of inputs and numerically approximating the derivative .
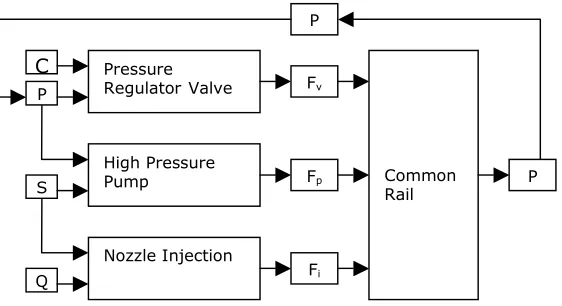
The approach works similarly for functions of multiple variables, as we will see in the following example, where we show the results of the tool when run on the model of the Common Rail fuel injection system in figure 2. The resulting equations are as follows:
[∆dP]t = [∆Fp]t\ [∆Fv]t\ [∆Fi]t
[∆P]t+1 = [∆P]t⊕ [∆dP]t
The first equation computes the derivative of pressure in the rail, which is then used by the second equation to compute the actual pressure. It is rather intuitive to see that the first equation states that the variation of pressure depends on the balancing of input (Fp) and output (Fv, Fi) flows. The second is a standard equation
for deviation modeling when there are state variables: at each step the variable value is updated depending on its previous value and the derivative.
The results on this model show however that the tool produces the expected results, and that the resulting equations can effectively be exploited within model-based tools.
4 TOOLS FOR SUPPORTING THE NEW PROCESS
In order to support the new design process discussed in Section 3, we developed a set of software modules which implement the functionalities introduced in the previous sections:
• A tool for the automatic generation of qualitative models from Matlab; in particular, the tool is composed of
two modules:
- A module that extracts the structural description of a device, i.e. the list of components (with information about the component type of each instance, that is two pipes are recognized as two instances of the same component type) and of their connections.
Nozzle Injection High Pressure Pump Pressure
Regulator Valve Fv
Fp
Fi
C P
S
Q
Common
Rail P
[image:7.595.167.448.44.197.2]P
- A module that derives, for each component type in the library, a qualitative behavior model starting from the quantitative one. In particular, this tool works in an interactive way, extracting qualitative deviation models.
• A tool for performing diagnosability analysis.
• A tool for supporting the FMEA generation.
• A tool for supporting the generation of on-board diagnostic strategies and software.
• A tool for comparing alternative design options.
The last four tools are based on a common Model-based diagnostic system, developed in our groups in the last few years. More specifically, the four tools rely on the basic functionalities of the MBD core in the following way:
• The tool for diagnosability analysis allows the user to specify an operational context and a set of sensors and to perform tasks such as:
- determining if a fault can be detected (detectability analysis);
- determining if two (set of) faults can be discriminated (discriminability analysis) ;
- determining whether additional sensors would allow the system to detect a fault or discriminate between two (set of) faults.
These tasks can be performed by running the diagnostic core several times and singling out if there are cases where the faults cannot be detected or discriminated.
OBD Generation Tool Diagnosabilty
Analysis Tool FMEA
Support Tool
Control Generation Tool Modeling and
Simulation Tool
Models
Design Tool
Qualitative diagnostic model
[image:8.595.134.462.61.311.2]Numerical model (quantitative) Model transformation Model-based Core Components
• The tool for supporting the FMEA generation allows the user to perform qualitative simulations for determining the consequences of faults. These consequences are in fact part of the FMEA tables to be filled in and, presently, are determined by experts, which rely on experience. Thus the tool can provide a significant support, reducing the time needed for producing the FMEA of a system and making FMEA generation more reliable and guaranteeing the quality of the process.
• The currently available on-board hardware resources do not guarantee that a MBD diagnostic system can be implemented on a car ECU. The European project VMBD proposed an approach in which the on-board diagnostic code is generated automatically starting from the on-board system and using a machine learning approach. In particular, the approach is based on the generation of decision (fault)-tree after running several cases with the MBD diagnostic engine and then inducing the tree from these cases [2].
The tool for supporting the generation of on-board diagnostic strategies is based on the same idea and thus relies on the MBD core and on a decision tree learning algorithm.
• The tool for comparing alternative design options and for performing a sort of “what if” analysis during the design process is defined on top of the previous ones. This means, in particular, that one can compare the results of diagnosability analysis or compare the consequences of a fault on two different design options (e.g., after changing some components or replacing some sensors) or even in two completely different design schemas (i.e., schemas containing different sets of components or with different component layouts). This tool, therefore, is a sort of interface for using the previous ones on two design schemas.
The program for deriving qualitative models is implemented in Matlab while the system and the other tools
are implemented in Java and can run on different platform. The tool includes a graphical (Matlab like)
interface for qualitative modeling and graphical controls for activating the various tools. The results of the analysis performed by the tools are displayed in a simple way and can be read very intuitively.
5 GUIDING APPLICATIONS
In order to experiment the tools listed in the previous sections we selected two guiding applications:
1. The Common Rail fuel delivery system.
2. The Air Delivery system for the common rail engine.
This experiment showed that the developed tools can provide a significant help in the design of on-board diagnostics. Even if the final software is still manually designed, this can be done without having to start from scratch, but rather by exploiting the tool output.
For the Air System application the starting point is a manually built qualitative model, on which we experimented detectability and discriminability analysis (which are the tasks carried out by the diagnosability tool), demonstrating how different sensors allow to detect or discriminate different sets of faults.
Detectability analysis consists in checking whether the observable variables specified by the user allow to understand that the system is not behaving correctly. For this to happen at least one of the observable variables must have a deviated value (i.e. a deviation different from 0). The discriminability task is a generalization of detectability, where the comparison is performed between different fault sets.
In our experiment we checked the relevance of the air flow meter in detecting and discriminating in particular pipe clogs in different sections of the system, obtaining a positive answer. The tool showed also that the air flow meter can detect a significant number of faults, including valve failures and the blocking of the
PHASE (N/2)
SPEED (N)
FILTER
Fuel Tank
PR
EFP
P
High Pressure Line
Pressure Sensor RAIL
Injector High Pressure
Pump
Back Flow Line Electric Fuel
Pump
Electronic Control Unit
Pressure Regulator
Low
pr
es
su
re
Li
ne
ETK
[image:10.595.146.466.50.248.2]Engine speed / Torque Evaluation
Figure 4 - The Common rail fuel delivery system
[image:10.595.137.461.574.768.2]turbocompressor. Obtained results are consistent with expectations derived by experience acquired studying the physical system.
The diagnosability tool has proved itself useful in evaluating the system design from the point of view of sensor choice and placement. The advantages of such an evaluation are:
• possibility of comparing different design choices at an early stage
• as a consequence, development of safer systems with complete and reliable diagnostic capabilities.
Both the experiments we presented in this section showed that the overall methodology discussed in this paper can have a strong impact on system design by reducing development time and costs.
6 CONCLUSIONS
In the paper we discussed some experiences made at CRF and Università di Torino on the development of methodologies and tools for supporting a new design process which includes diagnosis related activities.
The analysis on the current design process and the definition of the new process have been carried on in co-operation with the other partners in the IDD project.
APPENDIX
List of acronyms:
AI: Artificial Intelligence ECU: Electronic Control Unit
FMEA: Failure Modes and Effects Analysis
IDD: Integrated Design process for on-board Diagnosis MBD: Model-Based Diagnosis
OBD: On-Board Diagnosis
VMBD: Vehicle Model-Based Diagnosis
REFERENCES
[1] P. Bidian, M. Tatar, F. Cascio, D. Theseider-Dupré, M. Sachenbacher, R. Weber, C. Carlén: Powertrain Diagnostics: A Model-Based Approach, Proceedings of ERA Technology Vehicle Electronic, Systems Conference '99, Coventry, UK, 1999
[2] F. Cascio, L. Console, M. Guagliumi, M. Osella, A. Panati, S. Sottano, D. Theseider Dupré: Strategies for on-board diagnostics of dynamic automotive systems using qualitative models, AI Communications, June 1999.
[3] L. Console, O. Dressler: Model-based diagnosis in the real world: lessons learned and challenges remaining, in Proc. IJCAI 99, Stockholm 1999, pp.1393-1400.
[4] R. Davis: Diagnostic Reasoning based on Structure and behavior, Artificial Intelligence 24(1), 1984: pp. 347-410.
[6] C. Picardi, R. Bray, F. Cascio, L. Console, P. Dague, O. Dressler, D. Millet, B. Rehfus, P. Struss, C. Vallee: IDD: Integrating Diagnosis in the Design of Automotive Systems, in Proc. ECAI 2002, track on Prestigious Applications of Artificial Intelligence, IOS Press 2002, pp. 628-63.
[7] M. Sachenbacher, P. Struss, R. Weber: Advances in Design and Implementation of OBD Functions for Diesel Injection Systems based on a Qualitative Approach to Diagnosis, SAE 2000 World Congress, Detroit, USA, 2000.