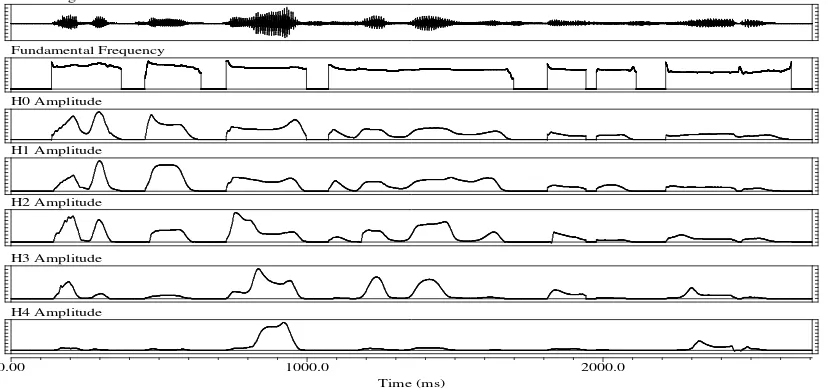
Multitaper analysis of fundamental frequency variations during voiced fricatives
Full text
Figure

Related documents
The effort required by individual modelers to prepare a representative table of results was much greater in both R and Mahout than it was in SAS High-Performance Analytics Server
To overcome these problems this project proposes a methodology for determining consumers’ TLPs by using fuzzy C-means (FCM) clustering method and probability neural
Hemorrhage induced ER stress primarily targets neurons and the protein kinase R (PKR)-like endoplasmic reticulum kinase (PERK)/CHOP pathway might have predominant role in neuronal
[3] NEST’s primary goals are to read in ESA and third part SAR data products, provide tools for calibration, orthorectification, co-registration, interferometry,
The three- stage least squares results suggest that foreign capital flows into the public sector have strong positive impact on social and non-development expenditures and, in
Aims: To study the preoperative, intraoperative, and postoperative risk factors for developing prolonged ileus in patients that underwent elective colon resection.. Materials
Typ- ically, visualisation methods like principal components analysis are used but these methods are not easily able to deal with missing data nor can they capture non-linear
7.1 Generally, a GST-registered business can only claim input tax incurred in the course or furtherance of its business to the extent that the input tax is
