Thesis by Mark D. Cohen
In Partial Fulfillment of the Requirements for the Degree of
Doctor of Philosophy
California Institute of Technology Pasadena, California
1987
Acknowledgments
I would like to thank my research advisors, Profs. John Seinfeld and Rick Flagan, for their help and guidance throughout the course of my research.
I'd also like to thank Profs. Jim Morgan and Fred Shair for their partic-ipation in my final examination committee.
Thanks also are due to many other people who have contributed to my work with helpful discussions and assistance, including Prof. Steve Arnold of Brooklyn Polytechnic University, Prof. Glen Cass, Fred Gelbard, Carol Jones, Brian Newport, Gidi Sageev, Craig Steele, and Dale Warren.
Several people helped with the design and construction of the appara-tus used in this work, including Elton Daly, Rich Eastvedt, Concetto Geremia, George Griffith, Joe Fontana, Louis Johnson, Floyd Litreal, Leonard Montene-gro, "Chic" Nakawatase, William Schuelke, and Tony Stark. I greatly appreci-ated their skill, advice and patience as they helped to build the various parts of the experimental apparatus.
My family has been very supportive during my time at Caltech (and before!). Each person has helped me in special ways, and I'd like to express my deepest appreciation and affection to them all. Howard, Mom, Dad, Barb, Joel, Bubba, Zady, Grandma, Grandpa and everyone else - thanks for your inexhaustible moral support and love.
Abstract
An electrodynamic balance has been used to measure the water activity as a function of solute concentration at 20 °C for eleven single-electrolyte aque-ous solutions - NaCl, NaBr, KCl, KBr, NH4Cl, Na2S04, (NH4)2S04, CaCb,
MnCh, MnS0 4, and FeC13 - and three mixed-electrolyte aqueous solutions
- NaCl-KCl, NaCl-KBr, and NaCl-(NH4)2S04. The measurements were per-formed by levitating single, charged, 20-micron diameter droplets of these solu-tions within the balance and measuring the mass of the particles as a function of the surrounding relative humidity. The deliquescence behavior of the particles was also observed.
Heterogeneous nucleation was inhibited due to the absence of container walls and because the small droplets were less likely than a bulk sample to contain foreign particles. Thus, this technique allowed the thermodynamics of highly concentrated solutions to be studied. For most of the solutions, water activity measurements were made to higher solute concentrations than have previously been reported. At low concentrations, the results were consistent with previously published data. Nucleation theory was used to estimate the surface excess free energy and critical nucleus size from the measured supersaturation at which nucleation occurred.
semi-empirical electrolyte solution models were tested against the data, and it was found that salt-specific model parameters estimated from low concentration data could not be reliably used to predict the solution behavior at high concentra-tions. However, with estimated parameters based on the full range of the data, the models were able to represent the experimental data for single-electrolyte solutions to within the uncertainty in the measurements.
Three models of mixed-electrolyte solutions - the Zdanovskii-Stokes-Robinson, Reilly-Wood-Robinson and Pitzer methods - agreed well with the experimental data for the NaCl-KCl and NaCl-KBr systems over the range of concentration that the models could be applied. The mixing rules' predictions were consistent with the experimental observations for the NaCl-(NH4 ) 2S04
Contents
Acknowledgements 11
Abstract iv
Lists of Tables in Chapters 1,2, and 3 vu Lists of Figures in Chapters 1,2, and 3 x
List of Appendices xv
Introduction 1
Chapter 1: Water Activities for Single-Electrolyte Solutions 4
Chapter 2: Water Activities for Mixed-Electrolyte Solutions 84 Chapter 3: Solute Nucleation
Conclusions
Appendices
134 178
List of Tables in Chapter 1
1 Stoichiometric amount of water in crystal, deliquescence, 51 and molality range of data
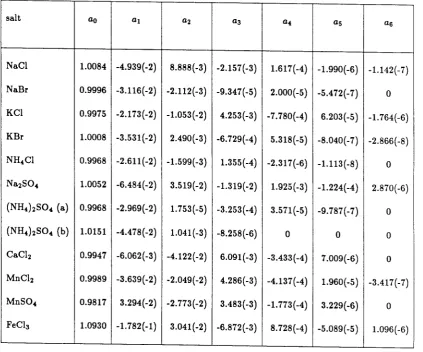
2 Coefficients of aw ( m) polynomial fit, 52
aw = ao +aim+ azm2
+ ...
3 Molality range for which coefficients given in Table 2 are 53 valid, standard error in fit of aw (m) data over this range,
and sources of literature data used in polynomial fits
4 Evaluation of Pitzer's model using parameters estimated 54 from low-concentration data
5 Re-estimated parameters and evaluation of Pitzer's method 55
6 Comparison of experimental results with predictions of 56 local composition model of Chen et al. (Ref [44])
using parameters estimated from low-concentration data
7 Comparison of experimental results with predictions of 57 local composition model of Chen et al. (Ref [44])
using re-estimated parameters
List of Tables in Chapter 2
1 Summary of experimental measurements, range of 115 applicability and success of electrolyte solution
List of Tables in Chapter 3
1 Parameters for density estimation of supersaturated droplets 165
2 Time until nucleation event occurs in an aqueous droplet 166 of Na Cl ; diameter of particle when dry is 13.4 µm
3 Geometric factors for salt crystals 167
4 Characteristics of particles studied and conditions at which 168 crystallization occurred in single-electrolyte aqueous droplets
5 Calculation of surface excess free energy and 169 characteristic length of critical nucleus from measured
critical solute concentration
6 Sensitivity of calculated surface excess free energy 170 and critical nucleus size for NaCl to variations in
ti ' K ' d~ry ' w
f
Scrit ' and 1±,crit7 Characteristics of particles studied and conditions at 171 which crystallization occurred in mixed-electrolyte
aqueous droplets
8 Comparison of measured critical supersaturations found 172 in a typical bulk-solution crystallization investigation with
those measured in the present work for levitated droplets
List of Figures in Chapter 1
Figure Captions 59
1 Schematic of apparatus 62
2 Electrodynamic balance electrical circuitry and 63 cross-sectional schematic of electrode assembly
3 de balancing voltage vs. time during a typical experiment; 64 measurements for an ammonium chloride particle
4 Velocity (meters/sec) vs. Vdc for a 65
dry ammonium sulfate particle
5 Weight fraction solute vs. water activity for NaCl 66
6 Weight fraction solute vs. water activity for NaBr 67
7 Weight fraction solute vs. water activity for KCl 68 8 Weight fraction solute vs. water activity for KBr 69
9 Weight fraction solute vs. water activity for NH4Cl 70
10 Weight fraction solute vs. water activity for Na2S04 71
12 Weight fraction solute vs. water activity for CaCl2 73
13 Weight fraction solute vs. water activity for MnC12 74
14 Weight fraction solute vs. water activity for MnS04 75 15 Weight fraction solute vs. water activity for FeCb 76
16 Solute activity coefficient vs. solute molality for 1:1 77
electrolytes
17 Solute activity coefficient vs. solute molality for 78 CaC12 , FeC13 , and MnC12
18 Solute activity coefficient vs. solute molality for 79 electrolytes containing sulfate ion
19 Solute activity coefficient vs. solute molality for 80 potassium bromide; comparison of experimental results with predictions of Pitzer's method
20 Solute activity coefficient vs. solute molality for calcium 81 chloride; comparison of experimental results with
predictions of Pitzer's method
21 Solute activity coefficient vs. solute molality for sodium 82 bromide; comparison of experimental results with predictions of the local composition model of Chen et al.
List of Figures in Chapter 2
Figure Captions 116
1 Weight fraction solute vs. water activity for 119 NaCl-KC! mixture; particle assumed anhydrous when dry;
moles KCI /moles NaCl = 1.0
2 Ratio of total particle mass to solute mass vs. time for 120 NaCl-KC! particle during humidity transients in which
deliquescence occurred; moles KCI / moles NaCl = 1.0
3 Weight fraction solute vs. water activity for 121 NaCI-KBr mixture; particles assumed anhydrous when dry; moles KBr / moles N aCI = 0.6195
4 Weight fraction solute vs. water activity for 122 NaCI-(NH4)zS04 mixture
#
1; particle assumed anhydrous when dry; moles (NH4)zS04 / moles NaCl = 0.55 Weight fraction solute vs. water activity for 123 NaCI-(NH4)zS04 mixture
#
2; particle assumed anhydrous when dry; moles (NH4)zS04 /moles NaCl = 1.06 Weight fraction solute vs. water activity for 124 NaCI-(NH4)zS04 mixture
#
3; particle assumed anhydrous when dry; moles (NH4)zS04 / moles NaCl = 2.07 Ratio of total particle mass to solute mass vs. time 125 for NaCI-(NH4)zS04 particles during humidity
8 Weight fraction solute vs. water activity for 126 NaCl-(NH4)zS04 mixture# 1; assuming dry-particle
stoichiometry of 0.512 moles of water per mole of solute; moles (NH4)zS04 / moles NaCl = 0.5
9 Weight fraction solute vs. water activity for 127 NaCl-(NH4)zS04 mixture # 2; assuming dry-particle
stoichiometry of 0.588 moles of water per mole of solute; moles (NH4)zS04 / moles NaCl = 1.0
10 Weight fraction solute vs. water activity for 128 NaCl-(NH4)zS04 mixture # 3; assuming dry-particle
stoichiometry of 0.663 moles of water per mole of solute; moles (NH4)zS04 / moles NaCl = 2.0
11 Water activity vs. molal ionic strength for 129 NaCl-KCl mixture; particle assumed anhydrous when dry; moles KCl / moles NaCl = 1.0
12 Water activity vs. molal ionic strength for 130 NaCl-KBr mixture; particle assumed anhydrous when dry; moles KBr /moles NaCl= 0.6195
13 Water activity vs. molal ionic strength for 131 NaCl-(NH4)zS04 mixture # 1; assuming dry-particle
stoichiometry of 0.512 moles of water per mole of solute; moles (NH4)2S04 / moles NaCl
=
0.514 Water activity vs. molal ionic strength for 132 NaCl-(NH4)zS04 mixture # 2; assuming dry-particle
stoichiometry of 0.588 moles of water per mole of solute; moles (NH4)zS04 / moles NaCl
=
1.015 Water activity vs. molal ionic strength for 133 NaCl-(NH4)zS04 mixture # 3; assuming dry-particle
List of Figures in Chapter 3
Figure Captions 174
1 Balancing voltage vs. time for a sodium chloride 175 particle during a humidity transient in which
crystallization occurred; particle aerodynamic diameter when dry is 11. 7 microns; at t = O, relative humidity changed from 0.455 to 0.440
2 Balancing voltage vs. time for a sodium chloride 176 particle during a humidity transient in which
crystallization occurred; particle aerodynamic diameter when dry is 13.4 microns; at t = 0, chamber relative humidity changed from greater than 0.90 to 0.391
3 Balancing voltage vs. time for a sodium chloride 177 particle during a humidity transient in which
List of Appendices
A Tables of experimental data for particle relative 184 mass as a function of chamber relative humidity for
single-electrolyte particles
B Comparison of experimental water activity data with 212 literature data for single-electrolyte solutions
c
Detailed results for polynomial fits to water 225 activity data for single-electrolyte solutionsD Plots of experimental and literature aw ( m) data 249 compared with predictions of polynomial fits for
single-electrolyte solutions
E Calculations of mean molal solute activity 262 coefficient as a function of molality for
single-electrolyte solutions
F Plots of calculations of mean molal solute activity 290 coefficient as a function of molality for
G Plots of the solute activity coefficient as a 305 function of molality in which experimental data is
compared to the predictions of the local composition model of Chen et al.
H Plots of water activity as a function of molality 318 in which experimental data is compared to the
predictions of the local composition model of Chen et al.
I Plots of the solute activity coefficient as a 331 function of molality in which experimental data is
compared to the predictions of Pitzer's model
J Plots of water activity as a function of molality 343 in which experimental data is compared to the
predictions of Pitzer's model
K Evaluation of the BET-based model of Robinson and 355 Stokes for each of the single-electrolyte solutions
studied
1 Plots showing the aw ( m) predictions of the 381 BET-based model of Robinson and Stokes compared with the experimental data for each of the
single-electrolyte solutions studied
M Tables of experimental data for particle relative 407 mass as a function of chamber relative humidity for
mixed-electrolyte particles
N Plots of the weight fraction solute as a function 423 of chamber relative humidity for mixed-electrolyte
Introduction
Aqueous electrolyte solutions occur in many biological, environmental, and industrial situations, and so, a characterization of the properties and an understanding of the underlying physics and chemistry of such solutions continue to be important areas of research. Two aspects of electrolyte solutions, their thermodynamics and nucleation, are the subject of this thesis.
Previous experimental investigations have generally involved a bulk sam-ple of the solution of interest. Using conventional measurement methods, solu-tion properties typically can be obtained only up to the saturasolu-tion limit for a given salt or mixture. Further, it has been very difficult to study the homoge-neous nucleation of electrolytes from aqueous solution, because it has not been generally possible to avoid the influences of container walls and foreign dust particles that can provide sites for heterogeneous, catalyzed nucleation.
Recently, the usefulness of the electrodynamic balance for the study of aqueous electrolyte solutions has been recognized. The apparatus allows a sin-gle, micron-sized, charged particle to be levitated in a controlled environment and continuously weighed. By measuring the relative mass of the particle as a function of the relative humidity of the surrounding vapor, information about the water activity's dependence on solute concentration can be obtained.
the heterogeneous nucleation of crystals from solution is inhibited. Without this catalysis, very high supersaturations are observed within suspended droplets be-fore crystallization occurs. Thus, the use of the electrodynamic balance allows the properties of highly supersaturated electrolyte solutions to be investigated. In addition, because of the supression of heterogeneous nucleation, the technique may possibly allow the homogeneous nucleation of electrolytes from aqueous so-lution to be investigated.
In Chapter 1, the experimental system is described and measurements of the water activity of several single-electrolyte solutions are presented. Cal-culations of solute activity coefficients are also given. For most of the salts, data were obtained at higher solute concentrations than have previously been reported. These data allow existing models of electrolyte solutions to be tested at higher concentrations than normally used for their evaluation.
Results for mixed-electrolyte solutions are given in Chapter 2. Three different mixtures were studied. The water activity dependence on solute con-centration for one of the mixtures, NaCl-(NH4)2S04 , had not been studied
pre-viously. These two salts are known to be important constituents of the atmo-spheric aerosol and so the properties of their mixed aqueous solution is of con-siderable interest. The measurements for all the mixtures extend to very high ionic strengths. These data thus allow the testing of existing mixed-electrolyte solution models at concentrations higher than typically employed in their as-sessment.
tallization occurred in the levitated droplets are presented. For the single-electrolyte solutions, the measured critical supersaturations are used with an existing theory to estimate the surface excess free energy and size of the critical embryo for homogeneous nucleation from aqueous solution. Two features of the present work are improvements over some of the earlier single-particle nucle-ation investignucle-ations. First, the particle size has been measured and explicitly accounted for in the theoretical interpretation of the results. Second, the super-saturation has been accurately estimated at the critical solute concentration by using the water activity measurements obtained in this work. The supersatura-tions found were much higher than those observed with conventional techniques, and it is thought that true homogeneous nucleation from solution was occurring.
Studies of Concentrated Electrolyte Solutions
using the Electrodynamic Balance.
I. Water Activities for
Single-Electrolyte Solutions
Mark D. Cohen, Richard C. Flagan*,
and John H. Seinfeldt
Chemical Engineering
California Institute of Technology
Pasadena, CA 91125
Abstract
An electrodynamic balance apparatus has been used to suspend single, twenty-micron diameter, charged droplets of aqueous salt solutions in a humid environment. From measurements of the humidity surrounding the droplet and the relative mass of the particle in its wet and dry states, the dependence of wa-ter activity on solute concentration was dewa-termined for aqueous solutions of the following salts at 20 "C : NaCl, NaBr, KCl, KBr, NH4Cl, Na2S04 , (NH4)zS04 ,
CaC12 , MnC12 , and FeC13 • This technique allowed the thermodynamics of highly
Introduction
The thermodynamics of aqueous electrolyte solutions continues to be an area of experimental and theoretical interest. Knowledge of solution properties is required for the understanding of many important phenomena in industrial, biological, and environmental settings. While the theoretical details of the be-havior at very low concentrations are reasonably well established, that at high concentrations remains less well understood. At high concentrations, many of the simplifying assumptions made for dilute solutions are no longer valid. A deeper understanding of the processes occurring in highly concentrated solu-tions may lead to a more complete understanding of electrolyte solusolu-tions in general. For many electrolytes, however, there are little or no data available at high solute concentrations. With conventional methods of measurement, crys-tallization generally occurs at relatively low supersaturations and so data can normally be obtained only up to the saturation limit of the salt.
We have used the electrodynamic balance to study the thermodynamics of concentrated aqueous electrolyte solutions. In this paper, Part I, the ther-modynamics of concentrated aqueous solutions of single electrolytes are studied. In Part II [6}, results for aqueous solutions of salt mixtures are presented. In Part III [7], results for the nucleation of the solute from aqueous electrolyte solutions are given.
Experimental Method
In recent years, the bihyperboloidal electrodynamic balance has proven to be a useful experimental tool for the investigation of a wide variety of problems involving micron-sized particles, including gas-phase mass transfer [8], vapor-liquid equilibrium for multicomponent oils [9], chemical reaction kinetics [10], light scattering [11], and solute nucleation in electrolyte solutions [3,4,5,12]. The design of the bihyperboloidal electrodynamic balance and the theory underly-ing its ability to levitate charged particles have been treated fully by others [13,14,15,16] and will not be repeated here.
Rubel
[lj
has measured the water activity as a function of solute con-centration for aqueous solutions of phosphoric acid using the electrodynamic balance. As humid air was directed past a suspended droplet at atmospheric pressure, its relative mass was measured as a function of relative humidity. The results were consistent with other literature data for phosphoric acid solutions.their experiments, the chamber was first evacuated to dry the particle. Small amounts of water vapor were then admitted into the chamber to establish a controlled humidity atmosphere. The experiments were performed at low pres-sure. With this technique, the properties of LiBr, Lil, (NH4)2S04 , and mixed
Particle Containment System
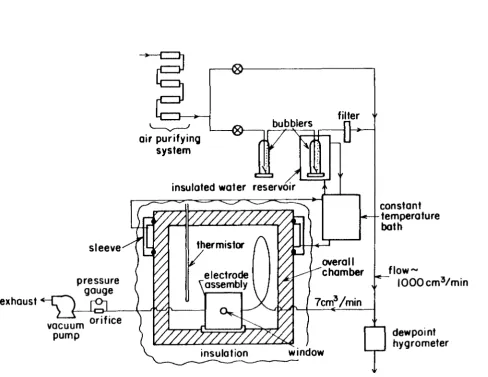
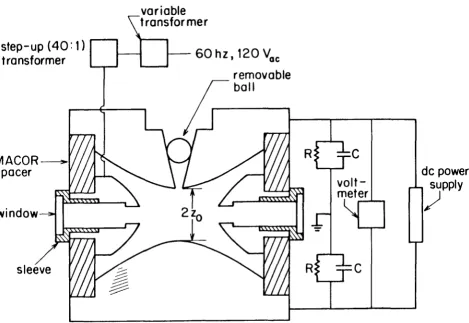
A schematic diagram of the apparatus used for this study is shown in Figure 1. In the electrodynamic balance technique, a single, charged particle is suspended in a gaseous atmosphere by means of an electric field. The electric field is created by imposing voltages on the electrodes shown in Figure 2. The surfaces of the top and bottom electrodes are given by
r2
z2 = -
+
z~2
(1)
where z is the vertical displacement from the geometric center of the chamber, r is the radial distance from the axis of symmetry, and z0 is the characteristic
length of the electrode assembly, equal to one-half the distance between the top and bottom electrodes at their closest point of approach. For our electrodes, z0
was 0.5 cm. The surface of the ring electrode satifies
r2
z2 = - - z~
2
(2)
field created by an ac voltage applied to the ring electrode. This ac field creates an unsteady force on an off-center charged particle that, on a time-averaged basis, pushes it toward the center of the chamber.
In the absence of any gas flows, a particle will remam at rest at the center of the chamber as long as the force due to the de field exactly balances the gravitational force on the particle. If the vertical electrical force due to the de field is greater or less than the gravitational force on the particle, the particle will oscillate vertically above or below the center of the chamber, respectively. Thus, in the absence of any gas flows within the chamber, the balancing voltage is determined by finding the voltage such that the particle remains at rest in the center of the chamber. The ac field is exactly zero at the center. However, if a balanced particle is moved from the center by the action of any small, transient force, it oscillates in the ac field and is quickly forced back to the center.
vertical component. Thus, even in the presence of an added, horizontal force, the de voltage required to balance a charged, suspended particle against gravity can be determined.
A particle is balanced when the de field force exactly counteracts the gravity force, i.e.,
cvbal
mg= ne--dc_
Zo
(3)
where m is the mass of the particle, g is the gravitational constant, n is the number of elementary charges on the particle, e is the charge on an electron,
VJcal is the de balancing voltage, and C is a geometrical constant. This condition is valid whether or not a horizontal flow is present.
We performed a numerical calculation of the de field within the elec-trodes, neglecting the holes in the ring and endcap elecelec-trodes, and found that the geometrical constant C was equal to 0.401 (±0.001) at the center of the chamber, in good agreement with a previous calculation [16]. Calculations were also performed for a modified electrode geometry with a slot in the ring elec-trode, as if holes were drilled continuously all around the ring. No effect on the geometrical factor C was found for a slot with vertical dimension of 0.636 z0 (i.e., 0.318 cm), the diameter of the holes in our ring electrode. It should be noted that the value of C is not required for relative mass measurements and is only needed when the absolute mass of a particle is to be determined.
the electrodes from the base of the overall chamber. Electrical connections to the ring and endcap electrodes were made by insulated screws. The electrode assembly was secured to the base of the environmental chamber by two plastic screws.
One set of holes on opposite sides of the ring electrode allowed the intro-duction and removal of gases. The unfocused beam from a 3 milliwatt He-Ne laser was directed through another set of oppositely placed holes in order to illuminate the particle at the center of the chamber. A suspended particle was observed by viewing the scattered laser light through an additional hole in the ring electrode with a microscope. The microscope contained a 1.5x objective and a lOx eyepiece with a movable hairline reticle. The laser and visual observation holes in the ring were covered with windows, and the hole in the top electrode was covered with a stainless steel sphere.
the charge remained on the resulting droplet(s). To insert a particle into the electrodynamic balance, the top of the chamber and the ball covering the 0.15 cm hole in the top electrode were removed and the tip of the injector was positioned directly above the hole in the top electrode. The ac field was activated, and the generator was pulsed until a suitable particle was captured.
Measurement of Water Activity and Solute Concentration
In order to measure water activities for electrolyte solutions, this exper-imental method exploits the fact that at equilibrium the chemical potential of water in the droplet's solution and the surrounding vapor will be equal. The droplets studied were typically about 20 microns in diameter. It was, therefore, unnecessary to include the Kelvin effect in describing the droplet-vapor equi-librium. Assuming an ideal gas, the condition of phase equilibrium for water requires that
µw0 liq
+
RT In aw=
µ0w vap+
RT In PwI I p~
(4)
in which µ~,liq and µ~,vap are the standard state chemical potentials of water in the liquid and vapor phases at the temperature and pressure of interest, R is the gas constant, T is the absolute temperature, aw is the activity of the water
in the liquid phase, Pw is the partial pressure of water present, and P':vat is the
saturation vapor pressure of water at temperature T. Since the standard state chemical potentials are equal in this instance, eq 4 reduces to
where rh is the relative humidity of the vapor phase. Thus, if the relative humidity of the gas fl.owing past the particle is known, then the activity of water in the suspended droplet is also known.
The humid air fl.owing past the particle was produced in the following way. First, the air was purified and dried by passing it through beds of activated charcoal, molecular sieve, and Drierite. The air was then filtered to remove any particles. Part of the gas stream was then split off to be humidified. The humidification was carried out by passing the air through two bubblers filled with pure water, the second of which was immersed in a constant temperature bath. The humidified air was filtered to remove any particles that may have been formed as a result of the humidification process. This humidified air was then recombined with the remaining dry fl.ow to produce air at a particular relative humidity. At this point, a small fraction, 7 cm3 /minute, of this mixed stream was split off and pulled through the electrode assembly and a capillary fl.ow meter by a vacuum pump. The remaining humid air passed through a dewpoint hygrometer to measure the absolute humidity of this air stream. In this way, a constant fl.ow of known absolute humidity could be directed past a suspended particle.
to a change in the water content of the particle. Therefore, if the composition of the particle at any particular balancing voltage was known, the composition at any other state could be easily determined from the relative masses of the two states. For example, if a particle was anhydrous in its dry state, then the weight fraction solute at any other state is given simply by Vd~ru /Vt/t. If the weight fraction solute is known, then the molality can be calculated from
m =
(-1 -1)-1
_!_
wfs W8
(6)
in which w
f
s is the weight fraction solute and W8 is the molecular weight of thesolute. As discussed below, the overall uncertainty in the weight fraction solute measured in the present experiments was at most 0.01.
relative balancing voltage of the particle in the wet and dry states and the absolute humidity of the gas. In this way, a suspended particle was used as a temperature probe.
It was found that the temperature of the particle and the immediately surrounding gas was slightly higher than that measured by the thermistor. This slight temperature increase was due to heat dissipation related to the ac volt-age. Evidence for this heating and its source came from a variety of observations. First, by changing the position of the thermistor, a temperature gradient radi-ally and verticradi-ally away from the ring electrode was found. Also, when the ac voltage was increased, the temperature measured by the thermistor at any given location increased. Finally, when the ac voltage was increased, the tem-perature of a suspended particle increased. The temtem-perature difference between the thermistor and the particle increased approximately as the square of the ac voltage.
In order to calculate the relative humidity to which a suspended particle was exposed, it was necessary to relate the temperature of the particle to that indicated by the thermistor. The difference between these two temperatures,
!::. T, depends on the fl.ow rate through the electrodes, the ac voltage, and the position of the thermistor. An ac potential of 400 volts and an electrode fl.ow of 7 cm3 /minute were found to be optimal and were used for all measurements.
where the water activity as a function of concentration is known, it was found that ~T for the chosen fl.ow rate and ac voltage was equal to 0.3
±
0.1 '(:.The relative humidity of the air fl.owing past the particle was calculated from the measured absolute humidity and the measured chamber temperature with a ~ T of 0.3 '(:. The uncertainty in our estimate of the relative humidity is approximately 0.01-0.02 considering uncertainties in the thermistor calibration, the value of ~T, and the absolute humidity indicated by the hygrometer. Since the relative humidity is exactly equivalent to the water activity in our exper-iments, the uncertainty in our reported water activities is also approximately 0.01-0.02.
After the particle was inserted, dry air was passed through the electrodes, causing the particle to lose water until it crystallized. The balancing voltage corresponding to the dry mass of the particle was thus determined. The relative humidity was then changed in steps, allowing adequate time for the equilibration of the chamber humidity at each step. The variation of the the balancing voltage with time for a part of a typical experiment is shown in Figure 3. Each of
There are several advantages in making water activity measurements for electrolyte solutions using micron-sized, levitated droplets. First, because the sample of solution is so small, it reaches phase equilibrium with its surroundings extremely quickly. In practice, measurements of the water activity as a function of concentration are limited only by the time it takes to establish and measure the relative humidity in the chamber. An entire experiment, with measurements over a wide range of humidites, can be performed in a single day. This can be compared to the long equilibration times typically required for conventional isopiestic measurements, in which it is not uncommon to wait 2-28 days for each water activity measurement [22,23]. Thus, the electrodynamic balance offers a relatively quick way to obtain water activity data.
In addition, heterogeneous nucleation is supressed because there is no containing vessel and because the tiny droplet is less likely than a larger sample to be contaminated with particles. Thus, very high supersaturations can be reached before crystallization occurs. It is unlikely that water activity data for such highly supersaturated solutions could be obtained by conventional mea-surement methods.
Particle Size and Charge Measurement
the cystallization process, discussed in Part III of this work [7], depends on the particle size. The following procedure was used to estimate the particle size and charge.
In the absence of fl.ow through the electrodes and with no ac voltage, a particle will simply rise or fall vertically if the de field does not exactly balance gravity. A force balance on a spherical particle of diameter dp moving at its terminal velocity, u, under the influence of gravity and the constant electric field near the center of the chamber, yields
-neCA(dp)[Vdc - VJcal]
u= ---~
3z07rµdP
(7)
in which µ is the viscosity of air, Vdc is the de voltage during the measurement, and Vjcal is the balancing voltage of the particle. The slip correction factor [20,21], A(dp), is is given by
A(dp) =
1
+
~:
[A
1+
A
2 exp(-~sdp)]
(8)
in which i is the mean free path of the air molecules, A1 = 1.257, A2
=
0.400,and A3
=
0.55.From eq 7, it is seen that a plot of the measured particle velocity versus the de voltage should yield a straight line. After substitution from eq 3, it can be shown that the slope, S, of this straight line is given by
PpgA(dp)d;
S =
-l8µVjca1
where Pp is the density of the particle.
(9)
electrodes. Particle velocity was determined by measuring the time required for the particle to travel a known distance. The measurments were made by first changing the de voltage from the balance condition, setting the movable crosshair to a specific distance away from the particle, and then turning off the ac voltage and timing the particle's sedimentation. Several velocity measure-ments were made at each voltage setting, and de voltage settings both greater and less than the balancing voltage were used.
The velocities were measured over distances on the order of 0.5 mm and times on the order of 1-5 seconds. Over this distance the vertical de field changed by only about 1
%,
and so the field was assumed constant at its value at the center of the chamber. A twenty-micron particle subjected to the above sudden imposition of unbalanced force would achieve its terminal settling velocity in approximately 0.01 seconds. It was assumed, for the purposes of calculating the particle velocity, that the terminal velocity was reached instantaneously.A straight line was fit to the measurements using a least-squares proce-dure to estimate the slope in eq 9. A typical set of measurements and best-fit straight line are shown in Figure 4. Using the estimated slope and measured balancing voltage, eq 9 was then solved for the particle diameter by iteration. Once the diameter of the particle was known, the particle's charge could then be obtained from eq 3. As an example, the measurements presented in Figure 4 for an ammonium sulfate particle resulted in a particle diameter of 19 microns
and a charge of 8.9 x 10⁴ elementary charges.
of fl.ow through the electrodes. Since the humidity in the chamber was not stable in the absence of fl.ow, a solution droplet would have changed size during the series of velocity measurements. Therefore, the velocity measurements were made on dried particles. The shape of the dry particles was unknown, so the measurements provide an equivalent aerodynamic spherical diameter for the dry particle.
Additional Factors in Data Analysis
The estimation of the solute concentration in the droplet was ocassionally complicated by one or more factors. First, there is no general, a priori way to predict what the composition of a suspended particle will be after it has crys-tallized and/or dried. One cannot simply assume the dry particle will be the most thermodynamically stable crystalline phase at the temperature of the ex-periment. In fact, there are several additional possibilities. Even if a crystalline phase is obtained, it may not be the most stable phase. This phenomenon is often found in crystallization experiments and is known as Ostwald's Law of Stages [19] which states that a less stable crystalline phase can be formed from a supersaturated solution because the free energy change required for its forma-tion is less than that for a more stable crystalline phase. There could also be more than one crystalline phase present. Water could be retained in the particle, possibly trapped between different crystalline phases. Finally, the particle may not crystallize at all but instead pass into a glassy state.
com-position. First, an experiment was performed in which the particle's balancing voltage was measured at various relative humidities. A measurement of the del-iquescence humidity at which the crystalline phase and a liquid solution phase have equal thermodynamic stability was also attempted. At humidities above the deliquescence point, a crystalline particle quickly absorbs water from the vapor phase. The crystal then dissolves, forming a solution droplet in which the activity of the water equals the relative humidity.
From the measurements of relative particle mass as a function of relative humidity, the solute concentration as a function of water activity was initially estimated by assuming the dry-particle stoichiometry was that of the most stable crystalline phase. If the resulting dependence of water activity on solute concen-tration was consistent with literature data, then the dry-particle stoichiometry was taken to be this equilibrium value. This was the case for sodium chlo-ride, potassium chlochlo-ride, potassium bromide, ammonium chlochlo-ride, ammonium sulfate, and ferric chloride. For all of these salts except for ferric chloride, this assumption was confirmed by the fact that deliquescence occurred at the relative humidity expected for crystalline particles of this equilibrium composition.
If the salt particle deliquesced at a lower relative humidity than expected and if the
aw (
m) results were consistent with the another less stable, but known, crystalline phase, then it was assumed that the dry particle was comprised of this phase. This was true for sodium bromide, sodium sulfate, and calcium chloride.that the dry particle consisted of a single, known crystalline phase, suggesting that the dry particle either contained several different crystalline phases, con-tained some trapped water, or had a glassy structure. The stoichiometry of the dry particle was estimated from literature values of the thermodynamic proper-ties [i.e.,
aw(m)]
at high humidity. This procedure was necessary for manganese chloride and manganese sulfate.Thus, while there is no general way to predict the composition of a sus-pended particle after drying, there was no difficulty in inferring the dry-particle stoichiometry in the present experiments. In almost all cases, the dry-particle stoichiometry corresponded to a known crystalline form. Although not at-tempted in the present work, it would be possible to circumvent this problem completely by inserting a dry particle of known stoichiometry into the chamber.
However, it is believed that the generation of the ions was related to the high ac voltage on the ring, that the ion generation process was aided by water vapor and impurities on the surfaces of the apparatus, and that suitably charged ions were captured by the particle. As a result, the net charge on the particle could decrease over the course of an experiment.
The rate of charge loss was typically less than about 0.1
%
per hour. When decharging occurred, the change in particle charge was assumed to occur linearly with time between two successive dry balancing voltage determinations. In most cases, this procedure amounted to only a very small correction to the calculated solute concentration for a given steady state. The decharging process, while noticeable, did not introduce a significant uncertainty in the calculation of the solute concentration from the ratio of dry and wet balancing voltages.large to that when it is small is actually less than that calculated from the ratio of the balancing voltages for the two particle states, introducing a systematic underestimation of the solute concentration in the droplet that increases as the particle mass increases.
By changing the ac field while observing a dry particle in the presence of a horizontal gas fl.ow, we determined the balancing voltage for a particle of constant mass as a function of the average displacement of the particle from the center of the chamber. The trajectory of the particle could be easily measured using a calibrated, movable hairline reticle. The magnitude of the decrease in vertical de field strength with increasing radial distance away from the center was estimated from our numerical calculations of the de field within the elec-trodynamic balance. The increase in balancing voltage required as the particle oscillated at greater and greater distances from the center of the chamber cor-responded exactly to our numerical estimation of the decrease in the de field. In the measurements of particle mass as a function of chamber relative humid-ity, the systematic underestimation of the weight fraction solute for the largest amplitude oscillations encountered was less than 0.01 at the highest humidities measured. At lower humidities, the systematic error was even smaller.
nominal concentration of 10.00 molal, the uncertainty in molality corresponding to a 0.01 uncertainty in the weight fraction solute is approximately 0.22 molal or about 2
%.
A additional question that needs to be addressed is whether the charge will affect the thermodynamics of the suspended particle. First, we note that in the 60 Hz ac field, a suspended aqueous electrolyte droplet will behave as a conductor. Therfore, the excess charge will reside on the droplet surface, and there will be no electric fields within the particle. The presence of a surface charge can alter the phase equilibrium between a droplet and the surrounding vapor. According to a result obtained by Fletcher, cited by Rubel
[1],
the correction to the vapor pressure over a solution droplet due to the surface charge is given byIn E_ = -2q2ww(f - 1)
Po 7rpERTd; (10)
where p and p0 are the vapor pressures over the droplet in the presence and ab-sence of surface charge, respectively, q is the surface charge, Ww is the molecular
weight of water, f is the dielectric constant of the solution, and p is the solution density. The smallest particles that we studied had a diameter of about ten microns, and the maximum charge was less than 106 elementary charges. For a
ten-micron diameter water droplet with 106 elementary charges, eq 10 predicts
that the surface charge will have a negligible effect on the vapor pressure above the droplet.
absorbed all the light incident upon it and that heat dissipation was limited to conduction alone, heating of the particle due to the laser beam was found to be insignificant. Estimates of the magnitude of the radiation pressure and photophoretic force due to the laser beam's interaction with the particle showed that these phenomena are also unimportant. Furthermore, no evidence that the laser beam influenced the suspended particles was observed in the experiments.
Results and Discussion
Water Activity Measurements and Deliquescence
Measurements of particle mass as a function of relative humidity were performed for eleven different salts at 20 "C. In most cases, measurements for a given salt were made on two or more particles. For a given salt, the results from particle to particle and for different measurements on the same particle generally agreed to within the experimental uncertainties described above. An attempt was made to measure the deliquescence humidity for each salt. Crystallization measurements were also made, and these are presented and discussed in Part III of this work [7].
upper and lower bounds were measured. The meaning of the bounds given in Table 1 for the deliquescence humidity is that deliquescence did not occur at the lower humidity but did occur at the upper humidity. Thus, the deliquescence humidity lies somewhere in this range.
Using the dry-particle compositions listed in Table 1, the weight fraction solute was calculated for each steady state from the measured dry and wet balancing voltages. In Figures 5-15, the measurements of the weight fraction solute are shown as a function of relative humidity for each of the salts studied. Each point represents a different steady state. Also shown are data from the literature. Where the present results can be compared with literature data, the agreement is generally within our experimental uncertainty. In most cases, data were not available in the literature for water activity as a function of concentration at 20 "C, so literature data at 25 "C were used for comparison. For a given solute concentration, the change in water activity for a temperature change from 20 "C to 25 "C is generally much less than 0.001 [31], well within our experimental uncertainty.
chloride for which good agreement is obtained, even at very low humidities.
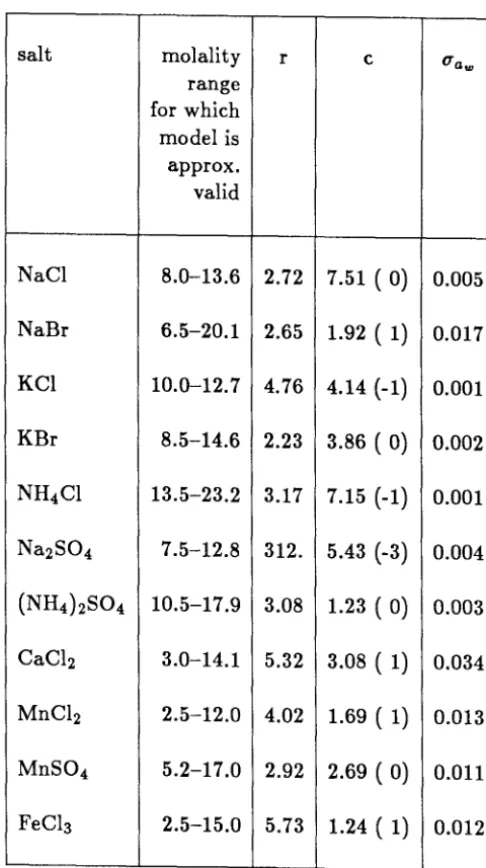
For each salt, the literature data and experimental data represented in Figures 5-15 were combined, molalities were calculated from the weight fraction solute, and the resulting data for water activity dependence on molality were fitted by a least-squares procedure to a polynomial of the form
(11)
The coefficients of the best-fit polynomial, the standard deviation between the polynomial's predictions and the data, and the highest molality for which the fit is valid are given in Table 2. While the accuracy of these fits is less than that for data obtained by the isopiestic method, these polynomials represent our data to within the experimental uncertainty and extend well beyond the range of most previous determinations. Two polynomial fits are presented for ammonium sulfate. One fit includes our results and those given by Robinson and Stokes [27]. The second fit also includes the results reported by Richardson and Spann [4].
increas-ing solute concentration, this observation was not surprisincreas-ing. The volatilization rate was relatively low when the particle was dry. Between any two successive dry states, the particle lost at most a few percent of its solute mass. In general, longer times were spent reaching steady state at higher humidities than those for lower humidities, and so, the solute mass lost by volatilization was roughly the same during each of the various steady states. In order to calculate the droplet concentrations in the experiments, it was therefore assumed that the decrease in solute mass between any two successive dry balancing voltage determinations decreased the same amount during each wet steady state. As with the treatment of the decharging phenomenon, the uncertainty in solute molality introduced by this assumption is relatively small.
The most thermodynamically stable crystalline form was obtained for sodium chloride, potassium chloride, potassium bromide, ammonium chloride, and ammonium sulfate. For these salts, it is seen in Table 1 that the mea-sured deliquescence humidities were consistent with the available literature data.
With sodium bromide, sodium sulfate, and calcium chloride, manganese chlo-ride and manganese sulfate, the dry particles obtained were not the equilibrium crystalline forms. As expected, each of these exhibited a lower deliquescence humidity than that of the most stable phase at 20 "C. The sodium bromide and sodium sulfate particles both crystallized to their known, anhydrous crystalline form.
The water activity results for CaC12 were consistent with a dry-particle
this stoichiometry, the calcium chloride particles did not appear to crystallize. Instead, when dried at a humidity of 0.10 at 20 "C, the particles consistently attained the same CaClz · 4(H20) stoichiometry. The particles did not exhibit
a deliquescence above a certain humidity but simply absorbed water as relative humidity was increased above 0.10. From the solubility of o:CaC12 • 4(H20) and
,BCaC12 • 4(H20) crystalline forms at 20 "C, we estimated from our water activity
results that deliquescence would be expected at relative humidities of 0.24 or 0.19, respectively. Thus, our deliquescence observations suggest that the dry particles of CaClz · 4(H20) were not crystalline. Instead, the particles may have
been gelatinous or glassy.
The CaClz particles were dried further from the CaC12 • 4(H20) state
by increasing the temperature from 20 "C to 50 "C while keeping the absolute humidity constant. In this process, the particle lost almost half of its water. A further temperature increase at constant absolute humidity, to 90 "C, dried the particle slightly more and the resulting particle had a stoichiometry of CaC12 •
2(H20). Measurements of the balancing voltage at high temperatures were
difficult because of buoyancy-driven flows within the chamber. A variability of 5
%
in balancing voltage was found in repeated measurements at elevated temperatures, at least ten times higher than the variability found at 20 "C. The behavior of our calcium chloride particles upon heating are reasonably consistent with the recent results of Meisingset and Gronvold [32], who found that a bulk sample of CaC12 • 4(H20) dehydrated to CaC12 • 2(H20) at 45 "C.the dry particles did not correspond to a particular, known crystalline phase. Manganese chloride droplets appeared to crystallize, however, while manganese sulfate droplets, like the calcium chloride droplets, did not. For manganese sulfate, the dry particle's stoichiometry was not changed when dried at 50 °C or 85 °C. Drying at temperatures higher than 20 °C was not attempted for manganese chloride. As discussed earlier, the composition of the dry particles for these two salts had to be estimated by matching our measurements to the known aw (m) properties reported in the literature for low molalities. From the estimated dry composition, the solute concentration at any other balancing voltage could be estimated.
Manganese sulfate is unusual in that there are three different crystalline hydrates that have very similar thermodynamic stabilities 20 °C. From solubility data for the various MnS0 4 crystalline hydrates [26] and the dependence of water activity on concentration for manganese sulfate solutions, we have estimated the deliquescence humidities for MnS04 · 5(H20), MnS0 4 · 4(H20), and MnS0 4 ·
l(H20) to be 0.847, 0.839, and 0.822, respectively, at 20 °C. The manganese
sulfate particles deliquesced in the relative humidity range 0.51-0.55, much lower than the deliquescence points for the above crystalline phases. Because the particle's mass at humidities slightly greater than the observed deliquescence humidity was the same whether the particle had come from a dry state or from a state at a high humidity, we can conclude that the manganese sulfate was completely dissolved after deliquescence occurred. Thus, the dry particles of manganese sulfate, with an overall stoichiometry of MnS0 4 · 2.8(H20), may
Other investigators have experienced difficulties in working with man-ganese sulfate and manman-ganese chloride aqueous solutions. In an attempt to measure the solubility of manganese sulfate in water, Rard [23] explained the observed variability in solubility by suggesting that the solid phases obtained were a mixture of metastable hydrates of unknown composition, and that the solid phase underwent continuous changes with time. In the same investigation, Rard also found that the solid phase obtained upon crystallization of manganese chloride from solution did not correspond to a known crystalline form.
Ferric chloride solutions in suspended droplets at constant humidity grad-ually lost mass. Slow polymer or colloid formation is known to occur in aqueous solutions of inorganic ferric salts [33]. In the highly concentrated ferric chlo-ride solutions within our suspended droplets, it is possible that polymeric or colloidal iron-hydroxide species were being formed, removing ferric ions from the solution and lowering the pH. As the pH is lowered, the evaporation of HCl from the droplet would be enhanced. A loss of HCl and the loss of water due to a decrease in dissolved ferric and chloride ions could have accounted for the observed decrease in the droplet mass with time.
crystalline forms of the various ferric chloride hydrates all deliquesce at relative humidities far below 0.77. Thus, our deliquescence observations suggest that at least part of the iron in the particle was present in a form
(e.g.,
a polymeric ferric hydroxide species) more thermodynamically stable than any of the known, crystalline ferric chloride hydrates.Solute Activity Coefficients
The chemical potential of the solute in an electrolyte solution, µ, may be expressed as
(12)
where µ0 is the chemical potential of the solute in a hypothetical, one molal solution which behaves ideally, vis the number of ions formed when one molecule of the electrolyte dissolves, /± is the mean molal solute activity coefficient, and m± is the mean solute molality. The mean solute molality is defined by
(13)
where m+ and m_ are the cation and anion molalities, and V+ and v_ are the stoichiometric coefficients of the cation and anion.
Changes in the chemical potential of the solute are related to changes in the chemical potential of the solvent through the Gibbs-Duhem equation, integration of which leads to
where </>, the osmotic coefficient, is given by
</> = -1000.0 ln aw
mww (15)
Using the polynomial expressions for the water activity as a function of molality given in Table 2, the integral in eq 14 was evaluated numerically. The lower limit of the integral was taken to be 1 molal for all salts, and the value of the mean molal solute activity coefficient at this reference concentration was taken from the literature. In this way, the solute activity coefficient for each salt was calculated as a function of molality, and the results of this calculation are shown in Figures 16-18.
increases with increasing concentration.
Ion association generally increases with increasing ionic charge, size, and polarizability. The sulfate ion, with its high charge and polarizability, is highly associative with most cations in aqueous solution. Thus, it is understandable that the three sulfate-containing electrolytes studied exhibited relatively low solute activity coefficients.
Ion hydration typically increases with increasing ionic charge and de-creasing ionic size. Also, cations are believed to be hydrated more extensively than anions [35,36]. In comparing the relative magnitudes of the solute activity coefficients for the uni-univalent salts with a common anion shown in Figure 16, it is apparent that cation hydration increases in the order NHt
<
K+<
Na+. As expected, this ordering is the inverse of the relative ordering of the sizes of these cations. In light of their higher activity coefficients, the multiply-charged cations appear to be more extensively hydrated than the singly-charged cations. Of all the salts studied in this work, calcium chloride appears to be the most extensively hydrated. The relative ordering of cation hydration suggested by the solute activity coefficient results is consistent with other estimates of the hydration of ions in solution [37,38].recognizing that, at high concentration, the water in the solution becomes in-creasingly scarce. In fact, at very high concentrations, there may not even be enough water in the solution to hydrate the ions to their normal level. Thus, it is understandable that the most extensively hydrated salt, calcium chloride, is affected most strongly by this phenomenon. It is possible that ion associa-tion begins to play a role in these highly concentrated soluassocia-tions. In the limit of very high concentrations, ion association must eventually occur, for there is not enough water to keep the ions apart.
The behavior of the solute activity coefficients for sodium sulfate and manganese sulfate is interesting. The maximum in the /±(m) curve for sodium sulfate occurs at a concentration for which there are seven water molecules per solute molecule. For manganese sulfate, the/± ( m) curve goes through a plateau at a concentration of 4-5 waters per solute molecule. It is intriguing that these stoichiometries correspond to stable crystalline phases for the two salts. Con-centrated electrolyte solutions are very highly ordered, but it might be expected that the structure of the solution would be particularly ordered at special con-centrations, equivalent to stoichiometries that are particularly favored. Thus, it appears that the thermodynamics of concentrated electrolyte solutions can be influenced by special configurational effects.
high concentrations, such as the effects due to the scarcity of water, have been demonstrated experimentally.
Because the solute activity coefficients calculated from experimental data were compared with the predictions of several electrolyte solution models (see below), it was desired to estimate the uncertainty in our calculated /±(m) due to uncertainties in the measured water activities and balancing voltages. This was accomplished in the usual way from
db±(m)]
=W-::a~m)
d[awiJ'
+ [
0
·;~m)
d[mrr
(16)
The partial derivatives in eq 16 were obtained by differentiating eq 14, and the resulting expression for the uncertainty contained an additional integral. The 0.01 uncertainty in water activity and weight fraction solute estimated above were used for the calculations. Detailed results for the uncertainty in the solute activity coefficient as a function of molality will not be presented here, but for all salts, the uncertainty in In/± was in the range 0.10 to 0.35. Examples of these uncertainty calculations are shown in Figures 19-21, discussed below, in which the calculated solute activity coefficients are compared against the predictions of electrolyte solution models.
Electrolyte Solution Models
in that salt-specific model parameters are obtained by fitting the model to the experimental data.
Pitzer's Method
Pitzer and coworkers have developed an effective and widely used model for electrolyte solutions [39,40]. In this model, it is assumed that the behavior of electrolyte solutions can be described by a combination of terms characterizing the long-range and short-range forces between ions and molecules in solution. An improved Debye-Huckel-type electrostatic term is derived for the long-range interactions. For the short-range forces, a virial expansion in concentration is employed in which the virial coefficients are a function of ionic strength. The virial coefficients characterizing a particular single-electrolyte solution depend on three parameters, /3~L {3~f, and
C!z·
With these parameters, the water activity and solute activity coefficient can be predicted. Equations giving the water activity and solute activity coefficient as a function of concentration are presented elsewhere [39,40] and will not be repeated here.Model predictions, obtained using the parameter values derived by Pitzer and Mayorga [40] from low concentration data, have been compared with our data. Pitzer's equations employ two additional parameters, a and b, for which values of a
=
2.0 and b=
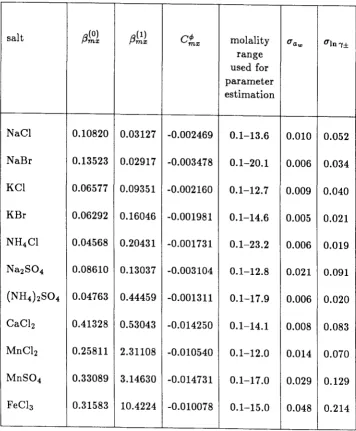
1.2 have been recommended. These values were used in the calculations. As examples, the solute activity coefficients predicted by Pitzer's method and those calculated from our experimental results are given as a function of concentration for calcium chloride in Figure 19 and potassium bromide in Figure 20. The uncertainties in our calculated solute activity coef-ficients are also shown. With potassium bromide, the agreement is quite good, but with calcium chloride, there is a large discrepancy at high concentrations. These salts were chosen as representative of the range of success found when Pitzer's method was used to predict solution properties at higher concentra-tions than were used in the original fit of the parameters. The results of these calculations for all the salts studied are summarized in Table 3.Using a least-squares fit to water and solute activities over the full range of our data together with data from the literature, we have estimated new pa-rameters to be used with Pitzer's equations for the salts studied in this work. The water activities for this fit were calculated from the
aw (
m) polynomial fits given in Table 2. Solute activity coefficients for the fit were calculated from theaw(m)
polynomials at high concentrations and taken from the literature at low concentrations. The parameters estimated from this procedure and the success of Pitzer's method in representing the experimental data are presented in Ta-ble 4. Figures 19 and 20 also show examples of the agreement obtained with these re-estimated parameters for the concentration dependence of the solute activity coefficient.Local Composition Model for Electrolytes
Chen et al. [44] have developed a local composition model for electrolyte solutions. Like the Pitzer model, short-range and long-range interactions are treated separately and then combined for a complete description of the elec-trolyte solution. This model uses the modified Debye-Huckel-type electrostatic expression obtained by Pitzer [39] to characterize the effects of long-range forces. The short-range forces are treated using a variation of the local composition model of Renon and Prausnitz [45]. This model, developed for non-electrolyte liquid mixtures, postulates that the local composition around a molecule in solu-tion is determined by the energetics of the interacsolu-tions between the molecule and the other entities in solution. It is further assumed [46] that the distribution of species around a central molecule is governed by a Boltzmann-type expression. Chen and coworkers made two important modifications to the usual local com-position formulation in order to account for the physics of electrolyte solutions. First, it was stipulated that ions of like charge cannot be immediate neigh-bors in the solution. Second, it was assumed that the immediate environment surrounding each solvent molecule is electrically neutral. Recently, these inves-tigators have extended their local composition model to allow mixed-electrolyte solutions [47] and mixed-solvent electrolyte solutions [48] to be treated.
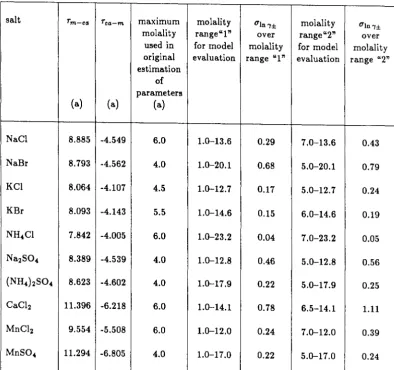
Chen et al. [44] derived expressions for the solute activity coefficient and solvent activity for a solution containing anions, cations, and a molecular sol-vent [49]. Their model requires the specification of two salt-specific parameters,
solution. The molecule-salt parameter, Tm-ca, is the difference in the
dimen-sionless interaction energies between the molecule-ion pair and the cation-anion pair. The salt-molecule parameter, Tca-m' is the difference in the dimensionless
interaction energies between the ion-molecule pair and the molecule-molecule pair. With these two adjustable parameters, this model was very successful in its description of the thermodynamics of aqueous electrolytes over the range of available literature data [44].
As with Pitzer's method, we first compared our data with the predic-tions of this model using the parameters estimated in the original work. These parameters were obtained from data at relatively low concentrations. It was found that the given parameters worked satisfactorily for some of the salts but not for others. As an example of one case in which it did not, the results for sodium bromide are presented in Figure 21. In most cases, the deviation at high concentrations was greater than the experimental uncertainty. The results of this comparison are summarized in Table 5. In general, the agreement found with Chen's low-concentration parameters was slightly better than that obtained from Pitzer's equations and the corresponding low-concentration parameters.
the re-estimated parameters for sodium bromide are also shown in Figure 21.
Thus, as with Pitzer's method, it is not advisable to use this local com-position model to predict thermodynamic properties at concentrations much higher than those used to determine the salt-specific parameters for the model. With re-estimated parameters, however, the model can successfully correlate the thermodynamic properties of many aqueous salt solutions over the entire range of the experimental data.
BET Model of Robinson and Stokes
Robinson and Stokes [36] postulated that ion-solvent forces are more im-portant than ion-ion forces in determining the thermodynamic properties of highly concentrated electrolyte solutions. By treating the solvent as an adsor-bate and the electrolyte as a substrate, they constructed a model of electrolyte solutions based on adsorption theory. Using the BET adsorption isotherm, Robinson and Stokes hypothesized that the dependence of the water activity on concentration should be consistent with
maw 1 e -1
- - - = -
+
--aw55.51(1 - aw) er er (17)
in which r is the total number of water molecules in completed monomolecular hydration layers around both the anion and cation. For an enthalpy of adsorp-tion Eads and an e
![Table 1: Stoichiometric amount of water in crystal, deliquescence, and molality range of data; (a) Ref [24] at 25 "C; (b) Ref [25] at 20 "C; (c) deliquescence relative humidity estimated from International Critical Tables solubility data at 20 "C (Ref [26]](https://thumb-us.123doks.com/thumbv2/123dok_us/962658.609464/67.619.107.518.157.617/stoichiometric-deliquescence-deliquescence-relative-estimated-international-critical-solubility.webp)
![Table 3: error Molality range for which coefficients given in Table 2 are valid, standard in fit of aw ( m) data over this range, and sources of literature data used in polynomial fits; (a) fit of data frorn this work and frorn Ref [27]; (b) fit of data in](https://thumb-us.123doks.com/thumbv2/123dok_us/962658.609464/69.611.155.454.148.598/table-molality-coefficients-table-standard-sources-literature-polynomial.webp)
![Table 4: Evaluation of Pitzer's model usmg parameters estimated from low-concentration data; (a) from Ref [40]](https://thumb-us.123doks.com/thumbv2/123dok_us/962658.609464/70.611.116.503.189.590/table-evaluation-pitzer-model-usmg-parameters-estimated-concentration.webp)