IN THE MAP KINASE SIGNALING MODULE
Thesis by
Stephen Chapman
In partial fulfillment of the requirements For the degree of
Doctor of Philosophy
CALIFORNIA INSTITUTE OF TECHNOLOGY
Pasadena, California 2009
A
CKNOWLEDGEMENTSFirst and foremost, I would like to acknowledge my advisor, Anand Asthagiri. His most inspirational qualities (in the scientific sense) are his deep curiosity, insightful guidance, and his conscientious scientific analysis. Navigating the everyday life of research, which can be characterized by extended bouts of frustration tied together by brief periods of euphoric success, requires diligence and focus. Anand’s tireless patience, steady encouragement, and positive motivation were vital to my development and accomplishments here at Caltech.
To the members of the Asthagiri group, Nicholas Graham, Claudiu Giurumescu, Niki Galownia, Melissa Pope, Keiichiro Kushiro, Jin-Hong Kim, Paul Minor, and Ehsan Jabbarzadeh, I thank you for providing assistance, advice, and a welcoming work environment. I am particularly grateful to Claudiu for readily lending a helping hand with all things math, coding, and computers. And to Nick, thank you for helpful discussions, elder guidance, and weekly tacos from Ernie’s.
I would also like to thank my thesis committee, Mark Davis, Christina Smolke, and Paul Sternberg, for their comments and advice. Caltech is a wonderful community in which to pursue science, encouraging seamless collaboration between labs and departments, in large part due to the generosity of the faculty that work here.
members readily shared their time and knowledge to my benefit. I would like to thank Rusty Lipford for getting me started with yeast, Dane Mohl for tirelessly answering my many questions and supplementing my reagent stock, and Nathan Pierce for helpful discussions about my project. I would especially like to thank Geoff Smith and Heenam Park, who in addition to their assistance with experiments, gave me a home in the Deshaies lab by generously sharing their bench space with me.
A
BSTRACTQUANTITATIVE PERFORMANCE AND TRADEOFFS IN THE
MAP KINASE SIGNALING MODULE January, 2009
Stephen Chapman, B.S. University of California, Berkeley M.S., Chemical Engineering, California Institute of Technology Ph.D., Chemical Engineering, California Institute of Technology
Intracellular signal transduction networks propagate and integrate the information that cells sense from environmental stimuli. The quantitative performance of signaling networks regulates cell decisions, and aberrations in network performance lead to pathologies such as cancer. The mitogen-activated protein (MAP) kinase cascade is a highly-conserved signaling module that regulates diverse cellular processes, such as proliferation, differentiation, and apoptosis in eukaryotic species ranging from yeast to human. While the principal components and mechanisms that define the MAP kinase module are well established, our understanding of and ability to tune its quantitative performance is limited. Here, we probe more deeply how the quantitative properties of the MAP kinase module may be affected by variations in the expression levels of the key constituents of the cascade—kinases, phosphatases and scaffolds.
lifetime—depend on the relative abundances of the two core components of the MAPK module, kinases and phosphatases. We identify a reduced metric termed the ‘resistance to activation’ that predicts the quantitative properties of the module across a wide range of parameter values. Its predictive utility extends to dynamic properties such as signal lifetime, which often dictates the MAP kinase’s effect on cell function. Our analysis highlights tradeoffs in design, as not all quantitative attributes of the module can be simultaneously optimized. Thus, the resistance to activation captures the fundamental principles that determine cascade behavior and can be exploited to guide quantitative redesign of the MAP kinase module.
T
ABLE OFC
ONTENTSAcknowledgements ... iii
Abstract...v
Table of Contents ...vii
List of Figures ...x
List of Tables ...xii
CHAPTER I. Introduction ... 1
1. The canonical MAP kinase cascade ...1
2. Quantitative attributes of MAP kinase pathways ...5
2.1 Ultrasensitivity: The MAP kinase module as a biochemical switch...5
2.2 Bistability: Discrete transitions and biochemical ‘memory’...8
2.3 Signal dynamics: Transient versus sustained MAP Kinase responses lead to distinct cellular fates ...9
2.4 Protein scaffolds quantitatively affect MAP kinase output...11
3. Current results: The effect of varying the expression levels of module components on the quantitative performance of the MAP kinase cascade...13
4. References...16
CHAPTER II. Resistance to signal activation governs design features of
the MAP Kinase signaling module ... 20
1. Abstract...20
2. Introduction...21
3. Model Development - Schematic and Equations ...26
4. Results...30
4.1 Model construction identifies most tangible design opportunities ...30
4.2 Sustained input and steady-state features...30
4.2-1 Potency...33
4.2-2 Range of output ...35
4.2-3 Signal amplification...37
4.2-4 Transient input and module dynamics ...39
4.4 Relaxation of resistance parameters...47
5. Discussion ...53
6. Appendix...59
7. Acknowledgements ...62
8. References...63
CHAPTER III. Quantitative effect of scaffold abundance on signal
propagation... 67
1. Abstract...67
2. Introduction...68
3. Results and Discussion ...71
3.1 Modulation of scaffold expression level ...71
3.2 Effect of scaffold on signal throughput and pathway ultrasensitivity ...72
3.3 Closer examination of the Ste5 module ...75
3.4 Sensitivity of signal quality to scaffold abundance ...79
3.5 Potential implications for natural and synthetic scaffold-based modules...80
4. Materials and Methods...82
4.1 Strains...82
4.2 Plasmid constructs ...82
4.3 Western blot...83
4.3-1 Cell growth and lysis ...83
4.3-2 SDS-PAGE – quantitative Western blots only...84
4.3-3 Immuno-blotting...85
4.3-4 Analysis – quantitative Western blots only...86
4.4 Flow cytometry...86
4.5 Halo assays for α-factor sensitivity ...87
5. Acknowledgements ...88
6. Supplementary Data ...89
6.1 Quantitative Western blot analysis ...89
6.2 Dose-response properties as a function of Ste5 abundance ...90
6.3 Signal fidelity is robust to perturbation in Ste5 expression...92
7. References...94
CHAPTER IV. Future work... 97
2. The effect of scaffold abundance on signal dynamics in the MAP kinase mating
pathway ...99
3. Extension of resistance metric to a scaffold-based MAP kinase cascade...100
4. Investigation of MAP kinase design properties that result from scaffold dimerization ...101
4.1 Robustness to perturbation in scaffold abundance ...102
4.2 Dimerization may augment the scaffold’s contribution to signal fidelity...104
L
IST OFF
IGURESFigure I-1. MAP kinase model schematic. ...2
Figure I-2. MAP kinase scaffolds direct signal flow...5
Figure I-3. Hill equation characterizes MAP kinase ultrasensitivity. ...6
Figure I-4. MAP kinase signal duration controls cell behavior. ...10
Figure I-5. MAP kinase signal propagation biphasically depends on scaffold concentration. ...12
Figure II-1. Model schematic...22
Figure II-2. Temporal profile of module output in response to a step input: the effect of varying the relative amount of phosphatase versus kinase. ...31
Figure II-3. Module dose-response to changes in the relative amount of phosphatase versus kinase...32
Figure II-4. Input potency...34
Figure II-5. Dynamic range of module output. ...36
Figure II-6. Signal amplification versus attenuation...38
Figure II-7. Temporal profile of module output following instantaneous loss of input....41
Figure II-8. Output decay in semi-log format...42
Figure II-9. Half-life of Erk signal in response to an exponential decay in input. ...43
Figure II-10. The dependence of half-life of Erk signal on the resistance to activation for wide range of perturbations in !s and !s...45
Figure II-11. The dependence of dynamic range of module output on resistance to activation for wide range of perturbations in !s and !s...46
Figure II-12. The dependence of input potency on resistance to activation for wide range of perturbations in !s and !s. ...47
Figure II-13. Dynamic range as a function of single stage resistances. ...51
Figure II-14. Potency as a function of single stage resistances. ...52
Figure II-15. Sensitivity analysis of the ability of module resistance to predict half-life due to changes in !s and !s for perturbations in !i...59
Figure II-17. Sensitivity analysis of the ability of module resistance to predict half-life
due to changes in !s and !s for perturbations in !i. ...61
Figure III-1. The Ste5 scaffold and the pheromone MAP kinase pathway in S. cerevisiae. ...69
Figure III-2. Modulating the expression level of the scaffold Ste5. ...71
Figure III-3. Sensitivity analysis of mating pathway response to perturbation in scaffold abundance...73
Figure III-4. Perturbation of scaffold abundance quantitatively alters phenotypic response...75
Figure III-5. Phospho-MAPK response to perturbation in Ste5 expression...76
Figure III-6. Quantitative measurements of phospho-MAP kinase and pFUS1-GFP responses. ...76
Figure III-7. Scaffold-limited and Ste7-limited regimes of signaling...78
Figure III-8. Quantitative Western blot of Ste5myc abundance. ...89
Figure III-9. Dose-response curves of pFUS1-GFP as a function of Ste5 abundance...91
Figure III-10. Signal fidelity is robust to perturbations in Ste5 abundance...93
Figure IV-1. Scaffold dimerization permits signal activation for incompletely bound complexes via trans-phosphorylation. ...103
Figure IV-2. A shared signaling intermediate can facilitate signal leakage. ...105
L
IST OFT
ABLESTable II–1. Five classes of dimensionless parameters specify module attributes...29
Table III–1. Yeast strains used in this study...82
Table III–2. Plasmids used in this study...83
CHAPTER I.
I
NTRODUCTIONIntracellular signal transduction networks propagate and integrate the information that cells sense from environmental stimuli (Asthagiri and Lauffenburger, 2000). The quantitative performance of signaling networks regulates cell decisions in complex microenvironments, and aberrations in network performance lead to pathologies, such as cancer (Hanahan and Weinberg, 2000). It has been proposed that signaling networks are composed of modular sub-networks and that a quantitative understanding of these modular building blocks would provide deeper insights into cellular decision-making (Asthagiri and Lauffenburger, 2000; Hartwell et al., 1999). One such prominent signaling module is the Mitogen-Activated Protein (MAP) kinase cascade. This signaling cascade controls diverse cellular processes, such as proliferation, differentiation, and apoptosis in eukaryotic species ranging from S. pombe to H. sapiens (Lewis et al., 1998). While the principal molecular components and mechanisms that define the MAP kinase module are well established, how these components and mechanisms work together to determine the quantitative performance of the module remains an area of intense research. A better understanding of this relationship between individual module components and the integrated behavior of the module would provide design strategies for re-engineering module performance by targeting critical components within the module.
1.
The canonical MAP kinase cascade
(MAPKK), which in turn phosphorylates and activates MAPK (Figure I-1). This structure is a widely recurring motif in intracellular signaling pathways across a range of species and has, therefore, garnered the label of a “signaling module.”
I
MAPKKK MAPKKK* PMAPKKK
MAPKK MAPKK* PMAPKK
MAPK MAPK*
PMAPK
Output I
Raf Raf* PRaf
Mek Mek*
PMek
Erk Erk* PErk
Output Stage 1
Stage 2
Stage 3
Figure I-1. MAP kinase model schematic.
The canonical MAP kinase cascade is depicted above as three serially-activated kinases (Ks), balanced at each stage of the cascade by a deactivating phosphatase
(Ps). On the right, the Erk subfamily is shown.
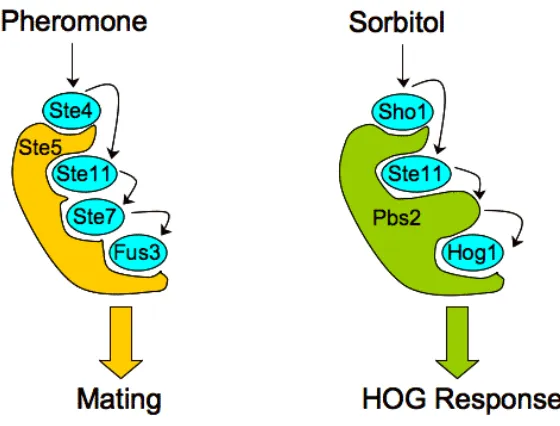
MAP kinase modules play a key role in many non-mammalian eukaryotic species as well. In Saccharomyces cerevisiae, multiple MAP kinase modules regulate diverse responses such as mating, invasive growth, and the high-osmolarity glycerol (HOG) stress response (Gustin et al., 1998). Consistent with the conserved architecture, the yeast mating pathway consists of three serially-activating kinases: Ste11 (MAPKKK), Ste7 (MAPKK), and Fus3 (MAPK). Pheromone-mediated stimulation of this pathway culminates in Fus3 activation, which precipitates cell cycle arrest and morphological changes associated with mating (Gustin et al., 1998; Widmann et al., 1999).
The activation and deactivation of MAP kinases is driven by the opposing actions of upstream kinases and protein phosphatases, respectively. Generally, signaling pathways require the constitutive action of protein phosphatases in order to dampen kinase activity when stimulus is absent or has been removed, restoring kinases to their inactive state (Keyse, 2000). Protein phosphatases also contribute to the quantitative performance of MAP kinase modules. By altering their expression level, protein phosphatases modulate MAP kinase signal properties, ultimately influencing cell behavior (Bhalla et al., 2002; Keyse, 2000).
widespread prevalence (and in contrast to the kinases of the MAP kinase cascade), MAP kinase scaffolds share little structural homology between orthologous pathways, leaving only functional similarities to define and guide our understanding of signaling scaffolds.
Figure I-2. MAP kinase scaffolds direct signal flow.
2.
Quantitative attributes of MAP kinase pathways
2.1 Ultrasensitivity: The MAP kinase module as a biochemical switch
coefficient (nH)1 is used to quantify the sharpness of the curve, and has been generalized
[image:18.612.209.428.164.371.2]to describe the degree of the ultrasensitive response (Huang and Ferrell, 1996).
Figure I-3. Hill equation characterizes MAP kinase ultrasensitivity.
As the Hill coefficient increases, the dose-response curve becomes more switch-like. The non-sigmoidal Michaelis-Menten curve (nH=1) serves as a reference for
comparison.
In Huang and Ferrell’s model of the MAP kinase cascade, a particular form of multi-step activation that results in an ultrasensitive response is identified. In the model, the activation of MAPKK and MAPK by MAPKKK and MAPKK, respectively, proceeds through a distributive, two-collision mechanism rather than through a processive, one-collision mechanism. Experimental studies in Xenopus oocytes confirmed that the
1 The Hill coefficient compares the ‘steepness’ of a stimulus/response curve to that of the
activation of p42 MAP kinase by Mek indeed occurs by a distributive, two-collision mechanism (Ferrell and Bhatt, 1997; Huang and Ferrell, 1996). Furthermore, the multi-level cascade structure itself contributes to the overall ultrasensitive response through multiplicative amplification of the individual responses at each stage (Brown et al., 1997; Ferrell, 1997; Kholodenko et al., 1997). The model predicts that the distributive activation mechanism, in concert with the combinatorial effect of the cascade structure, can result in an ultrasensitive response characterized by a Hill coefficient of 4.9. These predictions are in excellent agreement with experiments performed in Xenopus oocyte extracts (Huang and Ferrell, 1996).
However, experimental analysis of MAP kinase activation in intact Xenopus
2.2 Bistability: Discrete transitions and biochemical ‘memory’
Bistability in signaling networks has generated particular interest due to its ability to explain discrete, often irreversible, transitions that are commonly observed in biology (Sible, 2003). The maturation of Xenopus oocytes is an excellent example of a cellular event that progresses through distinct, stable phases. The ultrasensitive MAP kinasse response has been placed at the center of the biochemical network that controls the irreversible transition inherent in Xenopus oocyte maturation (Ferrell, 2002). By adjusting the gains of the positive and negative feedback loops, a monostable, switch-like response can bifurcate into a bistable, hysteretic response (Ferrell and Xiong, 2001). Experimental analysis has provided abundant evidence confirming that the Mos/Mek/p42 MAP kinase cascade indeed controls and stably maintains the irreversible oocyte maturation decision (Ferrell and Machleder, 1998; Xiong and Ferrell, 2003).
expression leads to signal adaptation2, and (2) the continued presence of MKP after adaptation serves to attenuate any subsequent stimulation of the network. Thus, MKP not only precipitates signal adaptation, but also confers a ‘memory’ function by temporally preventing re-activation of the network.
2.3 Signal dynamics: Transient versus sustained MAP Kinase responses lead to
distinct cellular fates
In addition to ultrasensitivity and bistability, the MAP kinase cascade is known to communicate biochemical information via its dynamic response. The MAP kinase response in PC12 cells serves as a paradigm that demonstrates the relevance of signal duration (Figure I-4): stimulation with EGF leads to a transient response that promotes proliferation, while stimulation with Nerve Growth Factor (NGF) leads to a sustained response that induces neuronal differentiation (Marshall, 1995). A similar transient versus sustained response occurs in S. cerevisiae, where a common MAP kinase cascade mediates two developmental options—invasive growth and mating. Yeast grows invasively when Kss1 activation is sustained, while when activated in a transient manner, Kss1 helps support the mating response (Sabbagh et al., 2001).
Figure I-4. MAP kinase signal duration controls cell behavior.
To examine more deeply the mechanisms that determine transient versus sustained signaling, a model of the MAP kinase signaling pathway that focused on signal adaptation as a function of multiple forms of negative feedback was developed (Asthagiri and Lauffenburger, 2001). An important conclusion reached by this model analysis was that two forms of negative feedback—decoupling deactivation and constitutive deactivation—were required to achieve full signal adaptation. Although negative feedback could mitigate continued stimulation of the cascade, constitutive deactivators were required for the specific deactivation of the accumulated output.
An ancillary effect of the decoupling negative feedback was that of ultra-desensitization of the network. Ultra-ultra-desensitization describes a situation in which the signal output decays, and continues to decay, even in the presence of an increasing
2.4 Protein scaffolds quantitatively affect MAP kinase output
In addition to their role in determining signal specificity, scaffolds quantitatively contribute to signal output. Scaffolds are not simply passive platforms for binding signaling components. Rather, many functionalities of scaffolds, both hypothesized and verified, suggest that they actively participate in signal transduction. For example, scaffolds may orient bound kinases for optimal interaction, thereby providing a catalytic advantage for signal activation (Dard and Peter, 2006). Some scaffolds form dimers, permitting both a cis- and a trans-phosphorylation mechanism for facilitating signal activation (Yablonski et al., 1996; Yasuda et al., 1999). Finally, recruitment of pathway effectors to scaffold complexes can quantitatively influence signaling output, a property that has been recently exploited to synthetically tune network behavior (Bashor et al., 2008).
throughput at high scaffold concentration is combinatorial inhibition, an effect that arises when too much scaffold interferes with the optimal formation of competent signaling complexes (Figure I-5).
Figure I-5. MAP kinase signal propagation biphasically depends on scaffold concentration.
3.
Current results: The effect of varying the expression levels of module
components on the quantitative performance of the MAP kinase
cascade
In Chapter II, we use a computational approach to delineate how four quantitative properties of the MAP kinase module—responsiveness to input, dynamic range of output, signal amplification, and signal lifetime—depend on the relative abundances of the two core components, kinases and phosphatases. We uncover a reduced metric termed the ‘resistance to activation’ that predicts the quantitative properties of the MAP kinase module across a wide range of parameter values. This resistance metric successfully predicted signal lifetime, revealing two distinct regimes of signal decay: (1) stimulus limited decay and, (2) resistance limited decay. The resistance also captured other module properties such as the dynamic range and the responsiveness to input. Our analysis shows that all module attributes cannot be simultaneously optimized, revealing tradeoffs in module design. Thus, the resistance to activation captures the fundamental principles that determine cascade behavior and can be exploited to guide quantitative redesign of the MAP kinase module.
4.
References
Asthagiri, A.R., and D.A. Lauffenburger. 2000. Bioengineering models of cell signaling.
Annu Rev Biomed Eng. 2:31-53.
Asthagiri, A.R., and D.A. Lauffenburger. 2001. A computational study of feedback effects on signal dynamics in a mitogen-activated protein kinase (MAPK) pathway model. Biotechnol Prog. 17:227-39.
Bardwell, L. 2006. Mechanisms of MAPK signalling specificity. Biochem Soc Trans. 34:837-41.
Bashor, C.J., N.C. Helman, S. Yan, and W.A. Lim. 2008. Using engineered scaffold interactions to reshape MAP kinase pathway signaling dynamics. Science. 319:1539-43.
Bhalla, U.S., and R. Iyengar. 1999. Emergent properties of networks of biological signaling pathways. Science. 283:381-7.
Bhalla, U.S., and R. Iyengar. 2001. Robustness of the bistable behavior of a biological signaling feedback loop. Chaos. 11:221-226.
Bhalla, U.S., P.T. Ram, and R. Iyengar. 2002. MAP kinase phosphatase as a locus of flexibility in a mitogen-activated protein kinase signaling network. Science. 297:1018-23.
Brondello, J.M., A. Brunet, J. Pouyssegur, and F.R. McKenzie. 1997. The dual specificity mitogen-activated protein kinase phosphatase-1 and -2 are induced by the p42/p44MAPK cascade. J Biol Chem. 272:1368-76.
Dard, N., and M. Peter. 2006. Scaffold proteins in MAP kinase signaling: more than simple passive activating platforms. Bioessays. 28:146-56.
Ferrell, J.E., Jr. 1997. How responses get more switch-like as you move down a protein kinase cascade. Trends Biochem Sci. 22:288-9.
Ferrell, J.E., Jr. 1999. Building a cellular switch: more lessons from a good egg.
Bioessays. 21:866-70.
Ferrell, J.E., Jr. 2000. What do scaffold proteins really do? Sci STKE. 2000:PE1.
Ferrell, J.E., Jr. 2002. Self-perpetuating states in signal transduction: positive feedback, double-negative feedback and bistability. Curr Opin Cell Biol. 14:140-8.
Ferrell, J.E., Jr., and R.R. Bhatt. 1997. Mechanistic studies of the dual phosphorylation of mitogen-activated protein kinase. J Biol Chem. 272:19008-16.
Ferrell, J.E., Jr., and E.M. Machleder. 1998. The biochemical basis of an all-or-none cell fate switch in Xenopus oocytes. Science. 280:895-8.
Ferrell, J.E., and W. Xiong. 2001. Bistability in cell signaling: How to make continuous processes discontinuous, and reversible processes irreversible. Chaos. 11:227-236.
Goldbeter, A., and D.E. Koshland, Jr. 1981. An amplified sensitivity arising from covalent modification in biological systems. Proc Natl Acad Sci U S A. 78:6840-4.
Hartwell, L.H., J.J. Hopfield, S. Leibler, and A.W. Murray. 1999. From molecular to modular cell biology. Nature. 402:C47-52.
Huang, C.Y., and J.E. Ferrell, Jr. 1996. Ultrasensitivity in the mitogen-activated protein kinase cascade. Proc Natl Acad Sci U S A. 93:10078-83.
Keyse, S.M. 2000. Protein phosphatases and the regulation of mitogen-activated protein kinase signalling. Curr Opin Cell Biol. 12:186-92.
Kholodenko, B.N., J.B. Hoek, H.V. Westerhoff, and G.C. Brown. 1997. Quantification of information transfer via cellular signal transduction pathways. FEBS Lett. 414:430-4.
Levchenko, A., J. Bruck, and P.W. Sternberg. 2000. Scaffold proteins may biphasically affect the levels of mitogen-activated protein kinase signaling and reduce its threshold properties. Proc Natl Acad Sci U S A. 97:5818-23.
Lewis, T.S., P.S. Shapiro, and N.G. Ahn. 1998. Signal transduction through MAP kinase cascades. Adv Cancer Res. 74:49-139.
Marshall, C.J. 1995. Specificity of receptor tyrosine kinase signaling: transient versus sustained extracellular signal-regulated kinase activation. Cell. 80:179-85.
Matten, W.T., T.D. Copeland, N.G. Ahn, and G.F. Vande Woude. 1996. Positive feedback between MAP kinase and Mos during Xenopus oocyte maturation. Dev Biol. 179:485-92.
Pearson, G., F. Robinson, T. Gibson, B.-E. Xu, M. Karandikar, K. Berman, and M. Cobb. 2001. Mitogen-activated protein (MAP) kinase pathways: Regulationand physiological functions. Endocrine Reviews. 22:153-183.
Sabbagh, W., Jr., L.J. Flatauer, A.J. Bardwell, and L. Bardwell. 2001. Specificity of MAP kinase signaling in yeast differentiation involves transient versus sustained MAPK activation. Mol Cell. 8:683-91.
Sible, J.C. 2003. Cell biology: thanks for the memory. Nature. 426:392-3.
Widmann, C., S. Gibson, M.B. Jarpe, and G.L. Johnson. 1999. Mitogen-activated protein kinase: conservation of a three-kinase module from yeast to human. Physiol Rev. 79:143-80.
Xiong, W., and J.E. Ferrell, Jr. 2003. A positive-feedback-based bistable 'memory module' that governs a cell fate decision. Nature. 426:460-5.
Yablonski, D., I. Marbach, and A. Levitzki. 1996. Dimerization of Ste5, a mitogen-activated protein kinase cascade scaffold protein, is required for signal transduction. Proc Natl Acad Sci U S A. 93:13864-9.
CHAPTER II.
R
ESISTANCE TO SIGNAL ACTIVATION GOVERNSDESIGN FEATURES OF THE
MAP K
INASE SIGNALING MODULE1.
Abstract
Given its broad influence over numerous cell functions, redesigning the mitogen-activated protein (MAP) kinase signaling module would offer powerful means to engineer cell behavior. Early challenges include identifying quantitative module features most relevant to biological function and developing simple design rules to predictably modify these features. This modeling study delineates how features such as signal amplification, input potency and dynamic range of output may be tuned by manipulating chief module components. Importantly, the model construction identifies a metric of resistance to signal activation that quantitatively predicts module features and design trade-offs for broad perturbations in kinase and phosphatase expression. Its predictive utility extends to dynamic properties such as signal lifetime, which often dictates MAP kinase effect on cell function. Taken together, we propose that predictably altering MAP kinase signaling by tuning resistance is not only a feasible engineering strategy, but also one exploited by natural systems to allow each MAP kinase to exert pleiotropic effects in a context-dependent manner. External stimuli not only activate kinases, but also alter phosphatase expression and activity, thereby reconfiguring a single module for quantitatively distinct modes of signaling such as transient versus sustained dynamics, each with unique effects on cell function.
2.
Introduction
The MAP kinase family of serine/threonine protein kinases are found among species ranging from S. pombe to H. sapiens (Lewis et al., 1998; Pearson et al., 2001). In mammals, MAP kinases have been implicated in regulating cell migration, apoptosis, proliferation and differentiation. Because of its broad influence, establishing strategies to redesign MAP kinase signaling would offer powerful means to engineer cell behavior. Recently, conceptual understanding of how MAP kinase pathways utilize scaffolds to maintain fidelity of stimulus-response relationships was elegantly exploited to engineer an artificial scaffold that converts yeast cell response to !-factor from the natural mating response to an osmolarity-stress response (Park et al., 2003). Notably, the growing emphasis to transform conceptual description of signaling mechanisms into quantitative, dynamical models (Endy and Brent, 2001) would further expand the design space to include the possibility of quantitatively tuning information flow through signaling networks. This work focuses on early challenges to such quantitative redesign of the ubiquitous MAP kinase signaling module.
Most MAP kinases signal through a well-preserved mechanism, involving serial activation of a cascade of enzymes (Figure II-1). The wide recurrence of this cascade structure has garnered its label as a ‘signaling module’ and has raised interest in the inherent utility of its design. Classically, these cascades have been viewed as signal amplifiers (Pearson et al., 2001). Each active enzyme at the top of the cascade ( *
1
E ) activates several targets (E2); and each of those activated target enzymes *
2 E
turn, activate its own group of targets (E3). Hence, magnitude amplification has been conjectured as a canonical function for enzyme cascades.
Figure II-1. Model schematic.
The MAP kinase module consists of a cascade of three kinases (Ei) and their counterpart phosphatases (Pi) as illustrated on the left. On the right, an example cascade is depicted: the Erk subfamily of MAP kinases is activated via the Raf-Mek-Erk cascade. An input initiates the cascade by activating the topmost kinase, while the module output is the number of active MAP kinase, in this case Erk. At each stage s, phosphatases catalyze the deactivation of kinases. More generally, at stage s an activated, upstream kinase (Ks!1) converts its substrate (Ks) from an inactive to active form. Meanwhile, phosphatases at each stage (Ps) deactivate the kinase. Although not depicted, each enzyme(E)-substrate(S) reaction involves the formation of an E!S complex:
!
E+S"E#S$E+P.
mechanisms external to the cascade (Schoeberl et al., 2002). A complementary approach focuses on the module, typically represented by a cascade of three kinases counterbalanced by constitutive deactivation enzymes (phosphatases) at each level of the cascade (Ferrell, 1996). Such models and congruent experimental work in Xenopus
oocyte extracts have demonstrated that mechanisms such as distributive, two-step kinase activation confers ultrasensitivity at each step of the cascade (Huang and Ferrell, 1996). Moreover, cascade structure helps to accumulate this ultrasensitivity from each stage, so that module output reveals switch-like, steady-state responses to changes in stimulus concentration (Brown et al., 1997; Ferrell, 1997). In addition, aforementioned scaffolding mechanisms have been analyzed using a similar modular approach, revealing that an optimal, intermediate scaffold concentration may be required for maximal signal (Levchenko et al., 2000).
reduce costs associated with growth factors necessary for ex vivo repopulation of tissue engineering scaffolds. Alternatively, in instances where the MAP kinase of interest, such as JNK, drives apoptosis or programmed cell death (Davis, 2000), it may be desirable to reduce its sensitivity to environmental stresses, with possible implications for cell culture maintenance in bioprocess applications.
Ultimately, even modules with altered sensitivity to stimulus must effectively communicate with downstream targets to elicit cellular response. In some instances, MAP kinase modules perform as a switch, shifting between on- and off-states (Huang and Ferrell, 1996). In order for this switch to impart disparate cellular responses, downstream effectors must clearly distinguish between on- and off-states. Thus, the module must communicate with output intensity of adequate dynamic range.
(Lewis et al., 1998). This work delineates how these features—responsiveness to stimulus, range of output, and signal lifetime—and other quantitative attributes of the MAP kinase module may be re-engineered by manipulating experimentally-accessible system variables.
Importantly, a second challenge is to guide redesign of these quantitative features of information flow with a priori knowledge of potential consequences caused by specific manipulations. Our model construction identifies a metric of resistance to signal activation, which serves as such a predictive tool. Thus, the resistance effectively predicts both steady-state and dynamic features of the module for broad perturbations in kinase and phosphatase expression levels. Notably, these system variables are manipulable using established techniques, such as RNA interference, antisense RNA or exogenous overexpression from mammalian expression vectors, making the proposed redesign strategies practically feasible. Taken together, we propose that predictably altering MAP kinase signaling by tuning resistance is not only a practical engineering strategy, but also one exploited by natural systems to allow each MAP kinase to exert pleiotropic effects on cell behavior.
3.
Model Development - Schematic and Equations
A first-level representation of the MAP kinase module involves three kinases in series, each activated by its predecessor. A schematic of such a cascade is shown in Figure II-1 for the Erk subfamily of MAP kinases. At each stage (s), there are two reactions (i=s,s+3), one catalyzed by the upstream activator, and the other by the
counteracting phosphatase. A representative pair (i=2,5) of reaction mechanisms for the second stage is given below:
!
Raf*+Mek"{Raf*#Mek}$Raf*+Mek* (1)
!
PRf+Raf*"{PRf#Raf*}$PRf+Raf (2)
where enzyme-substrate complexes are denoted by {E!S}. For Reaction 1, the association of Raf* and Mek is governed by the second-order rate constant
,2
k+ , while the
first-order rate constant for dissociation of the complex is given by k!,2. Finally, the rate of
product formation from this enzyme-substrate complex is dictated by the constant kcat,2.
In general, the rate constants of each enzyme-substrate reaction i is given by
!
k+,i, k!i,, and kcat,i where i=1!6.
Taking into account the free (I), active (I*) and Raf-associated (I*Raf
! ) forms of
T Ek, * Ek T Mk, * Mk T Rf, * Rf T Ek, Ek T Mk, Mk T Rf, Rf T
* T T
* T * T T * T * T T * T * T P } Erk P { = } { P } Mek P { = } { P } Raf P { = } { P P = P P = P P = Erk Erk = Erk Erk = Mek } Erk Mek { = } { Mek Mek = Mek Mek = Raf } Mek Raf { = } { Raf Raf = Raf Raf = I } Raf I { = } { I I = I I = ! ! ! ! ! ! ! ! ! ! ! ! * Ek * Mk * Rf Ek Mk Rf * * * * * * * Erk P Mek P Raf P P P P Erk Erk Erk Mek Mek Mek Mek Raf Raf Raf Raf I I I (3)
Among the 17 non-dimensional variables, the fraction of input species in the active state (I*) is provided as the driving function for the module. The values of the
remaining 16 unknown dimensionless variables are determined partly by the following seven mass balances:
} {
=
1 I I* I*Raf
! + + (4) } { } { } { =
1 1 1 *
Rf *
*
* I Raf Raf Mek P Raf Raf
Raf + +# ! + ! +" ! (5)
} { } { } { =
1 2 2 *
Mk *
*
* Raf Mek Mek Erk P Mek Mek
Mek+ +# ! + ! +" ! (6)
} {
} {
=
1 3 3 *
Ek *
* Mek Erk P Erk
Erk
Erk+ +# ! +" ! (7)
} {
=
1 *
Rf
Rf P Raf
P + ! (8)
} {
=
1 *
Mk
Mk P Mek
} {
=
1 *
Ek Ek P Erk
P + ! (10)
In conjunction with above, the following nine differential equations fully specify the behavior of the module:
!
dRaf* d" =
#1 "1{I
*
$Raf}% &2
#1#2"2'2 Raf *
Mek+ 1
"2'2 + 1 "2 ( ) * + ,
-{Raf*$Mek}%...
...% &4.1
#1"4'4
Raf*P Rf +
.1
"4'4
{PRf$Raf*}
(11)
!
dMek* d" =
#2 "2{Raf
*
$Mek}% &3
#1#2#3"3'3 Mek
*
Erk+ 1
"3'3 + 1 "3 ( ) * + ,
- {Mek*$Erk}%...
...% &5.2 #1#2"5'5
Mek*P Mk +
.2 "5'5
{PMk$Mek*}
(12) } { } { = 3 3 3 6 6 3 2 1 3 6 3 3 * Mk Mk * * * Mek P P Mek Erk Mek d dErk ! + " ! # $ % # $ & & & % ' $ & $ (13) } { } { = 4 1 1 1 1 1 1 1 * Rf *
* I Raf P Raf
RafI d dRaf ! + ! + " # $ % # & % # ' # (14) } { } { = 5 2 2 2 2 2 2 1 2 * Mk *
* Raf Mek P Mek
MekRaf d dMek ! + ! + " # $ % # & % # & ' # (15) } { } { = 6 3 3 3 3 3 3 2 1 3 * Mk *
* Mek Erk P Mek
ErkMek d dErk ! + ! + " # $ % # & % # & & ' # (16) } { 1 1 = 4 4 4 4 4 1 4 * Rf * Rf
Rf P Raf P Raf
d dP ! "" # $ %% & ' + + ( ) * ) * ) + , ) (17) } { 1 1 = 5 5 5 5 5 2 1 5 * Mk * Mk
Mk P Mek P Mek
d dP ! "" # $ %% & ' + + ( ) * ) * ) + + , ) (18) } { 1 1 = 6 6 6 6 6 3 2 1 6 * Ek * Ek
Ek P Erk P Erk
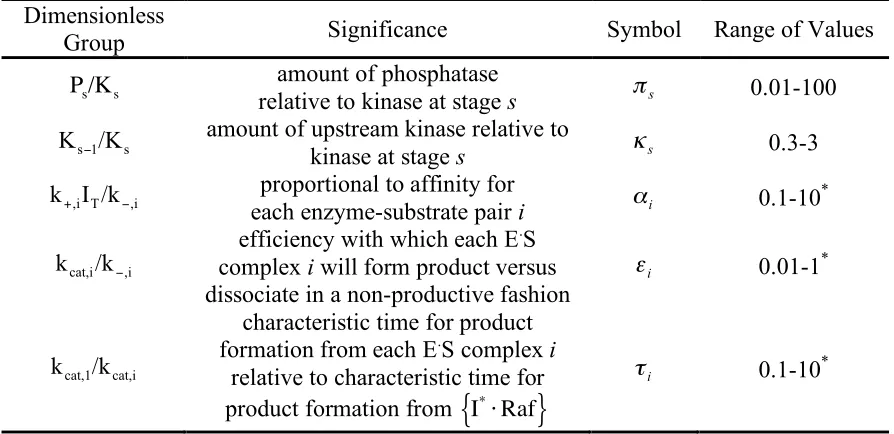
Appearing in Equations 4-19 are five classes of dimensionless parameters: !s, !s, !i,
i
! and !i. Their form, significance and range of values are summarized in Table II–1.
[image:41.612.83.530.204.421.2]Simulations were performed using Matlab v. 6.1 and the ode23s and fsolve subroutines.
Table II–1. Five classes of dimensionless parameters specify module attributes. Dimensionless
Group Significance Symbol Range of Values
!
Ps/Ks
amount of phosphatase
relative to kinase at stage s !s 0.01-100
s 1 s /K
K ! amount of upstream kinase relative to
kinase at stage s !s 0.3-3 i,
T i,I /k
k+ ! proportional to affinity for
each enzyme-substrate pair i !i 0.1-10*
i, i cat,/k
k ! efficiency with which each E .S
complex i will form product versus
dissociate in a non-productive fashion i
! 0.01-1*
i cat, cat,1/k
k
characteristic time for product formation from each E.S complex i
relative to characteristic time for product formation from
!
I*"Raf
{
}
i
! 0.1-10*
*Typical values for i
! , !i, !i were 0.6, 0.2 and 1, respectively (Asthagiri and
4.
Results
4.1 Model construction identifies most tangible design opportunities
Our model construction by dimensional analysis and further parameter grouping reveals five classes of dimensionless parameters, which govern module behavior (Table II–1). Three of these parameter classes (!i, !i, !i) involve rate constants, whose values are intrinsic properties of the reacting species. While these parameters clearly contribute to the quantitative properties of the module, more tangible design opportunities are offered by two other dimensionless groups. The first (!s) represents the amount of
phosphatase relative to kinase at each stage of the cascade. The second dimensionless group (!s) compares the expression level of an upstream kinase to the amount of its target at each stage. Thus, the values of these parameters are dictated by the expression levels of kinases and phosphatases, which are particularly attractive from a design perspective, since protein expression levels are readily adjustable in experimental systems using established techniques involving RNA interference, antisense RNA or mammalian expression vectors. Therefore, these two dimensionless groups are the focus of developing a redesign strategy.
4.2 Sustained input and steady-state features
copies per cell (Scheele et al., 1995). Therefore, non-zero values for the fraction of input species in its active state (I*) may range between 10 5 100
!
! . The module output is given
[image:43.612.174.436.193.440.2]by the fraction of Erk in its active state (Erk*).
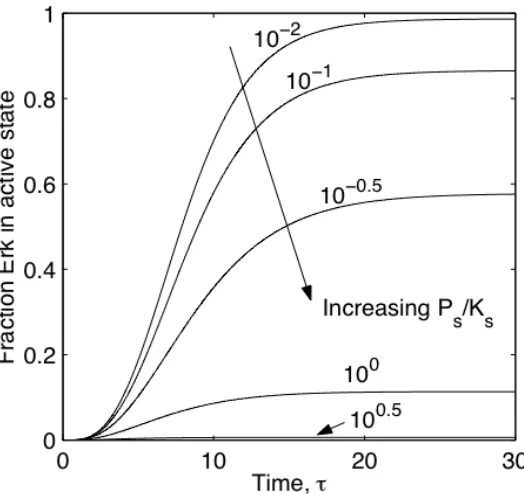
Figure II-2. Temporal profile of module output in response to a step input: the effect of varying the relative amount of phosphatase versus kinase.
Module was stimulated with a step input (I* =10!0.5), and the fraction of Erk in its active state was tracked over time. Simulation was performed for different relative amounts of phosphatases compared to kinases ( =10 2 100.5
! !
s
" ), while holding the
ratio of upstream to downstream components fixed (!s =1). Constitutive presence
of phosphatases does not confer adaptation to a sustained input but affects level of steady-state output.
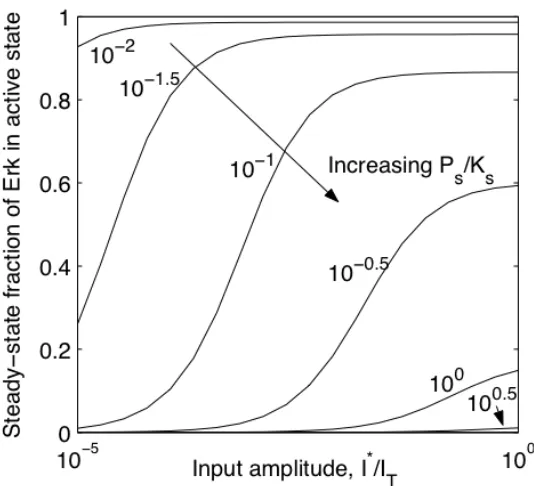
this cascade, the steady-state fraction of Erk in its active state (module output) displays sigmoidal dependence on non-zero input amplitude (I*) as shown in Figure II-3. This sigmoidal dependence has been shown to acquire steeper transition from minimal to maximal output, yielding switch-like behavior when kinase activation involves a two-step, distributive mechanism (Huang and Ferrell, 1996). Here, we consider three other properties—potency, range, and gain—which are crucial measures of this module's ability to propagate signal.
Figure II-3. Module dose-response to changes in the relative amount of phosphatase versus kinase.
The steady-state level of output was computed for different, non-zero input amplitudes for !s =1. For intermediate ratios of phosphatase to kinase expression level ( =10!1
s
" ), module output is a sigmoidal function of input amplitude.
However, if kinases dramatically outnumber phosphatases or vice versa, module becomes insensitive to changes in input. In one extreme ("s !0), module output
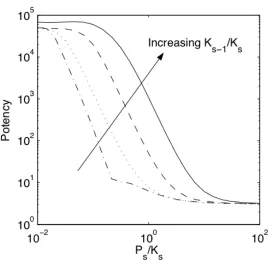
4.2-1Potency
Potency is a measure of how much input is required to elicit efficient module response. In experimental terms, stimulus potency is inversely related to the EC50, which is the effective concentration of stimulus (typically, a ligand) required to attain half-maximal response (e.g., cell proliferation). By direct analogy, the potency of input to the MAPK module is *
50
1/I , where * 50
I is the input amplitude which promotes medium level
of output. Module configurations that yield low values for * 50
I confer high potency to input as they enable low levels of input to efficiently propagate signal. We analyzed the dependence of input potency on module design, particularly focusing on components of the cascade which are most readily tunable experimentally.
The relative expression level of phosphatases to that of kinases (Ps/Ks =!s) at each stage s dramatically affects input potency. This is most clearly revealed in Figure II-3 by the rightward shift in the “dose-response” curves as !s is increased. In performing these simulations, the value of !s was assumed to be equal for each stage s, largely due to the lack of experimental data that would suggest otherwise and in part to remain consistent with previous treatments of the MAP kinase module (Huang and Ferrell, 1996). For high !s values, more phophatases are present to deactivate kinases, thereby increasing the threshold amount of input required to elicit module response. Values for potency were calculated from dose-response curves, and its dependence on !s
monotonically decreasing function of !s, with asymptotic upper and lower limits for low and high !s values, respectively.
Figure II-4. Input potency.
Aspects of the module dose-response (Figure II-3) may be tuned by altering module configuration.The potency of the input is inversely related to the amount of input ( *
50
I ) required to attain average module output. For fixed (!s), an increase in the relative amount of phosphatases (!s) reduces input potency, since more
input is required to elicit half-maximal response. This trend is preserved for all
0.5
10
= !
s
" (!"!), 100 (L), 100.5 ( !
! ), 101 (!). For fixed !s, increasing the
amount of upstream kinase relative to downstream target increases input potency.
upstream activators relative to its downstream target (Ks"1/Ks =!s). For fixed !s, input
potency is enhanced for higher relative expression levels of upstream activator (Figure II-4). For "s >!s, upstream activation outweighs deactivation at each stage, enabling high module output even for low input.
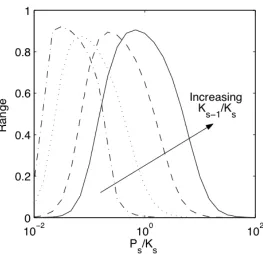
4.2-2Range of output
A second important attribute of the MAPK module is the range of output produced in response to a spectrum of non-zero input. This range is defined as the difference in output caused by full stimulation (i.e., all input species are active) versus minimal, non-zero input:
!
range = Erkss*
[
]
max input " Erkss *[
]
min input (20)While model results depict output as a continuous function of input, discrete numbers of active Erk molecules serve as physiological module output. Thus, a module whose range of output is large would possess more intermediate values of output with which to convey “higher-grain” information to the next module.
Module range demonstrates biphasic dependence on !s as shown in Figure II-5.
intermediate !s value, balanced phosphatase and upstream kinase activity enable a large
range of output to changes in input stimulation. This balance is affected not only by the dimensionless parameter !s, but also by the expression level of upstream activators relative to their downstream targets. Since upstream activation is enhanced for higher !s values, greater amount of phosphatases relative to kinases is required to balance activation. Thus, the !s value needed to optimize module range increases for higher !s
[image:48.612.175.438.310.564.2](Figure II-5).
Figure II-5. Dynamic range of module output.
The dynamic range of output is the difference in module output in response to maximum input versus minimum, non-zero input. This range is a biphasic function of the ratio of phosphatase to kinase expression level (!s) for =10!0.5
s
" (!"!),
0
10 (L), 100.5 (
!
! ), 101 (!). Thus, maximum range of output is achieved at an
optimum !s. An increase in the relative amount of upstream to downstream
4.2-3Signal amplification
While high-range modules “sense” low versus high input by producing maximally disparate output for these two extremes of stimulation, signal amplification quantifies the ability of the module to receive a certain amount of input and respond by generating even greater amount of output. Kinase cascades have been implicated as an optimal configuration to achieve such amplification (Pearson et al., 2001). In fact, amplification has been suggested to require greater amount of downstream kinase than upstream activator (i.e., !s <1). Thus, signal transfer from Raf to Mek has been
identified as an ideal point for amplification (Pearson et al., 2001) because Mek levels typically far exceed those of Raf (Ferrell, 1996). However, Mek and Erk are expressed typically at equimolar levels (Ferrell, 1996), suggesting that amplification may not be the chief purpose of this part of the cascade (Pearson et al., 2001).
We examined rigorously the dependence of signal amplification on relative expression level of upstream and downstream kinases (!s) and on the relative amount of phosphatases (!s). The gain (!) in signal strength from input to output was quantified by the ratio of number of active Erk at steady-state to the level of input:
!! " # $$ % & !! " # $$ % & ' T T * * I Erk = I Erkss (21)
where *
ss
Erk and I* are the fraction of each enzyme in their active state at steady-state
Figure II-6. Signal amplification versus attenuation.
For a given amount of input (I*=10!0.5), the signal gain (!) is quantified as the
ratio of number of active Erk species at steady-state to the number of active input species. The horizontal line (| | |) demarcates regimes yielding signal amplification (!>1) versus attenuation (!<1). Even if downstream kinases outnumber upstream activators ( =10!0.5(!"!
s
# )), signal attenuation occurs for high relative expression of phosphatases. Conversely, at low !s, amplification may occur even
for equimolar expression of upstream and downstream kinases ( =100
s
! (L)). If downstream kinases are outnumbered by upstream activators ( =100.5
s
! (!!), 101
(!)), the MAPK module serves only as an attenuator, regardless of phosphatase
expression levels. Taken together, the module may operate as a signal amplifier or attenuator.
reduces the driving force for activation in the next stage, thereby diminishing signal strength across the cascade. Hence, even if downstream kinases outnumber upstream activators, amplification is not assured.
In the other extreme, as "s !0, there is no restraint on kinase activation, and all available enzymes in each stage of the cascade are activated. The fraction of enzymes activated at each stage asymptotes to one (i.e., * 1
!
ss
Erk ), and signal gain across the module approaches a value dictated solely by the relative expression levels of kinases and input magnitude: !! " # $$ % & !! " # $$ % & !! " # $$ % & ' ( T T T T T T * T * T 0 Mek Erk Raf Mek I Raf 1 = I Erk = lim I I s ) (22)
In the case of equimolar expression level (!s =1), the gain asymptotes to 1/I*. Thus,
even for equimolar expression level of kinases, amplification is guaranteed provided all input species are not in their active state (i.e., I* <1).
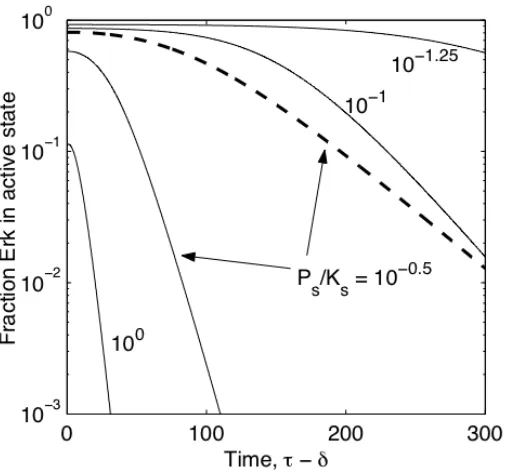
4.2-4Transient input and module dynamics
The module input represents upstream molecule(s) such as active Ras, which governs Raf activation. In many experimental systems, this upstream component undergoes transient activation and is better represented by a pulse, rather than a step input. To examine module performance to a transient input, a pulse input with lifetime ! and amplitude Io as follows was utilized:
!
I* = Io, 0"# <$ 0, # % $ &
'
The pulse input is represented by instantaneous activation and deactivation. Furthermore, ! is chosen as the time required for the system to reach pseudo-steady state upon receiving input Io. Thus, system response to loss of input may be analyzed independent of system response to receiving input.
Upon instantaneous input decay, the fraction of Erk in its active state also decays back to basal level as shown in Figure II-7 for fixed !s and !s. Signal decay requires
Figure II-7. Temporal profile of module output following instantaneous loss of input.
Upon removal of input at time ! , the module output decays to a basal level in a
two-phase process, involving an initial time-lag during which output does not change dramatically, followed by an active decay phase. For fixed !s =1, reducing
the amount of constitutive phosphatases relative to kinases ( =10!1.25 s
" )
significantly delays output decay. Thus, instantaneous loss of input enables complete adaptation of module output, provided constitutive phosphatases are expressed. In addition, even for a decay-permissive level of =10!0.5
s
" , doubling
the ratio of upstream to downstream kinase expression extends the lifetime of module output (!!).
Although a reduction in !s or an increase in !s elevates output lifetime, these
parameter changes also increase the level of output from which decay occurs. To determine whether the rate of signal decay is truly affected or whether extended signal lifetime is a byproduct of starting from a higher output, the temporal decay profiles were recast in a semilog plot (Figure II-8). Beyond a time-lag and during the decay phase,
(
*)
with respect to fraction of Erk in its active state (Erk*). Importantly, the slope of this
output decay, which is the apparent decay rate constant, is directly affected by changes in
s
[image:54.612.180.433.220.456.2]! and !s, showing that extended lifetime is not simply a byproduct of starting from a higher output signal.
Figure II-8. Output decay in semi-log format.
The decay curves from Figure II-7 are shown on a semilog plot. During the active decay phase, log(Erk*) decreases linearly with time, indicating a first-order
process with respect to active Erk. Moreover, both !s and !s determine the slope of this linear relationship—the apparent rate constant.
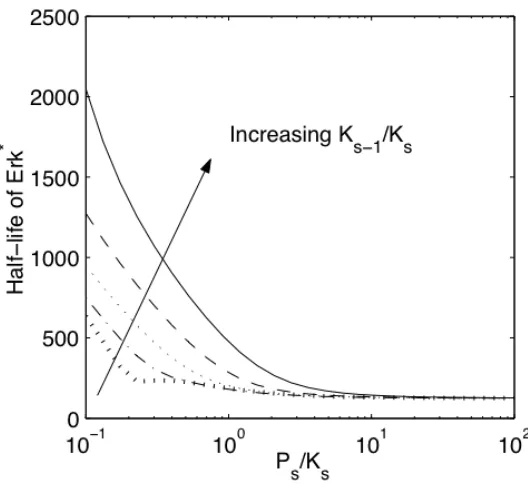
To better understand the relationship between decay rates of input and output, the instantaneous input decay was replaced with an exponential decay characterized by a half-life, input
1/2
reduces the half-life of module output (Figure II-9). However, this half-life is bounded by a lower limit, which approaches the half-life of the decaying input, emphasizing that this form of adaptation is fully dependent on loss of input.
Figure II-9. Half-life of Erk signal in response to an exponential decay in input.
Input amplitude (I*) was reduced exponentially with an arbitrary, non-zero
half-life, 1/2input =100
! . The time for module output to decay to 50% of its initial level was
calculated for various !s and !s values. While this half-life of active Erk may be
reduced, its lower bound is set by the half-life of input decay.
!
"s = 10
#0.5 (| | |), 0.25
10! ( ! "
! ), 100 (L), 100.25 ( !
! ), 100.5 (!).
4.3 Resistance to activation
It is evident that the dimensionless parameters !s and !s have opposing effects
phosphatases and upstream activators exert on kinase activity at each stage of the cascade. To determine if a single parameter accurately integrates these opposing effects, we defined a combined parameter as follows:
. / = ) /K K )/( /K P (
= s s s 1 s s s
s # " !
$ (24)
This parameter represents the expression level of phosphatase (Ps) relative to the total amount of upstream kinase (Ks!1), offering a net measure of resistance to signal activation at each stage of the cascade. The present treatment maintains that all stages have the same resistance, allowing overall module resistance to be equated to resistance at each stage.
To determine if this metric of resistance accurately predicts module behavior, the dependence of signal half-life on !s was examined. The half-life of output in response to an exponential decay in input was presented for independent variations in !s and !s in
Figure II-9. These data collapse into a single dependence on resistance to activation (Figure II-10), indicating that effects of changing !s and !s may be predicted by the
correlating parameter, !s. As resistance to activation increases, module output is more
easily diminished, thereby reducing the half-life of signal. In fact, the predictive utility of this metric of resistance is robust. Thus, for values of the rate constant-embedded dimensionless groups (!i, !i, !i) that span a range of two orders of magnitude, the
Figure II-10. The dependence of half-life of Erk signal on the resistance to activation for wide range of perturbations in !s and !s.
The half-life of module output depicted in Figure II-9 for =10 1 102 !
!
s
" and
!
"s = 10#0.5
($), 10#0.25
(%), 100
(!), 100.25(&), 100.5(') have been plotted as a
function of module resistance, #s ="s/!s. A single relationship is revealed between half-life of active Erk and resistance, encompassing all changes in !s and
s ! .
resistance ( 10!1
"
#s ) that is optimal for output range, the input potency is reduced by
[image:58.612.163.437.147.414.2]approximately 1.5 orders of magnitude (Figure II-12).
Figure II-11. The dependence of dynamic range of module output on resistance to activation for wide range of perturbations in !s and !s. Output range, which was depicted in Figure II-5 for =10 2 102
! !
s
" and
!
"s = 10 #0.5(
$), 100(
%), 100.5(
!), 101(&), shows a single, biphasic relationship to
resistance to activation. Thus, maximum range may be obtained by adjusting either s
! or !s to net a resistance
1
10!
"
#s (dotted line). The solid black line shows the
Figure II-12. The dependence of input potency on resistance to activation for wide range of perturbations in !s and !s.
Input potency, which was depicted in Figure II-4 for =10 2 102 !
!
s
" and
!
"s = 10#0.5
($), 100(%), 100.5(!), 101(&), shows a single, monotonically decreasing
relationship to resistance to activation. At an intermediate resistance that optimizes module range (dotted line), input potency is at least one order of magnitude below its maximum. The solid black line shows the analytic solution of the potency for a three stage cascade.
4.4 Relaxation of resistance parameters
The previous results were subject to the constraint that a single resistance
!
"s
( )
was uniformily applied to all stages of the MAP kinase module. We relaxed this constraint to allow unequal stage resistances
!
"1,"2,"3
stage resistance.) Previous work by Goldbeter and Koshland appropriately described the steady-state behavior of such a single stage system (Goldbeter and Koshland, 1981). To arrive at their solution, the authors made two key assumptions. First, they neglected the contribution of
!
I*"Raf
{
}
and!
PRf"Raf *
{
}
to the species balance of the substrate, Raf. Second, they assumed that the converter enzymes, I* and PRf, operate in the first orderregime, or that
!
RafT <<
k",1+kcat,1
k+,1 and RafT <<
k",4+kcat,4
k+,4 (25)
The following analytical expression describes the steady-state activation of the modified substrate
!
Rafss *
(
)
as a function of the rate constants and the total concentrations of the model components, where we have recast the equation using our dimensionless groups:s
! , !s, !i, !i and !i.
!
Rafss*= 1
1+"1
KM,1
KM,4 1 I* # $ % & ' (
, where KM,i =)i
(
1+*i)
+i ,sand "s=-s ,s
(26)
Note that the single stage resistance, ω1, falls cleanly out of the above equation, as suggested from our prior computational results. Generalizing this result to the second and third stages of the cascade, we obtain the following equations:
!
Mekss*=
1
1+"2 KM,2 KM,5
1 Raf* # $ % & ' ( (27) !
Erkss*= 1
1+"3
KM,3 KM,6
Now, to reconstruct an n-stage cascade using the above equations, it must further be assumed that there are no upstream interactions, i.e., the parameters and potential behavior of stage s + 1 does not influence the behavior of stage s. Then, the above equation can be iteratively substituted into itself to obtain a steady-state dose-response expression for any n-stage cascade. Following are the first three iterations:
!
Rafss*= 1
1+"1
KM,1 KM,4
1 I* # $ % & ' ( (29) !
Mekss*= 1
1+"2 KM,2 KM,5 1+"1
KM,1 KM,4
1 I* # $ % & ' ( # $ % & ' ( (30) !
Erkss*= 1
1+"3
KM,3
KM,6 1+"2 KM,2 KM,5 1+"1
KM,1 KM,4
1 I* # $ % & ' ( # $ % & ' ( # $ % % & ' ( ( (31)
The above dose-response curves can now be used to quantitatively predict any steady-state property of the cascade, including the dynamic range and potency. The dynamic range can be obtained in a straightforward manner by substituting Equation 30 or 31 into Equation 20. Below are the analytic equations for the range of a 2-stage and a 3-stage cascade:
!
ranges=2= 1
1+"2KM,2
KM,5 1+"1 KM,1 KM,4
1
Imax* # $ % & ' ( # $ % & ' ( ) 1
1+"2KM,2
KM,5 1+"1 KM,1 KM,4
1
Imin* # $ % & ' ( # $ % & ' ( (32) !
ranges=3