WiFi Access Point Selector Based
on the Network Delay
Pedro Mestre,
Member, IAENG,
Alexandre Fonseca,
Paulo Salgado, and Carlos Serodio,
Member, IAENG
Abstract—In WiFi, the algorithm used to choose the best candidate Access Point can vary from vendor to vendor, however it always involves the analysis of the Received Signal Strength Indication (RSSI) value. The simplest algorithm that can be implemented consists in choosing the Access Point that has the highest RSSI value. However, such an algorithm can lead to bad choices, for example when the Access Point with the best RSSI value has too many clients associated to it, which will be sharing the available bandwidth, while a further Access Point (with lower RSSI value) has no clients connected to it. Probably in this case the latter might offer a better network performance. To assess which is the best Access Point to connect to, in this paper it is presented a simple algorithm that is based in the network delay. Before choosing the best Access Point, the mobile station measures the network delay of the available Access Points, and chooses that with the lower delay. Te drawback is that this cannot be done off-channel, a connection must be made to the Access Point for the delay to be measured. Nevertheless, taking into consideration that that the overall network performance will be better, and if the user is using a nomad equipment (such as a laptop), this method is feasible. Results show that using network delay will lead to better choices. In one of the testing scenarios presented in this work, the method based on the network delay was able to obtain more than the double of best decisions in comparison to that using RSSI values (87.50% against 41.67%)
Index Terms—WiFi, IEEE802.11, NTP, handoff, network delay, access point selection
I. INTRODUCTION
A
LTHOUGH the roaming algorithm varies from vendor to vendor, [1], it involves the analysis of the Received Signal Strength Indicator (RSSI). When the RSSI value drops below a predefined threshold, the client will then select another Access Point, if available, based on its RSSI value. The simpler algorithm than can be used to select the bestManuscript received March 19, 2018; revised 5 April, 2018. This work has been supported by COMPETE: 01-0145-FEDER-007043 and POCI-01-0145-FEDER-006958, and FCT – Fundac¸˜ao para a Ciˆencia e Tecnologia within the Project Scope: UID/CEC/00319/2013 and UID/AGR/04033/201. P. Mestre is with Centro Algoritmi, University of Minho, 4800-058 Guimar˜aes - Portugal, and Centre for the Research and Technology of Agro-Environmental and Biological Sciences, CITAB, University of Tr´as-os-Montes and Alto Douro, UTAD, Quinta de Prados, 5000-801 Vila Real, Portugal, www.utad.pt, (phone: +351-259350363; email: [email protected]) A. Fonseca is with University of Tr´as-os-Montes and Alto Douro, UTAD, Quinta de Prados, 5000-801 Vila Real, Portugal, www.utad.pt, (email: [email protected])
P. Salgado is with Centre for the Research and Technology of Agro-Environmental and Biological Sciences, CITAB, University of Tr´as-os-Montes and Alto Douro, UTAD, Quinta de Prados, 5000-801 Vila Real, Portugal, www.utad.pt, (email: [email protected])
C. Serodio is with Centro Algoritmi, University of Minho, 4800-058 Guimar˜aes - Portugal, and Centre for the Research and Technology of Agro-Environmental and Biological Sciences, CITAB, University of Tr´as-os-Montes and Alto Douro, UTAD, Quinta de Prados, 5000-801 Vila Real, Portugal, www.utad.pt, (email: [email protected])
candidade Access Point is: connect to the Access Point with the higher RSSI value.
However, selecting the best candidate Access Point based only in the RSSI value, can sometimes lead to not so optimal, or even wrong, choices. There are some scenarios that we can think of, where a good RSSI value does not necessarily means that the link quality will be the best. For example when the Access Point with the highest RSSI value:
• shares the communications channel with other nearby Access Points, i.e., there is an overlap in the cells which will cause interferences;
• has more clients associated to it than other Access Points in the area, and therefore the available bandwidth will be shared with many users;
• has few clients, however they are using bandwidth intensive applications, causing the available bandwidth to be low.
In the above presented examples, if the mobile station chooses the Access Point with the best RSSI value, it might lead to a bad choice, because the network performance will not be optimal. This will lead to a bad user experience and probably some QoS requirements might not be fulfilled. In the above mentioned scenarios there can exist an Access Point with worse RSSI value (because it is further from the mobile station), which can have a better network service (e.g. because has no other clients associated to it).
Also, if the objective is to build a method to use in several types of devices, from various vendors, the use of RSSI can have some additional issues. In some previous projects, the authors have been using RSSI in Fingerprinting Location Algorithms [2], [3], [4], and it was noticed that some mobile devices cache the RSSI values. This means that in some cases, the algorithm could be using wrong and outdated data. Another issue is related to the fact that for the same Access Point, at the same location, and at the same moment, various Smartphone models will have different RSSI values [5]. This means that the developed method, if based in RSSI, could have to be tuned to the specific wireless device model (which could be made using the method proposed by the authors in [5]). However one objective of the authors is to develop a ready-to-use universal method (without the need of further calibrations).
TABLE I
EXAMPLE OFDATACOLLECTED IN ATESTINGPOINT
AP RSSI (dBm) Delay (ms) Speed (Mbps)
AP1 -49 6,30 13,13
AP2 -49 7,50 5,41
AP2 -71 3,90 14,79
AP4 -62 4,00 9,01
bandwidth, medium access, etc), network latency will also depend on factors such as the available bandwidth, channel congestion, noise level, and others. Therefore, measuring and comparing the communications delay for the several Access Points, we can estimate which might provide the best service. In this paper it is presented a method, suitable for laptop-like devices, that uses the the network delay to choose the best Access Point to connect to. Instead of choosing the Ac-cess Point based on the RSSI values, it analyses the network delay. To be noticed that the notion of best Access Point, in the context of this work, is the Access Point that provides the best available bandwidth. Other authors proposed efficient algorithms based on Fuzzy Logic to decrease the hand-off time in WiFi networks [6], which does not require a connection to the network. However their objective was to do fast handoff.
One of the objectives of this work is to develop a method that can be used in any network, without the the need to change the infrastructure, e.g. modify the firmware of the Access Points or add new network node with special functions. Therefore to measure the network delay it was used the NTP (Network Time Protocol) [7], which is widely available. Even though it was used a local NTP server in the tests presented in this paper, because the absolute delay is not used, the NTP server can be either located in the network infrastructure or it can be one of the public NTP servers that exist in the Internet (provided that no timeout occurs).
II. PROPOSEDSYSTEM
As above stated, not always the Access Point with the higher RSSI value is the best option. In table Table I it is presented some data, collected in one of our testing scenarios, which corroborates this.
In the table are presented data from four Access Points (AP1, AP2, AP3 and AP4), consisting of the RSSI value (in dBm), the delay (in ms) and the download speed (in Mbps). In this data sample it can be seen clearly that the best AP is not the one with the low RSSI value, but the one with the lower delay value.
A. How to Choose the Best Access Point
Using only RSSI values to select the best Access Point is a very straightforward method, because mobile stations can scan for nearby Acess Points without the need to connect to them. Also this operation can be done while in normal network operations.
In this paper authors present a method that will allow the selection of the best wireless network (at the moment) to connect to, but that has the trade-off that no other network
operations can be done while the mobile station is scanning for the best Access Point.
At the first sight this might look like a disadvantage that will make the proposed system unfeasible for use in a real life application. One can say that if we use only RSSI values to evaluate the best Access Point, the wireless node can re-associate to a new Access Point on the fly, since it has already in its memory a list of Access Point and their respective RSSI values.
Nevertheless, there are situation where a system such as the one authors present in this paper, will have no negative impact and in fact it can help to improve the network experience of the user. Some examples include (but not limited to): the initial network connection, when the user turns on WiFi or selects a new network (for example a student when arrives to a classroom and turns on his/her laptop); when the network performance degrades making it completely unusable, and the mobile station is connected to the Access Point with the best RSSI value. In this couple of examples the extra time needed to select the network will probably be compensated with a better network performance. Obviously that if we think of fast moving clients that cannot loose network connectivity, using RSSI only is a better option. However we can join both techniques and use RSSI only based algorithms while the network is performing well and use the proposed method when the network performance is not satisfactory to fulfill the QoS requirement of the client.
B. RSSI vs Delay Based Methods
Keeping as simple as possible the method to choose the best candidate Access Point, leads us to the need of modeling the network speed as a function of the RSSI value and the network speed as a function of the network delay.
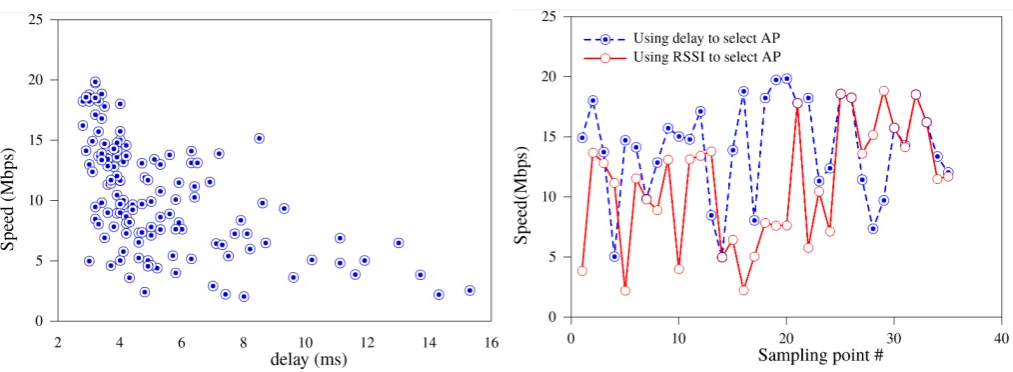
A plot representing the download speed as a function of the RSSI values is presented Fig 1, and in Fig. 2 it is plotted the network download speed as a function of the measured network delay. Both plots represent real data from one of testing scenarios used in this work.
Analysing these plots it can be concluded that there is no apparent correlation between the RSSI values and the effective network speed. We have good network performance both at high and low RSS values (e.g. around -40dBm and -70dBm). Also, bad network performance was achieved for the whole span of the RSSI values. Regarding to the plot of Fig. 2, it is noticeable that for high delay values we have poor network performance, and good network performance is achieved for low delay values. However, for lower delay values we also have some data samples with poor network performance.
Fig. 1. Download speed as a function of the RSSI value, for one of the testing scenarios.
Fig. 2. Download speed as a function of the delay value, for one of the testing scenarios.
performance, it is possible to select the best network, at least for most of the cases. Therefore, instead of looking to the isolated values of the delay we can make a comparison between these values for each sampling point, as in the example presented in Table I. So, for each sampling point it is selected the network with the lower delay. In Fig. 4 it is presented a comparison between the performance obtained when the Access Point was selected using the delay and when it was selected using the RSSI value. Notice that these values are from the same set that was used to build the previous plots.
For this testing scenario and conditions, in 65.71% of the cases, selecting the Access Point using the delay value was the best option, in 20% of the cases it had the same performance as selecting by RSSI value and only in14.29%
of the cases the lower RSSI was the best solution
C. Proposed Method
Based in the above preliminary values, authors propose in this paper an algorithm that bases its decision on the network delay to select the best candidate Access point. To connect to a wireless network, the client will do the following steps:
• Obtain a list of all Access Points in the area, for all
Fig. 3. Download speed as a function of the best delay value at each point in one the the testing scenarios.
Fig. 4. Comparison between the download speed when the network is selected using the RSSI or the delay value.
known networks or for the network that was selected by the user;
• For each Access Point in the list:
– Associate to the Access Point; – Connect to the network; – Measure the network delay.
• Associate to the Access Point with the lower network
delay;
• Connect to the network.
The above described procedure cannot be used while the mobile station is connected to a network, because the station must try to connect to all available networks and perform a delay evaluation test. This means that while the test is un-dergoing the system cannot do any other network operations.
D. Measuring the Time Delay
To measure the network time delay it was used the Network Time Protocol. This protocols allows clients to calculate the network latency to the NTP server:
• When the client sends a request, it sends to the server is current time (T1);
[image:3.595.48.555.266.452.2]• When the server responds to the client, it sends back to the client T1, together with T2 and the time of when the response is sent (T3);
• The client, upon reception of the server response,
records the local time (T4).
Even if the server and the client clocks are not synchronized, based onT1,T2,T3andT4, we can calculate the network delay:t=T4−T1−T3 +T2. An advantage of using NTP instead of ICMP (Internet Control Message Protocol) Echo Request and ICMP Echo Reply messages [8] (used byping
application), is that using NTP we can calculate the round trip time excluding any delay that might happen in the remote system (T3−T2).
Because NTP is universally available used to adjust com-puter clocks and because the proposed method is based in the comparison of delay values, and not the absolute delay, it is possible to implement the proposed system without the need to deploy a dedicated NTP server. It can be implemented using any of the public NTP servers that exist in the Internet. The only requirement is that the normal delay between the client and the server in low enough to avoid network timeouts.
Another key factor is that because this protocol is virtually used by almost all networked systems to adjust the time, usually firewalls do not block NTP traffic.
III. TESTINGSCENARIO ANDCONDITIONS
To develop and assess the proposed method it was collect data using classrooms at the University of Tr´as-os-Montes and Alto Douro. Three scenarios where used: two classrooms and a hallway connecting them, covered by a wireless network with four Access Points; two classrooms and a hallway connecting them, covered by a network with three Access Points; one classroom and hallway, and a wireless network with three Access Points.
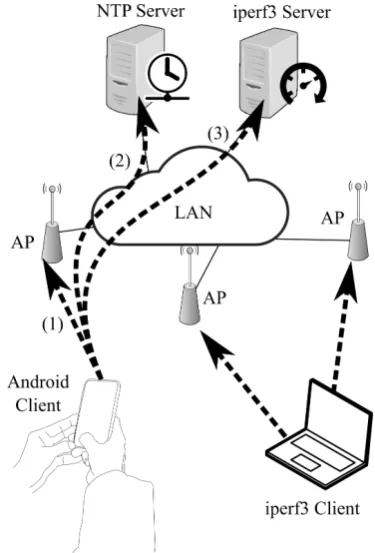
At each of those scenarios, it was used the architecture presented in Fig. 5. Besides the Access Points, connected using an Ethernet switch, there was also an NTP server and an iperf3 server.
Clients use NTP server to estimate the network delay and the iperf3 server was used to assess the network speed and to inject UDP packets in the network (to simulate the network load by clients). This network was deployed for these tests and is not a production network.
All Access Points use IEEE802.11g standard and are all the same make, model and firmware version.
In this scenario there are also two types of clients:
• A mobile client – an Android Smartphone, with an
application developed for this work, which scans for the available Access Points, connects to all Access Points, makes the delay measurement using NTP, measures the download speed usingiperf3and then saves all data in a .csvfile for off-line analysis;
[image:4.595.328.516.51.328.2]• One or two laptop clients, to inject UDP traffic in the network. This packet injection has as objective to simulate the network load that clients would cause. To measure the throughput of the network using the Android application it was usediperf3software [9]. This software was used to download, using TCP, data from the server to the mobile device for 10 seconds (which is the
Fig. 5. Architecture of the used testing scenarios.
default value used by this application). To be noticed that this download is made during the data collection to implement and test the algorithms. In the end application, that will select the best Access Point, only the network delay will be measured because. Measuring the delay takes less bandwidth and time than measuring the available bandwidth.
The same application (iperf3) was used to inject the UDP data stream in the network.
As shown in Fig. 5, to collect data, the Android client connects to an Access Point (1), after it contacts the NTP server to measure the network delay (2) and then contacts theiperf3server do measure the download speed (3). This procedure is made for all Access Points in the scenario.
IV. NUMERICALRESULTS
In Table II are summarised the results obtained in the first testing scenario, using four Access Points. In this test 35 samples were collected along the two classrooms. At each sampling point it was collected 10 samples of the network delay (with an interval of100ms). In this scenario data was collected when one station was injecting in the network a UDP stream of 10Mbps (Test 1) and when there was no network traffic (Test 2), i.e., there were no other stations connected to the WiFi network.
To build this table, the network selection was labeled as: ”Worse”, when the worse network was selected; ”Best”, when the best available network was selected; ”Good” otherwise. Data is distributed in columns according to the parameter used to select the network, either based on RSSI or the network delay values.
TABLE II
SUMMARY OF THERESULTSOBTAINED IN THEFIRSTTESTING SCENARIO
Worse Good Best
RSSI Delay RSSI Delay RSSI Delay
Test1 22,86% 0,00% 40,00% 31,43% 37,14% 68,57%
Test2 25,71% 20,00% 51,43% 45,71% 22,86% 34,29%
TABLE III
SUMMARY OF THERESULTSOBTAINED IN THESECONDTESTING SCENARIO
Worse Good Best
RSSI Delay RSSI Delay RSSI Delay
Test1 38,46% 15,38% 26,92% 19,23% 34,62% 61,54%
Test2 15,38% 11,54% 34,62% 26,92% 50,00% 65,38%
both cases the use of the network delay had less ”Worse” network selections (0.00% and20.00% against22.86% and
25.71%) and more ”Best” network selections (68.57% and
34.29% against37.14%and22.86%).
Table III was built using data collected in the seconds scenario. This was the same location as the previous scenario, however in this case three Access Points where used, to reduce the density of Access Points in the area (and get a more realistic scenario). Data was collected in 26 sampling points and at each point 10 samples of the network delay were saved.
For this second test, data shows the same trend, i.e., using the network delay values to choose the ”Best” network had a better performance than using the RSSI values. In this case, the method based on the delay had15.38%and11.54%
of ”Bad” choices against 28.46% and15.38% of the RSSI based method. Also the number of ”Best” choices was better (61.54% and65.38%against 34.62% and50.00%).
In a third test, whose results are presented in Table IV, 100 samples of the network delay value were collected at each sampling point. This test was made in the third scenario, using three Access Points.
The objective of this third test is to determine the impact of the number of samples in the quality of the solution. It is expected that few points will lead to worse results, however an increase of the number of samples will also impact the time needed to select the best Access Point. In this work the interval between the samples was set to100ms. This means that if 10 samples are used, this procedure will take around 1 second, if 100 samples are used 10 seconds will be needed, per Access Point.
This table presents the values for ”Worse”, ”Good” and ”Best” decisions, when RSSI is used to decide which is the best network, and when 1, 2, 3, 4, 5, 6, 7, 8, 9, 10, 20, 30, 40, 50, 60, 70, 80, 90 and 100 samples of the network delay are used. One third of the data samples was acquired with no traffic in the network, one third was collected with two stations injecting 10Mbps of UDP traffic in the network and one third with the two stations injecting 20Mbps in the network. The objective is to have a scenario more similar to those network conditions that can be found in the real life.
TABLE IV
SUMMARY OF THERESULTSOBTAINED IN THETHIRDTESTING SCENARIO,FORDIFFERENTTIMEDELAYSAMPLESIZES
Worse Good Best
RSSI 25,00% 33,33% 41,67%
1 sample 25,00% 25,00% 50,00%
2 samples 20,83% 16,67% 62,50%
3 samples 20,83% 12,50% 66,67%
4 samples 8,33% 16,67% 75,00%
5 samples 12,50% 12,50% 75,00%
6 samples 12,50% 16,67% 70,83%
7 samples 16,67% 20,83% 62,50%
8 samples 16,67% 20,83% 62,50%
9 samples 25,00% 16,67% 58,33%
10 samples 20,83% 20,83% 58,33%
20 sanples 16,67% 16,67% 66,67%
30 samples 12,50% 12,50% 75,00%
40 samples 12,50% 12,50% 75,00%
50 samples 8,33% 8,33% 83,33%
60 samples 4,17% 8,33% 87,50%
70 samples 16,67% 16,67% 66,67%
80 samples 12,50% 16,67% 70,83%
90 samples 4,17% 16,67% 79,17%
100 samples 16,67% 12,50% 70,83%
Fig. 6. Comparison of ”Best”, ”Good” and ”Worse” network selection, for different time delay sample sizes.
Results using one sample uses the value of the first delay value, results using two samples use the average of the first two delay values, and so on.
testing scenario and conditions. Even when only one sample is used, the performance is slightly better.
Data shows that, although some fluctuations exist, a higher number of samples will have better results. However even with a low number of samples (and consequently less time assessing the Access Point ”quality”) it is possible to have very good results. In this case even with only 5 samples it was possible to have 75%of ”Best” decisions.
Fluctuations found in the mean delay value can be due to the overlapping of radio channels. Because the WiFi network was deployed in an area where other wireless networks exist, it was impossible to avoid cell overlapping. Even though tests where made when few people where in the area, that number was not zero, and their network traffic might have made some interference. Also, data collection took around 40 minutes in this scenario, therefore the interference because of other users might not have been constant along that time.
V. CONCLUSION
In this paper it was presented a work in progress project to develop an universal method for selecting the best Access Point in a IEEE802.11 wireless network. This work was inspired by the need of a good WiFi connection of students’ laptops in classroom, to access course contents. With the proposed method, students’ laptops will be balanced among the available Access Points, providing a better network performance. The idea is to develop e method, that does not require any modification of the available infrastructures. Selection of the best Access Point is based in the network delay, and the method is simple: connect to the network with the lower delay. Using this method it was possible to achieve results up 87,50% ”Best” Access Point selections in our testing scenarios.
Although it was built an Android application to acquire data and to do the proof of concept, the authors’ objective is to obtain a method that can be used in most of the wireless devices. This application is able to scan the networks, force the Smartphone to associate itself to every Access Point and then do the delay measurements. The next logical step is to migrate this application to a fully functional application, both for mobile devices and laptops, that connects to a wireless network at user request.
The proposed method requires that the client connects to the network, for every Access Point, before selecting the best one, i.e. the Access Point that provides better bandwidth. However, to do this selection, the station cannot measure the available bandwidth, because this test would flood the wireless network with data packets, making it unusable if many clients are testing their connectivity simultaneously. Instead, the used solution was to measure the delay between the node and a NTP server. Results prove that this is a feasible method, and that based on the delay difference between the available Access Points, is was possible to achieve a very good performance.
Provide fast handover is not the objective of this work, but the proposed method will allow client to have a better network performance when they connect to the network. This means that the proposed method cannot provide seamless continuous connectivity to a roaming user, for example making a VoIP call. Nevertheless if the user is not moving, the proposed method will ensure the best bandwidth. Besides implementing an usable application for end users, it is also planned to implement a multicast communication system between all peers (because of its efficiency in implementing the group communications [10]), which will allow nodes to share the value of the delay for the Access Point that they are connected to. The idea is to have stations monitoring the link delay, which can be made while in normal network operation, and multicast this data to other nodes. When the delay of a node increases, it can try to change to an Access Point with lower latency. This means that probably it will be possible to provide fast handover for roaming clients. To avoid flooding of the network, these information can be sent using a protocol inspired in OSPF (Open Shortest Path First) routing protocol and concepts [11].
REFERENCES
[1] How does a client roam? [Online]. Available: https://www.wi-fi.org/knowledge-center/faq/how-does-a-client-roam
[2] P. Mestre, J. Cordeiro, L. Reigoto, L. Coutinho, P. Botelho, and C. Serodio, “Using propagation models to build fingerprint maps and assess location estimation algorithms performance,” inLecture Notes in Engineering and Computer Science: Proceedings of The World Congress on Engineering 2016, WCE 2016, 29 June - 1 July, 2016, London, U.K., 2016, pp. 571–576.
[3] P. Mestre, J. Cordeiro, and C. Serodio, “Multi fingerprint map for indoor localisation,” inLecture Notes in Engineering and Computer Science: Proceedings of The World Congress on Engineering 2015, WCE 2015, 1-3 July, 2015, London, U.K., 2015, pp. 599–604. [4] C. Serodio, L. Coutinho, H. Pinto, and P. Mestre, “A comparison of
multiple algorithms for fingerprinting using IEEE802.11,” inLecture Notes in Engineering and Computer Science: Proceedings of The World Congress on Engineering 2011, WCE 2011, 6-8 July, 2011, London, U.K., 2011, pp. 1710–1715.
[5] P. Mestre, L. Reigoto, A. Correia, J. Matias, and C. Serodio, “RSS and LEA adaptation for indoor location using fingerprinting,” inLecture Notes in Engineering and Computer Science: Proceedings of The World Congress on Engineering 2012, WCE 2012, 4-6 July, 2012, London, U.K., 2012, pp. 1334–133.
[6] R. Sep´ulveda, O. Montiel-Ross, J. C. Manzanarez, and E. E. Quiroz, “Fuzzy logic predictive algorithm for wireless-lan fast inter-cell hand-off,” vol. 20, pp. 109–115.
[7] J. Martin, J. Burbank, W. Kasch, and P. D. L. Mills, “Network Time Protocol Version 4: Protocol and Algorithms Specification,” RFC 5905, Jun. 2010. [Online]. Available: https://rfc-editor.org/rfc/rfc5905.txt [8] “Internet Control Message Protocol,” RFC 792, Sep. 1981. [Online].
Available: https://rfc-editor.org/rfc/rfc792.txt
[9] J. Dugan, J. Estabroo, J. Ferbuson, A. Gallatin, M. Gates, K. Gibbsa, S. Hemminger, N. Jones, F. Qin, G. Renker, A. Tirumala, and A. Warshavsky. iperf2. [Online]. Available: https://iperf.fr/
[10] X. Xiang, X. Wang, and X. Zhou, “An efficient geographic mul-ticast protocol for mobile ad hoc networks,” in 2006 International Symposium on a World of Wireless, Mobile and Multimedia Net-works(WoWMoM’06), 2006, pp. 8–82.