STUDIES IN THE SOLID STATE:
OPTICAL SPECTRA OF Irc162- AND Ptc162- COMPLEXES
A thesis presented for the degree of Doctor of Philosophy in Physics in the University of Canterbury,
Christchurch, New Zealand.
by
I.N. pouglas
c..
17.:.:,
. 0 7:3,4.
To the memory of my father
'Ah, but a man's reach should exceed his grasp, Or what's a heaven for?'
PREFACE
This investigation is concerned with the experimen tal observation and interpretation of the spectra of 4d and Sd transition-metal ion complexes. In particular, a detailed study has been made of the optical absorption
2-
2-spectra of the Irc16 and PtC16 complexes in cs2zrcl6,
2-Cs2HfC16 and K2SnC16, and of PdC16 in Cs2zrcl6• The
2-luminescence spectra of Ptc16 in several compounds was also investigated. As this luminescence had not been reported before, much time was spent trying to understand the nature of it, including a study of the temperature dependence of the band shape.
2-This is the first time the spectra of Irc16 and Ptc162- have been investigated at liquid helium temperature, and the results show an abundance of vibrational structure not seen at higher temperatures.
Calculations have been carried out and these showed that ligand field theory alone does not provide a satis factory explanation of the spectra. It was found
necessary to use a combination of ligand field theory and molecular orbital theory to explain the spectra observed.
In keeping with the best scientific tradition, the work for this thesis was sparked off by a mistake. While the optical absorption spectrum of K2PtC16 was being
host crystal in the study of interactions between iridium ions in K2rrc16, a spectral line from the neon room
lights appeared above the background which seem·ed at first to be an emission line. When the crystal was irradiated with ultraviolet light at low temperatures a bright red luminescence was observed. Because this could not be readily explained in terms of the absorption
2-spectrum of Ptcl6 , as then known, the low temperature absorption spectrum of Ptc162- was investigated,
resulting in the discovery of a very weak band. The original interest in Irc162- led naturally to a detailed study of its optical spectrum at liquid helium temperature.
I would like to thank the staff and research students of both the Physics and Chemistry Departments for many useful discussions. In particular I am very grateful to Professor B.G. Wybourne for his supervision and Dr G.D. Jones for his help and interest.
I would also like to thank Mr D. Greig for assist ing with the liquid helium runs; Mr R. Ritchie for
growing the crystals; Mr A. Smith of the Geology
Department for obtaining the X-ray data; and Mrs M. Sewell for typing this thesis.
Financial assistance has been received from the New Zealand University Grants Corranittee, and from the United States Air Force Office of Scientific Research under AFOSR Grant No. 1275-67. The Grants Committee also provided a Postgraduate Scholarship.
PREFACE
LIST OF FIGURES LIST OF TABLES ABSTRACT
Chapter 1. INTRODUCTION
1.1 Transition-Metal Ion Complexes 1. 2 Notation
1.3 Outline of the Project
Chapter 2. THEORY
2.1 Ligand Field Theory
2.2 The Ligand Field Parameters 2.3 Molecular Orbital Theory
t.4 Molecular Orbital Energy Levels for Octahedral Complexes
2.5 Comparison of the Ligand Field and Molecular Orbital Theories
2.6 Selection Rules and Intensities 2.7 Vibrations
iv
Page i vii ix xi
1 1 2 3
5 5 10 12
13
Chapter 3. THE LOW TEMPERATURE OBSERVATION OF SPECTRA 24
3.1 Introduction 24
3.2 The Photographic Spectrographs 25
3.3 The Cary Spectrophotometer 28
3.4 The 3.4 Metre Jarrell-Ash Ebert Spectrograph 33
3.5 Sample Holders 34
3.6 The Dewars 37
3.7 Light Sources 41
Chapter 4. THE GROWTH AND STRUCTURE OF CRYSTALS 43
4.1 The Choice of Crystals 43
4.2 Growth of Crystals 46
4.3 Crystal Structure 49
4.4 X-ray Determination of Cell Dimensions 52 Chapter 5. THE SPECTRUM OF THE HEXACHLOROIRIDATE
COMPLEX 5.1 Introduction
5.2 Energy Levels in Octahedral IrC16 2-5.3 Vibrational Modes
5.4 Experimental Results I: Cs2zrcl6/Ir 5.5 Experimental Results II: Cs2HfC16/Ir 5.6 Experimental Results III: K2sncl6/Ir
5.7 Experimental Results IV: Cs2ZrC16/cs2IrBr6 5.8 Conclusion
V
COMPLEXES OF PLATINUM AND PALLADIUM 6.1 Introduction
2-6.2 Energy Levels in Octahedral PtC16 6.3 Vibrational Modes
6.4 Experimental Results I
6.5 Experimental Results II: cs2zrcl6/Pt 6.6 Experimental Results III: cs2HfC16/Pt 6.7 Excitation Absorption Spectrum
2-6.8 The Spectrum of PdC16 6. 9 Conclusion
Chapter 7. LUMINESCENCE IN OCTAHEDRAL PLATINUM COMPLEXES
7.1 Luminescence
7.2 Luminescence in Octahedral Complexes 7.3 Temperature Dependence
7.4 Discussion
Chapter 8. CONCLUSION
REFERENCES
APPENDIX: Published Papers
Figure 1. 2. 3. 4. 5. 6. 7. 8. 9.
LIST OF FIGURES
Energy level diagram for an MX6 complex Optical arrangement used for luminescence Plate response of the photographic plates Cary optics
Sample holder
Glass helium dewar Andonian dewar
Structure of K2PtC16 2-Energy Levels in IrC16
10. Optical spectrum of cs2zrcl6/Ir at helium temperature
The detailed spectrum of Cs2zrcl6/Ir in region The detailed spectrum of Cs2zrcl6/Ir in region The detailed spectrum of Cs2zrcl6/Ir in region The detailed spectrum of K2SnC16/Ir in region
A B C B 11. 12. 13. 14.
15. Optical spectrum of Cs2zrcl6/cs2IrBr6 at helium temperature
16. The detailed spectrum of cs2zrcl6/cs2IrBr6 in region A
K2PtC16 in water
19. Absorption spectrum of cs2zrcl6/Pt at helium temperature
20. The detailed spectrum of Cs2zrcl6/Pt in region A 21. The detailed spectrum of Cs2ZrC16/Pt in regions
.B and C
22. The low intensity and low energy optical spectrum of Cs2zrcl6/Pd
23. The high intensity and high energy spectrum of Cs2ZrC16/Pd
24. Schematic configuration coordinate curves 25. Red luminescent band in cs2HfC16/Pt at helium
temperature
26. Green luminescent band in cs2HfC16/Pt at helium temperature
27. Temperature dependence of the half-height
100
101 102
107
113
114 121
125
128
width of the red luminescent band in K2PtC16 131
LIST OF TABLES
Table Page
I Direct Products of the irreducible representations of the double group
Oh
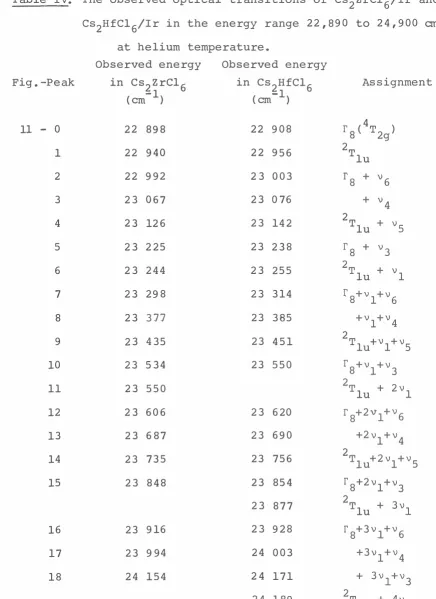
II Cary calibration using a mercury lamp III Crystal cell dimensions20 32 52 IV The observed optical transitions of cs2zrcl6/Ir
and cs2HfC16/Ir in the energy range 22,890 to -1
24, 900 cm at helium temperature 64 V The observed optical transitions of cs2zrcl6/Ir
and cs2HfC16/Ir in the energy range 20,800 to -1
22, 900 cm at helium temperature 69 VI The observed optical transitions of cs2zrcl6/Ir
and cs2HfC16/Ir in the energy range 19, 200 to
20, 400 cm-l at helium temperature 74 VII The observed optical transitions of cs2zrcl6/Ir
and cs2HfC16/Ir in the energy range 17,790 to -1
18, 980 cm at helium temperature
VIII The observed optical transitions of K2sncl6/Ir at helium temperature
IX The observed optical transitions of
7(
78
cs2zrcl6/cs2IrBr6 in the energy range 22,000 to -1
24, 300 cm at helium temperature 86
-1
Cs2zrcl6/cs2IrBr6 below 22,000 cm at helium
temperature 89
XI The observed optical transitions of cs2zrcl6/Pt and cs2HfC16/Pt in the energy range 22,900 to
-1
30,000 cm at helium temperature 103 XII The observed optical transitions of cs2zrel6/Pt
and cs2HfC16/Pt in the energy range 20,500 to -1
22,900 cm at helium temperature 106 XIII The observed optical transitions of Cs2zrcl6/Pt
and Cs2HfC16/Pt in the energy range 17,500 to
20,400 cm-l at helium temperature 108 XIV The observed optical transitions of cs2zrcl6/Pd
at helium temperature
xv
Red luminescent bandsXVI The energy levels observed in the green
luminescent bands of Cs2zrcl6/Pt and cs2HfC16/Pt at helium temperature
X
115 124
ABSTRACT
The optical absorption spectra of the complexes
2-
2-IrC16 and Ptc16 in single crystals of cs2zrcl6,
2-Cs2HfCl6 and K2sncl6, and PdC16 in cs2zrc16 have been studied at liquid helium temperature. Both molecular orbital theory and ligand field theory are used to interpret the results. The rich vibrational structure observed in many of the bands is analysed in terms of the vibrational modes of the complexes. Several long progressions involving up to twelve quanta of the totally symmetric vibration, ylg' were observed throughout the spectra, indicating that the transitions are to states in which the bond length has changed.
Luminescent bands due to transitions from the triplet states of the 5d6 configuration of Pt4+ in crystals of the type K2PtC16 have been found in the red and green regions of the spectrum. A study of the temperature dependence of the band width of the red luminescence in K2PtC16 powder has been made and fitted to a coth function. At liquid helium temperature both bands showed
vibrational progressions, involving several quanta of the totally symmetric vibration.
C H A P T E R 1
INTRODUCTION
1-1 TRANSITION�METAL ION COMPLEXES
It is well known that many solids containing transition-metal ions are found to absorb light in the
visible and near-visible regions of the electromagnetic spectrum. These absorptions which cause the bright colourings evident in such salts, are due mainly to transitions between electronic energy levels arising from the partly filled d shells characteristic of the transition-metal ions. The energies of these d electrons are modified by the surrounding ligands, whose orbitals can mix with the d orbitals. The group of ions consis ting of the transition-metal ion and the surrounding ligands is term·ed a complex. The energy levels in com plexes consisting of a central platinum or iridium ion surrounded by an octahedron of six chlorine ions are the subject of investigation in this thesis.
Transitions between energy levels in complexes can be of four basic types:
2. excitation within the ligands
3. electron-transfer from the ligands to the metal ion 4. electron-transfer from the metal ion to the ligands.
In the hexachloro complexes considered here only the first and third types of transitions are likely to occur.
Several excellent review articles and books on
1-7 4
absorption spectra have been written • Ballhausen 2
includes a comprehensive survey and bibliography of work carried out on the transition-metal ions prior to 1962. M ore recent artic es y Ferguson an Jorgensen · 1 b · 6 d 7d 1 ea with the spectra of the 3d transition-metal ions and electron-transfer spectra respectively.
1-2 NOTATION
A certain amount of confusion often arises in the discussion of spectra because of the different notations used to label the states. Throughout this thesis an effort has been made to keep the notation consistent with that most commonly used to describe the spectra of ions in strong crystal fields, where the levels are
labelled according to the irreducible representations of the appropriate symmetry group.
octahedral group Oh. The representations A1, A2, E, T1 and T2 in Mulliken's notation correspond to
r
1,r
2,r
3,r
4 andr
5 in Bethe's notation. Each of these representations can have odd or even parity denoted by a subscript u(ungerade) or g (gerade). If a system has an odd number of electrons the additional irreducible representations
r
6,r
7 andr
8 of the double groupo;
are required to label the spin-orbit states. Mulliken did not use these,butGriffith labels them E', E" and U'.
Where the spin S of a state can be specified this is given by a superscript 2S + 1, the spin multiplicity, before the irreducible representation.
Upper case letters are used to describe the state of a complete system, as well as the irreducible
representations of the symmetry group, while the lower case letters are used for the representations of the individual orbitals an electron can fill, whether the orbital is occupied or not. Lower case Greek letters are also used for the representations of the fundamental vibrational modes.
1-3 OUTLINE OF THE PROJECT
No previous work has been published on the details of the vibrational structure of the spectra of the
8
In this Department Schroeder has measured the solution and reflection spectra of several of the hexachloro com plexes of the 4d and Sd transition-metal ions at room temperature and liquid nitrogen temperature. In the present work a detailed study is made of the spectra of the hexachloroiridate (Irc162-} and the hexachloro platinate (Ptc162-} complexes at liquid helium temper ature.
4
The discussion in Chapter 2 provides a background to the theory used in the interpretation of the spectra. The experimental methods used to observe the spectra and the methods of growing the crystals are described in Chapters 3 and 4. Chapters 5, 6 and 7 contain the
experimental results of the absorption and luminescence spectra, and show how a knowledge of the vibrational
frequencies can be used to help assign the spectra. From these results it is apparent that the interpretation of these spectra is more complex than originally thought. In the conclusion several ways of extending this study are discussed.
In the course of this project, several efforts
C H A P T E R 2
THEORY
This chapter provides the background of the theory used to interpret the spectra. A detailed treatment and evaluation of the theory is beyond the scope of this present work, but a fuller treatment and discussion can be found in the literature cited1-5•
A brief outline of ligand field theory is followed by a survey of the molecular orbital theory required for the interpretation of the spectra of the Sd transition-metal ion complexes. The general problem of selection rules and intensities is discussed, and,
finally, the important effect of vibrations is considered.
2-1 LIGAND FIELD THEORY
It is only during the last decade that the term ligand field theory has come into common usage. The
interpretation of spectra was first carried out using the original electrostatic crystal field theory based on the
9 10-12 .
work of Bethe and Van Vleck • During the 1950's this received considerable refinement and modification
13-15 16-18
6
ligand field theory is to some extent a hybridization of the electrostatic model and the molecular orbital model developed by Mulliken19-22 to enable electron-transfer spectra and chemical bonding to be discussed.
Much of the confusion which has arisen over the difference between crystal field theory and ligand field theory is due to the fact that a lot of the formal cal culations in the two theories are very similar. The important assumption which distinguishes ligand field theory from crystal field theory, is, that although the wavefunctions of the partly filled electronic shells
associated with the central ion span the same irreducible representations of the symmetry group (determined by the location of the ligands) as the free ion d orbitals, they are not necessarily the same. This means that the
orbitals used can include linear combinations of the ligand orbitals. This is in contrast to the older
crystal field theory in which the partly filled shells were assumed to be composed of pure d orbitals. The hyperfine
2-structure observed in the e. s. r. spectrum of Irc16 , inexplicable using the crystal field model, can be
explained by considering the effect of the nuclear spin of the chlorine on the ligand orbitals which mix with those
f th t 1 . . d. . 23, 24
and ligand orbitals also provides the mechanism for
25-28 exchange interaction between neighbouring complexes
The energy levels of a complex ion can be calcul ated by a method analogous to that used for a free ion. The chief difference between the two cases is that the free ion possesses spherical symmetry, while in a complex ion the electrons move in the potential field of the
ligands which has a lower symmetry.
In discussing the effect of the ligand field on the energy levels of an ion it is usual to divide the field into two parts (i) the octahedral or tetrahedral field, which is the larger and can have a major influence on the energy levels, and (ii) any non-cubic field,
generally small or zero, which can be treated as a perturbation on the system after other effects such as the electrostatic interaction and the spin-orbit coupling have been considered. Since all the complexes investig ated here are essentially octahedral, only ions with octahedral symmetry will be considered.
If the vibrational effects are neglected, the Hamiltonian for a many-electron ion in a complex may be written2 9
H = H 0
+
n = Ei=l
H e
+
1 2m E.i
H so
2
+
+
V C 2 E e i<j r .. l. J+
n E r,; R, •• s. . -l. -l. 1.=l( 1)
where the summation is over the n electrons outside the closed shell of the central ion, and the ligand field term, V , represents an interaction with all the nuclei C
8
(including that of the central ion) and all the electrons of the filled shells. Since H0 has the full synunetry of the group, it is combined with V to give the ligand C field operator V = H0 + Ve, so that the Hamiltonian (1) can now be written
(3)
The relative importance of these terms is taken into account when carrying out energy calculations, and for the transition-metal ions this leads to two different ways of labelling the states:
(a) The weak field scheme-:- the ligand field interaction is weaker than the electrostatic interaction and is
treated as a perturbation on the free ion eigenstates. The free ion spectroscopic notation is used to label the states. Many of the complexes of the 3d transition series belong to this scheme, which will not be discussed any further.
perturbations of the strong field terms. All the complexes investigated belong to this group.
The strong field configurations take the form
where r is an ir�educible representation of the appropriate symmetry group and the ak, corresponding to the principal quantum numbers of free ion theory, are used to distinguish between orbitals with the same r.
As in the free ion theory it is convenient to simplify the calculations by considering only the partly filled shells (although the possibility of configuration interaction should be kept in mind). Hence for the
transition-metal ions only the d electrons are considered. In an octahedral crystal field the d orbitals are separated into two sets which transform as the eg and t2g representations of the symmetry group Oh with energies + 5".:':I and
-is written
�.:':I respectively. The strong field configuration m n
t2 e . When the electrostatic energy is g g diagonalised each configuration breaks up into a set of strong field terms labelled 2s+lr where S is the total spin and
r
is an irreducible representation of oh. When spin-orbit coupling is included, each term breaks up into a number of strong field levels which are labelled by10
of
The termsAt�g and e; which are allowed by the 9 Pauli exclusion principle have been determined by Bethe . The terms of the configuration tm2 en, obtained by
com-g com-g
bining the terms of t�g and e;, are given by Griffith29•
2-2 THE LIGAND FIELD PARAMETERS
The theoretical calculation of the energy levels using the Hamiltonian (2) is an extremely complex
mathematical problem requiring a knowledge of the exact wavefunctions. Hence a semi-empirical approach is
employed, in which group theory is utilized to determine the symmetry properties of the operators and wave
functions, but the radial parts must be incorporated in a number of parameters to be determined experimentally. Thirteen parameters are needed to calculate the matrix
1 b f th m n f . . 3 0 , 31
e ements etween states o e t e co2g g n iguration , but since it is not usually possible to interpret spectra unambiguously using so many parameters it is common to reduce this number by making further assumptions.
Crystal field theory assumes that the t2g and eg orbitals are obtained purely from the splitting of the d orbitals by the octahedral field. Then the energy levels
32, 33 depend on the four free ion parameters A, B, C and�
the crystal field. For a given dn configuration A can be neglected as it shifts all the energy levels equally.
Ligand field theory does not assume that the t2g
and eg orbitals are necessarily derivable from the d
orbitals. Instead, it is assumed that the five
parameters A, B, C, s and� have the same relationship
to the thirteen parameters as before, but that there is no necessity for them to be simply related to the free
ion values.
The electrostatic and cubic field matrices for the
strong field coupling scheme have been calculated for
all dn con f' igura ions y Tat' b n ab e an d S ugano , w i e 13 h'l Schroeder8134 has calculated the corresponding spin orbit coupling matrices using the same wavefunctions. Other authors29 have also calculated the matrix elements but these are inconsistent with those above because they have chosen a different phase for their wavefunctions.
Values of the parameters were chosen and the energy levels calculated. The parameters were then varied to give the best fit to the experimental data. The calculations were carried out on the University of Canterbury's IBM 360/44 computer using a matrix
diagonalization programme which has been developed over a number of years by various postgraduate students. A listing of the version of this programme which was used,
35
which sorts the eigenvalues into ascending order and prints them out.
2-3 MOLECULAR ORBITAL THEORY
12
Molecular orbital theory is widely used to inter pret the spectra of molecules and complex ions which have covalent bonding where the electrons cannot be con
sidered to be associated with one particular atom, but rather belong to the complex as a whole. Hence the molecular orbitals have, in general, a wider spatial distribution than atomic orbitals, and they are poly centric.
The theory of molecular orbitals was first
developed by Mulliken19-22 and Van VlecklO,ll,36, who used it to discuss valency and magnetism in complex salts. Since the general theory is adequately reviewed
. 37-39
in the literature only the theory for octahedral complexes will be considered here.
It is usual to take the molecular orbitals to be linear combinations of atomic orbitals (LCAO-MO) of the constituent atoms. The ith molecular orbital is
�- =
1Before the energy levels of the molecules can be calculated it is necessary to obtain values for the polycentric integ�als
(a) the overlap integral S = f�.$.dT 1 J
(b) the resonance integral
which is the off-diagonal matrix element of the Hamil tonian. By using the symmetry properties of the
molecule many of the resonance integrals can be shown to be zero when$, and$. do not belong to the same 1 J
irreducible representation.
For simple molecules it has been possible, by
making suitable approximations, to carry out calculations of the energy levels which agree reasonably well with the observed spectra, but with complex molecules of the
heavier atoms the approximations become less exact, the calculations complicated and tedious, and it is doubtful if much meaning can be placed on the results.
2-4 MOLECULAR ORBITAL ENERGY LEVELS FOR OCTAHEDRAL COMPLEXES
For a complete description of the molecular
14
field theory, it is found that the lower lying filled shells can often be ignored. In the construction of LCAO-MO's the following points enable further simplifi cations to be made:
1. The energies of the orbitals to be combined must not differ by too much, otherwise there is little inter action between them.
2. The internuclear separation must have the right
relationship to the radial distribution functions to promote effective overlap.
3. The combining atomic orbitals must have the same
symmetry with respect to the molecular framework, and the molecular orbital formed will also have this same symmetry. This enables the atomic orbitals to be considered in independent groups, reducing the labour considerably.
The first step in forming a set of molecular orbitals is to choose a suitable set of ammicorbitals. One such set for the hexachloro complexes of the platinum group ions is the 5d, 6s and 6p orbitals from the central ion and the 3p orbitals from each of the six surrounding
chlorines. Folloving Schonland39 linear combinations of
always transformed into itself while the ligands can be interchanged, the orbitals can be considered in two groups.
Of the central ion orbitals the s orbital is totally symmetrical and forms the basis for an Alg
representation, the p orbitals transform as T1u,and the d orbitals as T2g + Eg.
The p orbitals can be further divided into those directed towards the central ion, the p orbitals, and cr those at right angles, the p orbitals. The p orbitals rr cr transform as Alg +
transform as Tlg + Combinations
E g + Tl , u T2g + Tlu
while the Prr + T2u·
of the atomic orbitals
orbitals
which transform according to these representations are given by Schonland. Since orbitals having the same representations can
combine, molecular orbitals of the following kinds can be formed:
a1g- Two non-degenerate levels with molecular orbitals formed from combinations of the central ion s and ligand cr atomic orbitals.
t1u - Three triply degenerate levels with molecular orbitals formed from combinations of the central ion p and ligand cr and rr atomic orbitals.
t - Two triply degenerate levels with molecular 2g orbitals formed from central ion d and ligand -,r atomic orbitals
16
t1g and t2u- One triply degenerate level of each type with molecular orbitals that depend on the ligand
TT atomic orbitals only.
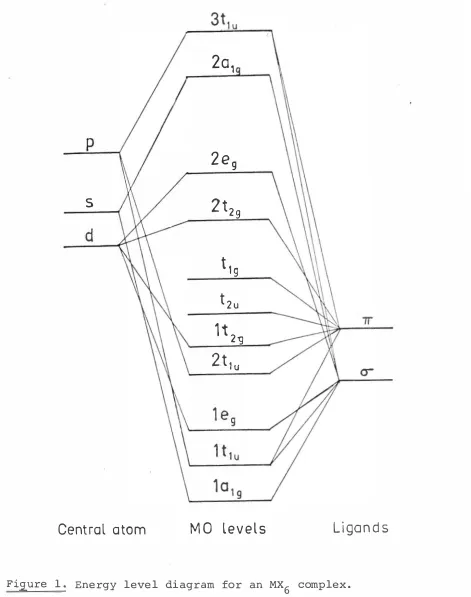
The order of these levels is obtained from the combination of qualitative arguments and empirical investigation of spectra, and an energy level diagram can be obtained (Figure 1) . However, not all the authors agree on the order, particularly of the tlg' t2u, lt2g and 2t1u levels, which are important in the electron transfer spectra. The electrons will fill these orbitals from the bottom up, in accordance with the Pauli exclusion principle.
The chief features of the diagram are:
(a) A set of low-lying strongly a-bonding levels lalg' ltlu' leg which can hold twelve electrons altogether. (b) A set of levels whose molecular orbitals consist
mainly or entirely of combinations of the ligand TT orbitals; the bonding 2t1u and lt2g and the non
bonding t2u and t1g levels which can hold twenty-four electrons.
2a,
2e
9s
2t29t,g
t2u
1t 2�
2t1
uCentral atom
MO levels
Ligands
[image:30.567.48.520.57.655.2]18
admixture of anti-bonding n and cr ligand orbitals. (d) The strongly anti-bonding 2a1g and 3t1u levels.
The actual energy states in a complex are obtained by filling up these molecular
2-number of electrons. Irc16
orbitals with the appropriate
2-and Ptc16 have 41 2-and 42 electrons respectively to fill these orbitals. In the ground state the levels in (a) and (b) will be full, and the remaining 5 or 6 electrons will go into the 2t2g level and the picture is the same as that obtained from ligand field theory. However, in the excited states the possibility of an electron moving from one of the
predominantly ligand orbitals (b) to a d orbital (c) is present, as well as transitions between the 2t2g and 2e levels. g
2-5 COMPARISON OF THE LIGAND FIELD AND MOLECULAR ORBITAL THEORIES
allow for the possibility of electron-transfer transit ions.
Molecular orbital theory, on the other hand, emphasises the interaction between the ligand and the central ion orbitals, which depends very strongly on the amount of overlap and the interionic separation. To evaluate the overlap integrals precise wavefunctions are required. Particularly for the 4d and Sd transition ions the calculations are lengthy and tedious, even when
approximations are made.
2-6 SELECTION RULES AND INTENSITIES
The intensity of a transition depends on the matrix element <ilKlj> where K is an operator which induces the transition between the eigenstates Ii> and lj>. Group theory enables us to predict that some of these elements will be zero40• If Ii> and lj> belong to the irreducible representations r. and r. of the symmetry l. J group (Oh for octahedral complexes) , and if K transforms as rK, then the matrix element <itKlj> will be zero
unless the direct product rf x rK x rj contains the
f1 f2 f3 f4 f5 r6 f7 ra
f2 f1 f3 f5 f4 f7 r6 rs
f3 f3 r1+r2+r3 f4+f5 r4+f5 rs rs r6+r7+rs
f4 f5 f4+f5 r1+r3+r4+r5 f2+f3+f4+r5 r6+rs frHs r6+r7+2r8
rs f4 r4+r5 r2+r3+r4+r5 r1+r3+r4+rs f7+rs r6+rs r6+r 7+2 r 8
r6 f7 rs r6+rs r7+rs f1+f4 f2+f5 f3+f4+f5
f7 r6 rs r1+rs r6+rs f2+f5 r1+r4 r3+f4+f5
r s rs r6+r7+r8 r6+r7+2r8 r6+r7+2r8 f3+f4+f5 f3+r4+f5 r1+r2+r3+2r4+2r5
g X g = g, g X U = U, U X g = U1 U X U = g
Table I, Direct products of the irreducible representations of the double group
Oh
Electric dipole transitions are the most important for the absorption of light by complex ions. They are about 106 times more intense than magnetic dipole
transitions. The electric dipole operator transforms as Tlu in octahedral symmetry and so, since all the ligand field states have even parity, electric dipole transit ions are all forbidden. These transitions, however, are observed experimentally because odd vibrations and odd components of the ligand field enable some odd states to mix with the even ligand field states. Because these perturbations are generally small the observed
transitions will be weak.
The spin selection rule, � S = O, is broken down by spin-orbit coupling which is particularly strong in the Sd transition-metal ions.
Approximate selection rules can be obtained by ignoring the parity of the states, and these can be used as a guide to predict the most likely transitions.
The intensities of optical absorption spectra of octahedral complexes have been discussed by a number of authors41-47• Jordan et al. 47 have carried out calcul
of os4+ and Re4+ in crystals of cs2zrcl6•
22
4+
For Ir they predict that the strongest transitions will be to the
r
8g and r Gg states.2-7 VIBRATIONS
Vibronic interaction between the electronic states and the vibrational modes of the complex is very important in the interpretation of the spectra of complex ions,
particularly when the electronic transition is forbidden.
The crystals used all have the face-centred
anti-48 49
fluorite structure of the K2Ptcl6 type, Fm3m • Pollack has shown that the vibrations of crystals of this type consist of the following fundamental modes:
(1) r4u, an acoustical lattice mode,
(2)
r
4u<v7), Ysg' due to the vibrations of the cation relative to the Mx62- complex,(3) Y1g<v1)' Y3g(v2)' Y4u<v3)' Y4u(v4)' Y5g(v5)' r5u(v6), due to the internal vibrations of the
2-MX6 complex.
Satten50 has shown that if an odd vibrational mode
is coupled to an electronic eigenstate the only forbidden transitions are
This means that by considering the effect of vibrations we pass from having all the transitions forbidden to having very few forbidden.
C H A P T E R 3
THE LOW TEMPERATURE OBSERVATION OF SPECTRA
3-1 INTRODUCTION
24
The measurement of spectra at low temperatures requires some means of keeping the sample at the required temperature for the complete time it takes to record the spectrum. Suitable spectrometers and recording equipment are needed to observe the spectra. This chapter describes the means by which the spectra were obtained.
The Physics Department, in recent years, has been acquiring equipment to enable spectra to be observed over the widest possible spectral range and at various temperatures. It is now possible to measure spectra in the microwave, infrared, visible and ultraviolet
regions of the spectrum at any temperature down to liquid helium temperature. There is also an X-ray machine to assist in the determination of crystal structures, and a Raman spectrometer using an argon gas laser is at present being installed. It is hoped that the scope of the work possible will be extended by the addition of a Zeeman
Not all of these facilities were available while this project was being undertaken, which meant that some lines of investigation could not be pursued.
Most of the luminescence spectra were recorded photographically on two Hilger prism spectrographs. A simple quartz-tipped glass dewar was used for measurements at liquid nitrogen temperature (77°K) , while a glass
0 helium dewar was used at liquid helium temperature (4.2 K)
(section 3-6) . The temperature dependence of the PtC16 2-luminescence was investigated on the 3. 4m Jarrell-Ash
using the Andonian dewar, but, because of the high dispersion and the rapid falling off of the photomulti plier's sensitivity in the red, the signal was weak and noisy.
The absorption spectra were all taken on the Cary 14R spectrophotometer using one of the conduction dewars described in section 3-6.
3-2 THE PHOTOGRAPHIC SPECTROGRAPHS
Because a photographic plate can integrate weak signals over a long period of time it is well suited for recording the weak luminescence spectra. Two Hilger prism spectrographs were used. The Hilger Medium Quartz
26
length). At 7000A the dispersion of the Medium was 0
160A/mm, while that of the Large using the glass prism 0
was 25A/mm. A typical slit width used, 100µ, gives a
1 . 60 . o
reso ution of 1 A on the Medium and 2. 5A on the Large at 0
7000A. This is more than sufficient for observing the broad luminescence bands. The Medium had an internal
wavelength calibration scale which made it very convenient to use, while an iron arc was used to calibrate the
Large.
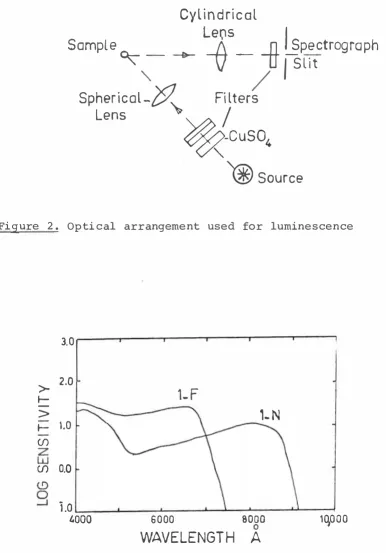
The optical arrangement used most with both
instruments is shown in Figure 2. Light from the source, S, (one of the mercury lamps described in section 3-7) was passed through a combination of filters which let through only the ultraviolet radiation. This was
focussed by a sphericalquartz lens onto the sample mounted in an immersion dewar. Light from the sample was then focussed by a cylindrical lens onto the slit of the spectrograph.
No single filter could be found which transmitted only the ultraviolet from the mercury lamp. A Corning 2-54 filter was the best, but it also transmitted in the
0
Cyl i n d ri c al
Ler,1s
f
Sampl e
0:-- _Ji _
_n _§pectrogra ph
."
'
---e- V7J /
S l i t
/
Spherical -29"
Fi lters
Lens
/
�-CuS0
4'®
source
Figure 2. Optical arrangement used for luminescence
3.0
2.0
>-
1 ... F
t--
>
1- N
t- l.O
(/)
(/) 0.0
1 .0
4000 6000 8000
1qooo
WAVELENGTH
A
[image:40.567.69.455.66.619.2]28
was also placed in front of the lamp to reduce the boil off of the liquid nitrogen or helium. When using the Medium an OY3 filter was placed in front of the slit to
eliminate the ultraviolet radiation reflected from the sample and the mounting. This was not necessary on the Large where the higher dispersion ensured that the ultra violet did not fall on the photographic plate.
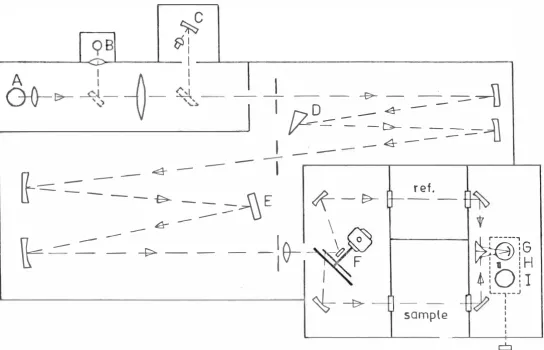
The two photographic plates most commonly used were the Kodak 1-N and the Kodak 1-F plates. These both have very high speed and fairly high contrast. The 1-F has the better sensitivity in the green, but its sensitivity
0
drops rapidly above 69 00A { Figure 3) , while the 1-N is 0
sensitive out to almost 9000A. Consequently the 1-F was used for the green luminescence and the 1-N for the red. The Kodak II-L plate has a smoother response but was not used because it is several times slower than the other t�.
The plates were measured on a Joyce recording microdensitometer and examples of the spectra obtained can be seen in Figures 25 and 26.
3-3 THE CARY SPECTROPHOTOMETER
instrument, designed for the rapid recording of solution spectra, required only slight modification to enable the spectra of crystals at low temperatures to be recorded. The crystals were mounted in one of the conduction dewars described in section 3-6.
The optical system of the Cary is shown in Figure 4. Dispersion is produced by a double monochromator
consisting of a 30° fused silica prism ( D) in series with a 600 lines/mm echelette grating (E) . This combination enables advantage to be taken of the high resolving power of the grating at long wavelengths with the high optical efficiency and lower scattered light characteristic of the prism.
Four different combinations of light s ource and 0 detector enable the spectrum to be scanned from 2000A to 2.6 microns. A deuterium lamp ( A) and a 1P28
photo-. 0
multiplier (G) are used in the ultraviolet from 2000A to 3S ooi. A quartz-iodine lamp (B) is used in conjunction
0 0
--
'
I o - � - -
- - � - -
·
�
�
fl=-.::::- -=- - � -�
:-=--{\
, _ _ _ 4
--
- ,
�
-�
=
:=- � �- �
- � _:::c-�E
e-
-� - _:::: ==- _.,. - - -
-:e-Figure 4. Cary optics
� - �
\
�
0
F
I
�
-l;;,-r ef.
--
-sample
1'
�iG
11 ' H Ii ! Q l 1
I�--,---'
II
I I
I
CJ
w
[image:43.699.64.609.62.412.2]lamp (I) is used with the lead sulphide cell (C) . In this second infrared range the optical path is reversed and the light passes through the sample and the chopper before being dispersed . Thus only a very small fraction of the radiation from the chopper is detected. Controls on the front of the instrument enable rapid interchange between the ranges to be made.
The need to calibrate the instrument ' s response to the various light sources is eliminated by dividing the light emerging from the monochromator into two by a beam splitter (F) . The beam passing through the sample is compared with that passing through the empty reference cell and the difference is amplified and recorded on a chart. A marker pen on the chart recorder marks every
The speed of the scan could be varied from o . si;sec.
0
to 50 0A/sec., but the higher speeds were never used while recording . The spectra recorded were linear in wave length. The wavelength counter was checked by replacing the quartz-iodine lamp with a small mercury lamp. In the visible region it was found that the counter reading was
Table II. Cary Calibration Using a Mercury Lamp
Counter Reading Wavelength of Correction required
0
(to 0. 25A) Hg line (i)
5799.0 5791 8
5777. 5 5770 7. 5
546 8. 5 546 1 7. 5
4366. 5 4358 8. 5
4055. 25 4047 8. 25
3672.75 366 3 9.75
The resolution in Angstroms is given by
R
=
W. D + C + Lwhere
w
=
monochromator slit width (mm) 0=
reciprocal dispersion (A/rran) C=
slit curvature mismatch (i) L=
Rayleigh diffraction limit (i)32
The slit width is automatically controlled so that the same amount of energy from the reference beam falls on the detector all the time. For the best crystals used (less than 1 mm thick and about 1% concentration of the dopant) a typical slit width used was 0.02 mm which
O O l
recording the spectra of more heavily absorbing crystals it was necessary to attenuate the mergy of the reference beam using a fine gauze screen . This attenuation was kept to a minimum to avoid loss of resolution .
3-4 THE 3. 4 METRE JARRELL-ASH EBERT SPECTROGRAPH
This is a high dispersion grating instrument which is most useful for the study of narrow emission lines . The sample and light source are external to the instrument giving a greater versatility in the optical arrangement used to observe the luminescence . However, an intensity calibration of the wavelength response for the system used
(spectrograph, detector, and any filters used) must be made. This was done by placing a standard quartz-iodine lamp,. whose intensity has been calibrated, in the
position of the sample and measuring the response of the system over the spectral range of interest . The
observed spectra can then be corrected .
A study of the temperature dependence of the Ptc16 luminescence was carried out using the Andonian variable temperature helium dewar . Because the luminescence band is very broad the high resolution of the instrument was not necessary and the slits could be opened up to 100µ to compensate for the weak signal and the low light
gathering power (f/35) .
2-34
A grating with 7500 grooves/inch gave a dispersion of 1oi/mm in the first order. With 100 µ slits this gave
0
a spectral slit width of lA which is much narrower than any structure observed on the photographic plates.
The wavelength calibration of the spectrograph was checked using a Philips Potassium Spectral Lamp and the spectra corrected.
The signal was detected by a red-sensitive EMI 9558 photomultiplier, amplified by an electrometer amplifier, and recorded on charts.
The optical arrangement used was similar to that used with the Hilgers (Figure 2). The black mercury lamp was used as the exciting source. A Corning 2-54 filter and a heat filter, ON22, were used in front of
the sample. An OY3 or OY8 filter was used in front of the slit to prevent any higher order mercury lines being
detected. Copper sulphate solution was not used initially, which meant that the red band from the mercury lamp,
centred at 7300R, could pass through the system, but this could be prevented from reaching the slit by positioning the lamp slightly above the rest of the optical system.
3-5 SAMPLE HOLDERS
For the nitrogen immersion dewar this was done by mounting the crystal on a computer card with some black plasticine. The pressure of the card on the walls of the dewar held it firmly in place.
The sample holder in the helium immersion dewar consisted of a thin stainless steel rod with a small loop of wire at the bottom to which the crystal was attached with plasticine. The top of the rod passed into black wax in a glass rod which passed out of the dewar through an 0-ring seal.
The powders used for luminescence in the immersion dewars were sealed off in fine capillary tubing. For the nitrogen dewar sufficient tubing was left to enable the sample to be held in place by a wad of cotton wool at the top of the dewar , while in the helium dewar the capsule was taped to the steel rod .
The sample holders for the conduction dewars had to be designed to provide good thermal contact between the sample and the dewar. One of the sample holders , made from high purity copper , is shown in Figure 5 .
0
Cla mp and Shi eld
-r--t-t- Apert ure
Fro nt View
S i d e V i ew
Figure 5 . Sample holder
of the hole depended on the crystal ' s size but it was usually 5 mm in diameter. Because the crystals were poor conductors they were kept as thin as possible so that the temperature difference between the crystal faces was not too great. The powders used in the temperature dependence study of the luminescence were pressed into a recess in one of the sample holders and held in place by a quartz plate clamped to the holder.
3-6 THE DEWARS
In order to measure the spectra at. low temperatures several dewars were used. These are basically of two different types : the direct immersion dewar and the conduction dewar.
In a direct immersion dewar the sample is complete ly immersed and so is held at the temperature of the
coolant. A simple glass dewar with a quartz tip, used at liquid nitrogen temperature, has the vacuum space
permanently sealed off and does not required to be pumped down between runs.
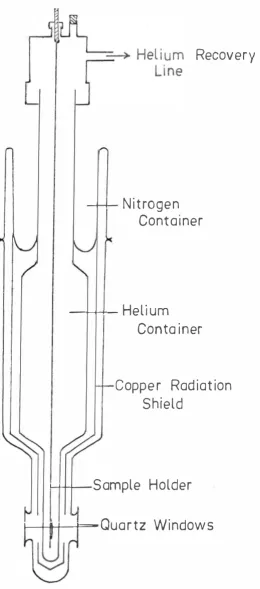
The glass helium dewar with quartz windows (Figure 6) could be used with either liquid nitrogen or liquid helium. By pumping on the liquid helium the temperature could be reduced to below 4. 2°K. The lowest temperature
Recovery
--1--4-
Nitrogen
Container
---- He li um
Conta iner
Coppe r Radiation
Shield
L-...-4--1----Sample Holder
l--�--4===-
Quartz Wind ow s
Figure 6 . Glass helium dewar
[image:51.567.179.439.44.632.2]did not make any noticeable difference to the spectra, no extensive studies were made at this temperature. The dewar held one litre of liquid helium which lasted up to four and a half hours.
The immersion dewars were ideally suited for use with photographic plates as they kept the sample at a constant temperature over a long period of time. As the photographic plate integrates the signal over the time of the exposure, the bubbling of the coolant has no effect on the spectrum. However, for direct photoelectric
recording, in which the spectrum is scanned, the bubbles produce noise in the signal and so it is necessary to use the conduction dewars.
There are several conduction dewars in the Department. A Hoffman helium dewar and a similar one constructed in the Department ' s workshop were used to obtain many of the absorption spectra. A variable
temperature dewar, made by Andonian Associates, was used for the temperature dependence study of the luminescence and also for absorption spectra when the other fixed temperature dewars were not available.
I I I I
' 1
I I I I
40
,_Outer Nitrogen
__._...,...
-Con
Inner Heli um
---4-+---+-t-
Can
Exchang� Space
Vacuum Jacket
>c-,_Radiat ion Shield
J
l,.... ,_..J,.
��
'""'
;ti
i
Heater
_.S ample Holder
.i--...
C r y sta l-�-...J:�
......,,,.Quartz Windows
IL--t:f=t---11
I LJ 'n:
1::i:===-Detachab le
Rad iation Shields
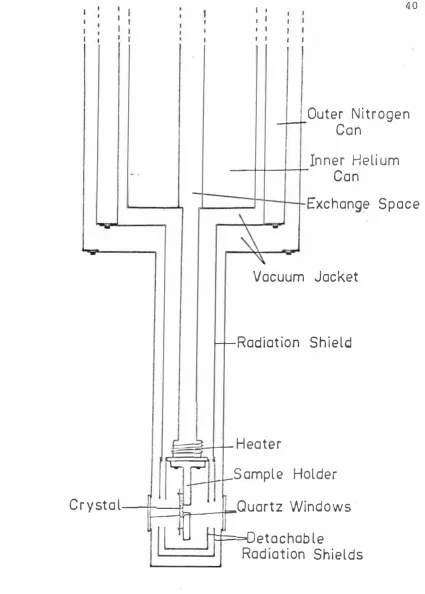
[image:53.567.69.494.34.628.2]liquid helium. The exchange space, previously evacuated is pressurized to just above one atmosphere with helium gas, when some of it will liquify and the crystal will be cooled by conduction through the copper block to 10°K. For operation at higher temperatures the heater and the pressure of the helium in the exchange space are controlled to give the required temperature, which is measured by a copper-constantan thermocouple mounted j ust above the crystal. For use at nitrogen temperature and above,
liquid nitrogen is used in the inner can and nitrogen gas in the exchange space.
The other fixed temperature dewars consist of a nitrogen can and an inner helium can which extends down to the copper block on which the crystal is mounted. These could be used at either liquid nitrogen or liquid helium temperatures.
3-7 LIGHT SOURCES
Two light sources were used to excite the
4 2
C H A P T E R 4
THE GROWTH AND STRUCTURE OF CRYSTALS
4-1 THE CHOICE OF CRYSTALS
The interpretation of spectroscopic data on ions, molecules and complexes in the solid state can be
greatly facilitated by the choice of an appropriate host crystal. The cbsorption bands in a pure substance are often too strong for the details to be studied directly, so it is diluted by doping it into another crystal.
This dilution also eliminates unwanted exchange effects. When choosing a suitable host crystal several important factors should be considered.
1. It must be possible to grow relatively large (several millimetres across) , single crystals of good optical quality, containing the required concentration of the impurity. The methods used to produce the crystals
will be described in the next section.
2. The impurity must be incorporated into the lattice with the minimum of distortion. In ionic
44
will be able to move around creating its own localised
vibrational modes. Heavy or light impurities (compared
to the ions they replace) will also produce noticeable
changes in the crystal's vibrational spectrum . The table below shows the electronic configuration of all the
quadruply ionised central ions used , their mass and their ionic radii5 1•
Zr Hf Sn Ir Pt Pd
Ionised
config-uration 4d0 5d0 4dl 0 5d5 5d6 4d6 Mass 91. 22 178. 49 118.69 195.09 192. 2 106. 4
Ionic radius
ci)
• 79 . 78 • ry1 .6 5 .68 . 653. For optical studies the host crystal should have no absorption bands in the range being studied. The
colour of transition-metal ions is due to transitions between states arising from a partly filled d shell. If the central metal ion has either an empty or a completely
full d shell, then the first absorption , generally
occurring at higher energies , will be due to an electron transfer transition. The absorption spectrum of the
2-ZrC16 complex in acetonitrile has been measured by
52
Brisdon , Lester and Walton • They found the lowest
reports that Cs2zrc16 crystals are transparent down to
0 54
3000A. Dorain et al . report that the first absorption of properly prepared cs2HfC16 crystals occurs at a wave-length of less than 2400A . The crystals grown here were far from perfect and the start of the absorption bands generally occurred at lower energies. No data was
avail-
2-able for Snc16 , but in the K2snc16 crystals used, the
-1
cut-off was at about 30, 000 cm • The K2SnBr6 crystals were yellow, showing that the electron-transfer band had moved into the visible .
4. If the symmetry of the crystal is known1 group theory can be used to label the states and to obtain selection rules for possible transitions .
5. Choosing a host crystal which has already been used for other studies enables the results obtained to be correlated to earlier results . Knowledge of the vibrational modes, their symmetries and frequencies, is most helpful in interpreting the vibronic sidebands which are frequently observed in transition-metal ion spectra .
46
4-2 GROWTH OF CRYSTALS
Al l the crystal s used were grown in the Physics Department , either from aqueous solution ( the tin salts ) or from the melt ( the zirconium and hafnium salts ) . The platinum group compounds used as starting materi als were supplied by New Metal s and Chemicals Ltd , London , and were 9 9 . 9% pure . All other materials used were high grade Analar reagents .
The K2snc16 crystals were grown from acid solutions containing 0 . 1% to 5% of the dopant . The K2SnC16 was
prepared by evaporation from an acid solution containing stoichometric quantities of KCl and SnC14 • While K2SnC16 is readily soluble in water, the platinum group complexes
are almost insoluble in cold water ( . 48 gm/cc at
2
°c
forK2Ptcl6 ) and only slightly soluble at higher temperatures
( 5 . 2 2 gm/cc at 100°c for K2PtC16) . Because of this large
di fference in solubility it was extremely difficult to
produce large, single, doped crystals . The K2PtC16 , or K2Ircl6 , would usually precipitate out first , forming nuclei for a
mass of polycrystals. Only in one attempt were the crystals containing K2IrC16 of usable size. The concen tration of iridium in these crystal s varied ; those which
grew first being the most heavily doped. None of the
crystals, but some absorption spectra were taken on an aggregrate of polycrystals.
Yellow K2SnBr6 crystals were grown by the same method, but attempts to dope them with K2PtBr6 and K2IrBr6 were unsuccessful.
Pure crystals of K2Ptcl6 and K2PtBr6 were grown by cooling hot acid solutions which were nearly saturated with
5 5
K2PtC16 or K2PtBr6 • These were optically too dense to
obtain spectra from. Crystals containing various concen trations (up to 10%) of iridium were also grown. These would be suitable for e. s. r. measurements, but the
platinum absorption makes it impossible to observe the optical spectrum of the iridium.
The cs2zrc16 and cs2HfC16 crystals were grown from the melt by Mr R. Ritchie, using the Bridgeman method described by Axe, Stapleton and Jefferies5 6• The
cs2zrcl6 (Cs2HfC16) was prepared by dissolving Zrcl4 (HfC14)
in HCl saturated methanol, adding the appropriate amount of CsCl, and refluxing for several hours. The white precipitate was washed with HCl saturated methanol and dried in a vacuum. It was then sublimed under vacuum and sealed off in a quartz tube under half an atmosphere of nitrogen. By lowering the capsule through a gradient
furnace, with a maximum temperature of 850°c, the impurities
4 8
When the pure cs2zrc16 {Cs2HfC16) had been obtained it was ground to a fine powder, mixed with the appropriate
amount of cs2PtC16 or cs2Irc16 {1-5%) , sealed off and recrystallised. There was considerable variation in the quality of the crystals obtained ; the best were large single crystals of reasonably good optical quality which cleaved easily, but most were strained, and shattered
when cut. No satisfactory method of polishing the
crystals was found. Those which cleaved easily had good surfaces already which did not require polishing, while those with poor surfaces shattered while being polished • It was noticeable that the dopant, particularly in the cs2zrcl6/Ir crystals, tended to concentrate near the bottom and sides of the crystals so that several samples of different concentration could be obtained from one crystal*.
*Since the experimental work has been completed the method used to purify the Cs2zrcl6 and Cs2HfC16 has been improved, resulting in better quality crystals. Instead of
The hexabromo complexes of zirconium and hafnium were unstable and decomposed on heating.
In order to lower the symmetry of the octahedral Mx62- complex some cs2IrBr6 was doped into a crystal of
Cs2zrc16 in the hope that some of the chlorine and bromine atoms would be interchanged, producing a mixed halide
complex of lower that most of the
symmetry . It appeared from the spectra
2-
2-IrBr6 had been converted to IrC16 , although there was some evidence that the crystal was distorted.
4-3 CRYSTAL STRUCTURE
All of the crystals used had the face-centred cubic 48
structure of the K2PtC16 type, Fm3m • It has an anti-fluorite structure with the octahedral Ptc162- complex
* (contd)
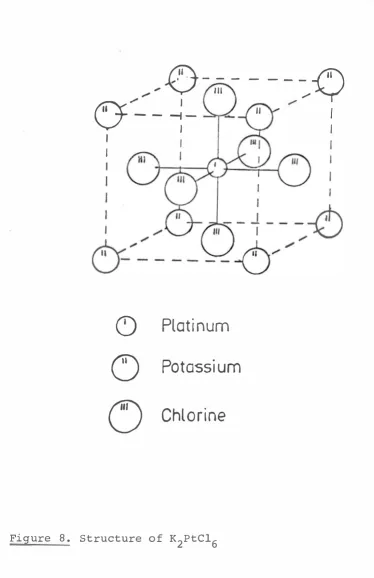
replacing the ca2+, and the K+ replacing the F . The portion of the unit cell shown in Figure 8 shows the
4+
symmetry of the Pt site. The cube formed by the potassium ions is repeated throughout the crystal, but
2-the Ptc16 complexes are alternately placed in 2-these 50
cubes so that the six cubes which share faces with the one shown are empty. Thus each platinum ion has a regular octahedron of chlorine ions around it. Each of these octahedra is surrounded by eight potassium ions, each of which is itself surrounded by four Ptc162- complexes.
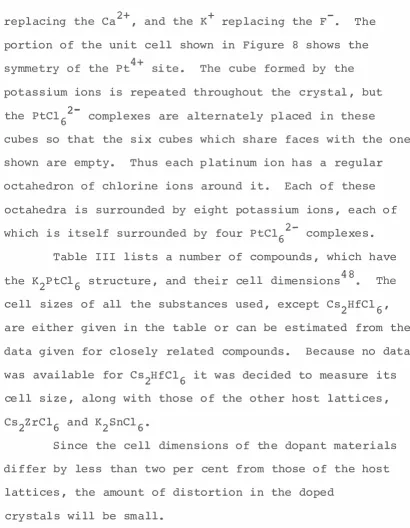
Table III lists a number of compounds, which have
h 1 d h · 11 d ' · 48
t e K2PtC 6 structure, an t eir ce imensions • The cell sizes of all the substances used, except cs2HfC16, are either given in the table or can be estimated from the data given for closely related compounds. Because no data was available for cs2Hfc16 it was decided to measure its cell size, along with those of the other host lattices, Cs2zrcl6 and K2SnC16•
Since the cell dimensions of the dopant materials differ by less than two per cent from those of the host lattices, the amount of distortion in the doped
[image:63.567.73.483.72.600.2](ii\. _
-_,,, , V
Illo
--
--_;_
I I
I
I
()
Plati num
C)
Potassi um
u
Chlorine
Figure 8. Structure of K2PtC16
[image:64.567.52.426.84.662.2]