ISSN Print: 2160-049X
DOI: 10.4236/wjm.2019.94006 Apr. 28, 2019 81 World Journal of Mechanics
Hybrid Power Generation by Using Solar and
Wind Energy: Case Study
Peter Jenkins
1, Monaem Elmnifi
2, Abdalfadel Younis
3, Alzaroog Emhamed
41Department of Mechanical Engineering Department, University of Colorado, Denver, CO, USA 2Department of Mechanical Engineering, Bright Star University, Ajdabiya, Libya
3Department of Mechanical Engineering, Omar Al-Mukhtar University, Bayda, Libya 4Department of Electrical Engineering, Bright Star University, Ajdabiya, Libya
Abstract
Energy is critical to the economic growth and social development of any country. Indigenous energy resources need to be developed to the optimum level to minimize dependence on imported fuels, subject to resolving eco-nomic, environmental and social constraints. This led to an increase in re-search and development as well as investments in the renewable energy in-dustry in search of ways to meet the energy demand and to reduce the de-pendency on fossil fuels. Wind and solar energy are becoming popular owing to the abundance, availability and ease of harnessing the energy for electrical power generation. This paper focuses on an integrated hybrid renewable energy system consisting of wind and solar energies. Many parts of Libya have the potential for the development of economic power generation, so maps locations were used to identify where both wind and solar potentials are high. The focal point of this paper is to describe and evaluate a wind-solar hybrid power generation system for a selected location. Grid-tied power gen-eration systems make use of solar PV or wind turbines to produce electricity and supply the load by connecting to the grid. In this study, the HOMER (Hybrid Optimization Model for Electric Renewable) computer modeling software was used to model the power system, its physical behavior and its life cycle cost. Computer modeling software was used to model the power system, its physical behavior and its life cycle cost. The hybrid power system was designed for a building at the University of Al-Marj (MARJU). Through the use of simulations, the installation of ten 100-kW wind turbines and 150-KW solar PV was evaluated.
Keywords
Hybrid System, Solar and Wind Combination, Renewable Energy, Libya
How to cite this paper: Jenkins, P., Elmni-fi, M., Younis, A. and Emhamed, A. (2019) Hybrid Power Generation by Using Solar and Wind Energy: Case Study. World Jour-nal of Mechanics, 9, 81-93.
https://doi.org/10.4236/wjm.2019.94006
Received: March 11, 2019 Accepted: April 25, 2019 Published: April 28, 2019
Copyright © 2019 by author(s) and Scientific Research Publishing Inc. This work is licensed under the Creative Commons Attribution International License (CC BY 4.0).
DOI: 10.4236/wjm.2019.94006 82 World Journal of Mechanics
1. Introduction
The main resources of energy usage in Libya are oil and gas which results in high emissions of carbon dioxides and other gases. The modern world emphasizes using renewable energy to generate electricity because of its low damage to the en-vironment. The hybrid power plant is a newly developed technology that is used to convert solar energy combined with any system that generates energy [1][2].
Since the oil crisis in the early 1970s, the utilization of the solar and wind power has increased significantly. In recent years, hybrid PV/wind systems have become viable alternatives to meet environmental protection requirements and electricity demands. A hybrid solar-wind energy system uses two renewable energy sources. Hence, efficiency and power reliability of the system increase. However, aggregating inherently stochastic power sources such as wind and so-lar to achieve reliable electricity supply is a non-trivial problem. To use soso-lar and wind energy resources more efficiently and economically, the optimal sizing of hybrid PV/wind systems is important [3]. One of the applications of a PV array and wind turbine is constructing a hybrid energy system PV/wind for use in commercial buildings. The feasibility study of using hybrid energy systems has been an important subject of research around the world in recent years. For in-stance, Amutha and Rajini (2015) investigated the economic, technical and envi-ronmental performance of various hybrid power systems for powering a remote telecom [4]. They concluded that replacing the present arrangement of the diesel power telecom system with their proposed SPV/Wind or SPV/Wind/FC was not just economically justifiable, but also its environment-friendly nature makes it an attractive option to supplement the energy supply from other sources. Nafeh (2011) attempted to size an optimal PV-wind hybrid system by minimizing the total cost of the proposed hybrid energy system and maintaining the loss of power supply probability (LPSP) of the system less than a certain fixed value [5]. Dursun et al. (2013) investigated the possibility of obtaining electricity from so-lar/wind hybrid systems in the remote Turkish city of Edirne. He attempted to decrease the high cost of operating a standalone diesel system and achieve a sub-stantial amount of fuel saving [6].
Ensuring energy security and energy resources used in this country in the fu-ture need to be diversified. Also, to ensure the continuity of supply, an energy mix needs to be rationalized by considering important factors, such as the eco-nomic cost, environmental impact, reliability of supplies and convenience to consumers. The hybrid renewable power generation is a system aimed at the production and utilization of the electrical energy stemming from more than one source, provided that at least one of them is renewable.
DOI: 10.4236/wjm.2019.94006 83 World Journal of Mechanics
model for both off-grid and grid connected power systems for a variety of appli-cations. Wind-solar hybrid systems have numerous advantages [7] [8]. One of the advantages is reliability. When solar and wind power production resources are used together, the reliability is improved and the system energy service is enhanced. What this mean is that in the absence of one type of energy, another would be available to carry out the service. Other advantages are the stability and lower maintenance requirements; thus reducing downtime during repairs or routine maintenance. In addition, being indigenous and free, renewable energy resources contribute to the reduction of pollution emissions.
2. MARJU Hybrid Power Generation System
A design of a low cost power system that combines both wind electric and solar electric technologies is described in this paper. This hybrid system was designed to deliver 0.25 M Watts of continuous power to Al-Marj University (MARJU) to power a wide range of appliances and lower the consumption of the university that provided by the Libyan General Electric Company (Table 1). The system was composed of a wind generator, a solar panel, and an inverter. The solar pan-el and wind turbine work in tandem. An inverter was used to convert DC power into AC power suitable for domestic use.
3. Designing and Modeling of Hybrid System with HOMER
[image:3.595.208.540.496.731.2]The Hybrid Optimization Model for Electric Renewable (HOMER), which is copyrighted by the Midwest Research Institute (MRI), is a computer model de-veloped by the US National Renewable Energy Laboratory (NREL) to assist in the design of power systems and facilitate the comparison of power generation technologies across a wide range of applications (HOMER, ver.2.81 Beta).
Table 1. MARJU consumption [15].
DOI: 10.4236/wjm.2019.94006 84 World Journal of Mechanics
HOMER is used to model a power systems physical behavior and its life-cycle cost, which is the total cost of installing and operating the system over its life time. HOMER performs three principal tasks: simulation, optimization and a sensitivity analysis based on the raw input data given by user. In the simulation process, the performance of a particular power system configuration for each hour of the year was modeled to determine its technical feasibility and lifecycle cost. HOMER can simulate a wide variety of power system configurations, com-prising any combinations of PV array, wind turbines, run-off-river hydro tur-bines, generators and battery bank systems with grid connection or off-grid sys-tems that can serve electrical and thermal loads. The simulation process serves two purposes. First, it determines whether the system is feasible. Second, it esti-mates the lifecycle cost of system, which is the total cost of installing and oper-ating the system over its lifetime [9][10].
3.1. Location Selection
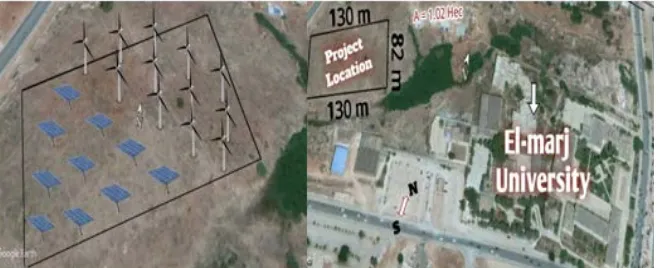
The objective of the paper was to design and model a grid-connected wind-solar hybrid power generation system to meet a certain part of the load requirement of a local grid. As discussed in earlier, the Wind and Solar potential of different geographical locations were studied through literature searches and the detail analysis of identified locations (University of Al-Marj, Libya) was carried out as shown in Figure 1.
3.2. Wind and Solar Hybrid Power System Configuration
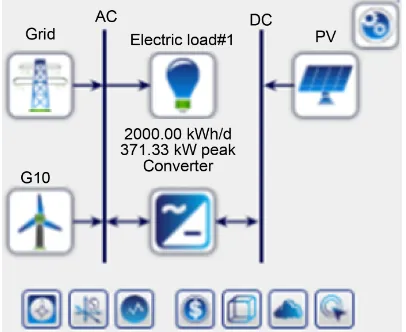
The grid connected wind solar hybrid system consisted of a local grid, PV arrays, wind turbines and inverters. The HOMER software was used as a tool to carry out the analysis. Figure 2 shows the configuration of the grid connected hybrid power system. HOMER requires input information in order to analyze a system. Those inputs are described in detail below.
3.2.1. Wind Resource
[image:4.595.212.540.557.691.2]Hourly measured wind speed data from the NASA surface meteorology and so-lar energy database at 10 m height was used as the wind resource input data.
Figure 1. Geographical map of area (Proposed location for wind-solar hybrid power
DOI: 10.4236/wjm.2019.94006 85 World Journal of Mechanics
Figure 2. Configuration of grid connected hybrid
wind-solar system in HOMER.
Figure 3 illustrates the monthly averaged wind speed data that was obtained. The average wind speed ranges from 4.4 m/s to 8.1 m/s with an annual average of 6.69 m/s.
3.2.2. Solar Radiation
The solar resource data gives the amount of global solar radiation that strikes earth surface in a typical year. The measured hourly average solar radiation on NASA surface meteorology and solar energy database was used as solar resource input data. The latitude was 32˚29' and the longitude was 20˚50' for this location. The average solar radiation ranges from 2.6 kWh/m2/day to 7.9 kWh/m2/day with an annual average of 5.4 kWh/m2/day. The average clearness index is 0.56. The monthly average solar radiation and clearness index are shown in Figure 4 [11].
3.2.3. Wind Turbine
A wind turbine is a device that converts the kinetic energy of the wind into AC or DC electricity. Several wind turbine manufactures, such as Vestas, RE power, Gamesa, Siemens, GE Wind Energy, Enercon, etc. were evaluated for use in this model. The size of the turbine model to be used within a project was based on available wind turbine models, the wind resource at the site, and the ability to perform maintenance. The wind profile and wind speeds at each specific site were evaluated to identify which turbine was suitable for the particular site con-ditions. As the wind turbine itself may be as much as 70% of the total project cost it was vital that it produced the optimal electricity for the given site [12].
DOI: 10.4236/wjm.2019.94006 86 World Journal of Mechanics
[image:6.595.208.545.253.357.2]Figure 3. Monthly average wind speed data.
[image:6.595.209.535.390.537.2]Figure 4. Monthly averaged solar radiation and clearness index.
Figure 5. Power curve of generic 10 KW wind turbine.
Table 2. Generic 10 KW wind turbine specification.
Rated power 100 KW
Start up wind speed 3 m/s
Rated wind speed 12 m/s
Cut out wind speed 21 m/s
Tower height 50 m
Rotor diameter 22 m
Swept area 2300 m2
[image:6.595.208.539.587.729.2]DOI: 10.4236/wjm.2019.94006 87 World Journal of Mechanics
The installed costs in 2010 for onshore wind farms typically ranged between $1800/kW and $2200/kW in most major markets. Wind turbines account for 64% to 84% of total installed costs onshore, with grid connection costs, con-struction costs, and other costs making up the balance. Off-shore wind farms are more expensive and cost $4000 to $4500/kW, with the wind turbines accounting for 44% to 50% of the total cost [13]. Modern wind turbines are designed to work for 120,000 hours throughout their estimated lifespan of 25 years. The life time of the wind turbine considered in this study was assumed to be 25 years. The estimated maintenance costs for modern machines are in the range of 1.5% to 2% of the original investment per annum [14]. Using these values, a 100 KW power plant capital cost will be $1.3 million and the expected O&M cost for the same power plant was $15,000 per year.
3.2.4. Photovoltaic Arrays
The Sunpower x21-335-BLK solar module was selected for the design which has a life time of 25 years with a 21% efficiency. The electrical characteristics of the Sunpower x21-335-BLK are given in Table 3. The assumed installation cost of the 150 KW PV array system was $5.6 million with operational and maintenance cost at 1% of total investment cost. The duration factor was 80% for a lifetime of 25 years.
3.2.5. Converter
[image:7.595.205.536.580.734.2]A converter is a device that converts electric power from DC to AC in a process called inversion, and/or converting from AC to DC is a process called rectifition. The converter size, which is a decision variable, refers to the inverter ca-pacity, meaning the maximum amount of AC power that the device can produce by inverting DC power. The rectifier capacity, which is the maximum amount of DC power that the device can produce by rectifying AC power as a percentage of the inverter capacity, has been specified. The final physical properties of the converter are its inversion and rectification efficiencies, which were assumed to be constant. The inverter and rectifier efficiencies were assumed to be 90% and 85% for this study. The inverter capacity size was selected as 10 kW at a cost of $0.30 million and inverter lifetime of 15 years. Operating and maintenance cost
Table 3. Electrical characteristics of Sunpower x21-335-BLK solar module.
Maximum Power 335 W
Type of Cell Polycrystalline Silicon
Cell Configuration 72 in Series
Open Circuit Voltage Voc 45.1 V
Maximum Power Voltage Vpm 35.2 V
Short Circuit Current Isc 8.94 A
Maximum Power Current Ipm 8.52 A
Module Efficiency 21%
Maximum System Voltage (DC) 1000 V
DOI: 10.4236/wjm.2019.94006 88 World Journal of Mechanics
was assumed to be 1% of the inverter cost.
4. Results and Discussions
In this Section, the results of the designed wind-solar hybrid power generation system are presented and the conclusions from the findings are given.
4.1. Results Analysis
4.1.1. SimulationHOMER simulates the operation of a system by making energy balance calcula-tions in each hourly time step of the year. For each time step, HOMER compares the electric demand in that time step to the energy that the system can supply in that time step. Then, it calculates the flow of energy to and from each compo-nent of the system. HOMER performs these energy balance calculations for each system configurations that were considered. It then determines whether a con-figuration is feasible, i.e., whether it can meet the electric demand under the spe-cified conditions, and estimates the cost of installing and operating the system over the lifetime of the project. The number of installed 100 kW wind turbines was varied from 0 to 10 and the PV modules and converter sizes varied between 0 - 150 kW for the proposed system.
4.1.2. Optimization
[image:8.595.120.539.496.714.2]After simulating all of the possible system configurations, HOMER displayed a list of configurations sorted by net present cost (NPC), i.e. lifecycle cost, which can be used to compare the different system design options. The NPC of a com-ponent is the net present value of all the costs of installing and operating that component over the project lifetime, minus the present value of all the revenues that it earns over the project lifetime. HOMER calculates the NPC of each com-ponent in the system, and of the system as a whole. Figure 6 shows the categorized
DOI: 10.4236/wjm.2019.94006 89 World Journal of Mechanics
[image:9.595.60.536.189.465.2] [image:9.595.64.534.485.710.2]HOMER optimization results. In each category of a different design type it shows only the lowest NPC configuration. In Figure 7 the overall HOMER op-timization results are presented.
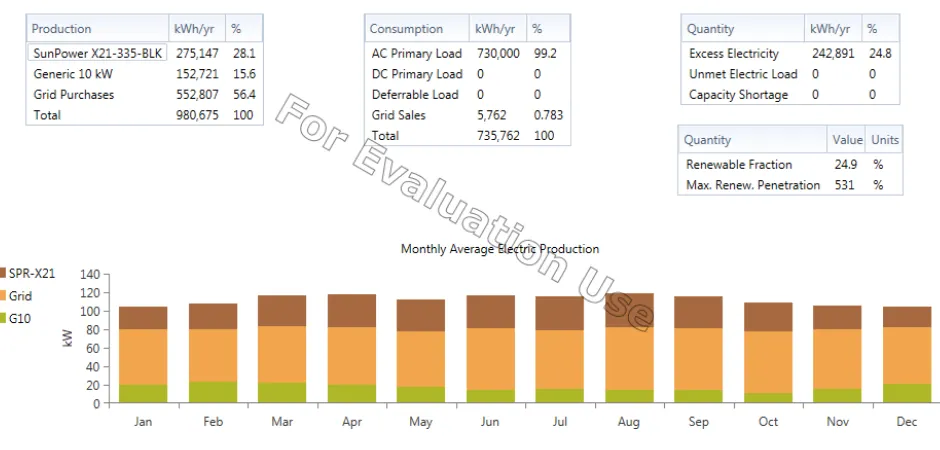
Figure 7 shows that the 100 kW wind turbine and a 150 kW PV module with a 10 kW converter give the cheapest configuration. This configuration has a COE of 0.2 $/kWh and NPC value of $59,305,207. Figure 8 shows the monthly average power production of the selected hybrid system.
Figure 7. Overall HOMER optimization results.
DOI: 10.4236/wjm.2019.94006 90 World Journal of Mechanics
The total annual power generation from the hybrid system was 0.427 GWh, where the solar contributed 0.27 GWh (28%) and 0.15 GWh (15%) was obtained from the wind. Annual generation details obtained from HOMER are given in
Table 4.
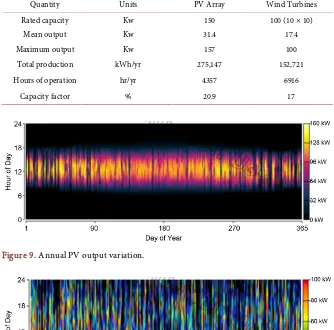
Annual PV Output Variation and Wind Turbine Variation are shown in Fig-ure 9 and Figure 10, respectively.
4.1.3. Financial Evaluation
The financial feasibility of the project was examined using the simple payback method, in which the payback period was the time it takes for the return on the investment to re-pay the sum of the original investment. The original investment in this context was the sum of all investments that are related to the purchasing and installation of wind-solar hybrid system. The return was the income generated
Table 4. Annual generation details of the proposed hybrid system.
Quantity Units PV Array Wind Turbines
Rated capacity Kw 150 100 (10 × 10)
Mean output Kw 31.4 17.4
Maximum output Kw 157 100
Total production kWh/yr 275,147 152,721
Hours of operation hr/yr 4357 6916
[image:10.595.205.539.295.625.2] [image:10.595.210.539.569.705.2]Capacity factor % 20.9 17
Figure 9. Annual PV output variation.
DOI: 10.4236/wjm.2019.94006 91 World Journal of Mechanics
by sale of electricity, reduced by the cost of operation and maintenance. Figure 11 shows the cost and income distributed over the lifetime of the project.
Total generation capacity of the design plant = 0.427 GWh/year. Initial investment = $5.6 million.
Simple payback period = 2.6 years. Internal Rate of Return (IRR) = 38.2%.
The hybrid model gave a simple recovery period of no more than 2.6 years. Given that the typical wind turbine and solar photovoltaic group has an eco-nomic life of up to 25 years, this indicates that an investment will certainly be profitable for the local conditions identified for the renewable energy resources and the very high costs of generating fossil fuel.
5. Environmental Impact
[image:11.595.64.551.443.704.2]Wind or solar power cannot be the sole source of electricity in a stable base-load grid, but they can reduce the use of conventional energy sources. The environ-mental benefits of the wind-solar hybrid system in this study were assessed in terms of avoided emissions. Given that a conventional thermal power plant emits a certain amount of pollutant per kWh of generated electricity, the wind-solar hybrid system can be considered to cause an avoidance of emissions, since it generates the electricity with nearly zero pollutant emissions. Although there are many types of emissions related to electricity production, CO2, sulfur dioxide and nitrogen oxides emissions were considered. CO2 was the largest component of the emissions from a conventional electricity production plant and may be considered as the greatest environmental impact caused by the
DOI: 10.4236/wjm.2019.94006 92 World Journal of Mechanics
power industry. The amount of CO2 produced by conventional diesel fuel is 0.6 kg for 1 kWh. Hence, the reduction of CO2 from energy saving of 0.427 GWh would be 331 tons/y, and 1.5 - 0.74 tons/y annually for sulfur dioxide and nitro-gen oxides emissions.
6. Conclusion
There exists a worldwide concern regarding the energy security and sustainable development of energy across the globe. The role of renewable energy has thefore become more significant. The developed world is already on track for re-ducing the fossil fuel usage and developing the areas of renewable energy tech-nologies. Through this study, an insight into the energy situation and renewable energy potential of Libya was given. It was identified that Libya has an econom-ically feasible power generation potential of wind and solar energy. Using the HOMER simulation code, a grid-tied wind-solar hybrid power generation sys-tem was modeled for a selected location in the Al-Marj’s area of Libya (MARJU), located on the coastal belt near Benghazi. Through the simulation process, the installation of ten 100 kW wind turbines and 150 kw solar PV arrays was identi-fied as a most feasible economical design to supply average load connected to grid where payback period of the design was 2.6 years.
Conflicts of Interest
The authors declare no conflicts of interest regarding the publication of this pa-per.
References
[1] Mohamed, A. and Al-Habaibeh, H. (2013) An Investigation into the Current Utili-zation and Prospective of Renewable Energy Resources and Technologies in Libya. Renewable Energy, 50, 732-740.https://doi.org/10.1016/j.renene.2012.07.038
[2] http://www.dlr.de/tt/en/desktopdefault.aspx/tabid-2885/4422_read-16596/
[3] Fesli, U., Bayir, R. and Özer, M. (2009) Design and Implementation of a Domestic Solar-Wind Hybrid Energy System. Proceedings of the International Conference on Electrical and Electronics Engineering, Bursa, Turkey, 5-8 November 2009, I-29-I-33. [4] Amutha, W.M. and Rajini, V. (2015) Techno-Economic Evaluation of Various
Hy-brid Power Systems for Rural Telecom. Renewable and Sustainable Energy Reviews, 43, 553-561. https://doi.org/10.1016/j.rser.2014.10.103
[5] Nafeh, A.E.S.A. (2011) Optimal Economical Sizing of a PV-Wind Hybrid Energy System Using Genetic Algorithm. International Journal of Green Energy, 8, 25-43.
https://doi.org/10.1080/15435075.2010.529407
[6] Dursun, B., Gokcol, C., Umut, I., Ucar, E. and Kocabey, S. (2013) Techno-Economic Evaluation of a Hybrid PV-Wind Power Generation System. International Journal of Green Energy, 10, 117-136.https://doi.org/10.1080/15435075.2011.641192
[7] HOMER. http://homerenergy.com
En-DOI: 10.4236/wjm.2019.94006 93 World Journal of Mechanics
vironmental Progress & Sustainable Energy, 34, 1521-1527.
https://doi.org/10.1002/ep.12121
[9] Shahinzadeh, H., Abadi, M.M.N., Hajahmadi, M. and Paknejad, A. (2013) Design and Economic Study for Use the Photovoltaic Systems for Electricity Supply in Is-fahan Museum Park. International Journal of Power Electronic and Drive Systems, 3, 83-94.https://doi.org/10.11591/ijpeds.v3i1.1797
[10] Fulzele, J.B. and Dutt, S. (2011) Optimium Planning of Hybrid Renewable Energy System Using HOMER. International Journal of Electrical and Computer Engi-neering, 2, 68-74.https://doi.org/10.11591/ijece.v2i1.157
[11] NASA Surface Meteorology and Solar Energy.
https://eosweb.larc.nasa.gov/sse/
[12] http://
www.windustry.org/community-wind/toolbox/chapter-15-turbine-selection-andpurchase
[13] International Renewable Energy Agency (2012) Renewable Energy Technologies Cost analysis Series, Volume 1: Power Sector, Issue 5/5, Wind Power.
[14] http://www.windmeasurementinternational.com/wind-turbines/om-turbines.php
![Table 1. MARJU consumption [15].](https://thumb-us.123doks.com/thumbv2/123dok_us/9067661.403175/3.595.208.540.496.731/table-marju-consumption.webp)