R E S E A R C H A R T I C L E
Accessibility to food retailers and socio-economic deprivation
in urban New Zealand
Jesse Wiki | Simon Kingham | Malcolm Campbell
GeoHealth Laboratory, College of Science, Department of Geography, The University of Canterbury, Christchurch, New Zealand
Correspondence
Jesse Wiki, GeoHealth Laboratory, College of Science, The University of Canterbury, Private Bag 4800, Christchurch 8140, New Zealand. Email: jesse.wiki@pg.canterbury.ac.nz
Funding information
New Zealand Ministry of Health
Abstract:
The spatial locations of food retailers are considered to be an influential aspect of pop-ulation consumption patterns. Such contextual relationships are often related to socio-economic deprivation, with disparities in accessibility having important implications. This study used Geographic Information Systems and an Enhanced Two-Step Float-ing Catchment Area model of spatial accessibility to further understand such relation-ships within urban areas of New Zealand. Findings, while mixed, indicate that there is generally increased accessibility to all food retailers in highly deprived areas. Under-standing these socio–spatial relationships in local environments has important implica-tions for policy initiatives, health outcomes and sustainable development.
K E Y W O R D S
food retailer, geographic information system, socio-economic deprivation, spatial accessibility
1 | I N T R O D U C T I O N
It has been theorised that economies built on consumption-based growth have led to an increase in chronic health con-ditions due to an associated over-consumption of energy dense, low-nutrient foods (Swinburn et al., 2011). Such effects have been exacerbated by a decrease in physical activity due to the sedentary nature of contemporary life-styles and urban sprawl. Variations in health outcomes have arisen as a product of interactions between global food sys-tems, local environments and individual behaviours with research demonstrating that socio-economic deprivation is an influential variable in relationships between the built environment and population health outcomes. Such research has emerged from multiple disciplines and is therefore shaped by various theoretical and methodological approaches. Of increasing use are Geographic Information Systems (GIS), which enable analysis and visualisation of spatial information to better understand such relationships.
At an ecological level, population exposure to environ-ments where food is low in cost and nutrient quality and physical activity is not supported, often called obesogenic
environments (Swinburn et al., 2011), are a possible explana-tion for socio–spatial variations in health outcomes. While demographic, socio-economic and contextual relationships surrounding health, diet and physical activity are complex, supportive environments are said to be fundamental in shap-ing people's choices (Swinburn et al., 2011). The human body exhibits good physiological defences against energy depletion; however, it has been noted that defences are weak against excess energy accumulation, particularly when highly palatable food opportunities are abundant (Lowe et al., 2009). Furthermore, such environmental barriers may under-mine individual motivations to change unhealthy behaviours and habits. Obesogenic environments have been closely linked to socio-economic status, having negative health effects through several pathways including impeded engage-ment in healthy behaviours, limited education on nutrition and limited financial and geographic access to resources (Fraser, Edwards, Cade, & Clarke, 2010). Research between such environments and socio-economic deprivation is centred on the deprivation-amplification hypothesis whereby populations living in highly deprived areas experience further disadvantage regarding access to health-promoting resources DOI: 10.1111/nzg.12201
(Macintyre, Macdonald, & Ellaway, 2008; Schneider, D'Agostino, Weyers, Diehl, & Gruber, 2015).
The food environment is the physical, economic and socio-cultural surroundings, opportunities and conditions that can influence population choices (Lake & Townshend, 2006; Swinburn et al., 2011). These environments vary greatly and are shaped by the distribution of food retailers by type, price and quality. Common contextual representa-tions are accessibility and density of food retailers (Feng, Glass, Curriero, Stewart, & Schwartz, 2010; Fraser et al., 2010). Food environments are constantly evolving, however, not always equally. Socially stratified spatial patterning of unhealthy outlets may be explained by greater demand, little civic resistance to new developments and lower land use costs for businesses in highly deprived areas (Fraser et al., 2010). Research on the food environment conducted within North America demonstrates clear spatial patterns between areas where there is little or no access to healthy foods—
“food deserts,”socio-economic status and health (Moore & Diez Roux, 2006; Morland, Wing, Diez Roux, & Poole, 2002; Smoyer-Tomic et al., 2008; Walker, Keane, & Burke, 2010). Internationally relationships have not been as clear with research showing mixed results and in many cases dem-onstrating larger concentrations of outlets, both healthy and unhealthy, in highly deprived areas—“food swamps” (Duran, Diez Roux, Latorre, & Jaime, 2013; Feng et al., 2010; Macdonald, Ellaway, & Macintyre, 2009; Macintyre et al., 2008; Macintyre, McKay, Cummins, & Burns, 2005; Maguire, Burgoine, & Monsivais, 2015; Maguire, Burgoine, Penney, Forouhi, & Monsivais, 2017; Pearce, Blakely, Wit-ten, & Bartie, 2007; Pearce, Day, & WitWit-ten, 2008; Pearce, Witten, Hiscock, & Blakely, 2008; Sushil, Vandevijvere, Exeter, & Swinburn, 2017; Svastisalee et al., 2011). Current research findings, while mixed, indicate that contextual asso-ciations between the food environment and socio-economic deprivation may help to explain unequal spatial variations in negative health outcomes. Geographic variation in local environments can thus be an important contributor to popu-lation health that requires further research.
In New Zealand, Pearce et al. (2007) was the first national study to use a GIS-based methodology to examine accessibility to food environments. They found a strong association between deprivation and geographic accessibil-ity, with travel distances to food outlets at least twice as far in the least deprived areas compared to the most deprived. Furthermore, research by Pearce, Day, et al. (2008) analysed the role of neighbourhood access to retail provision of healthy and affordable food, again find-ing that access to a range of retail options was better in highly deprived areas. More recently, research by Sushil et al. (2017) has also confirmed such relationships, demon-strating that food swamps in New Zealand are stratified by deprivation. GIS is an effective tool for exploring the aetiology of health outcomes, particularly in regard to
interactions with the built environment and deprivation. Research using a GIS framework, both internationally and within New Zealand, has used many different measures and contextual variables, making comparisons difficult. This study builds on previous GIS-based research that ana-lyses relationships between the food environment and dep-rivation, using an advanced measure of spatial accessibility and a more robust spatial scale, to further understand such relationships within urban New Zealand.
2 | D A T A A N D M E T H O D S
2.1 | Environmental exposures
Within this study, the term exposure refers to all variables of the food environment, represented by five categories (Table 1). Fast food, takeaway, and dairy/convenience are generally considered to have negative connotations due to the nature of food products sold by these retailers, which tend to be unhealthy due to high quantities of fat and sugar. In contrast, the remaining two categories of supermarket and fruit/vegetable stores are generally considered to have posi-tive connotations due to the availability of healthy foods.
[image:2.595.307.551.641.758.2]Data are from two sources; Ministry for Primary Indus-tries (MPI) and Territorial Authorities1(TAs). Data on busi-ness registrations from MPI was collected in August 2017 (MPI, 2016a, 2016b). MPI is responsible for registering all multinational food franchises and following the Food Act (2014) all businesses that manufacture, prepare or sell food products are required to be registered through the Food Con-trol Programme (FCP) with data on MPI’s public register by December 2019. The transition of businesses to the FCP only started being enforced from March 2016, so TAs were also contacted to ensure a comprehensive dataset. TAs are comprised of 67 governing bodies; 13 city councils, 53 dis-trict councils, and the Chatham Islands Council.2 Data on health licences from 2013 to 2015 were requested from 66 TAs, excluding Chatham Islands due to their remote nature, and pre-defined categories of business were given by 89.6%. If not given the business name was used for categori-sation, with ambiguous names investigated or excluded if a category could not be defined. TA data has been used in the majority of research investigating environmental exposures
TABLE 1 Environmental exposures Study category Description
Fast food Multinational franchises Takeaways National businesses
Dairy/convenience Retailers of pre-packaged convenience foods. Includes dairy, convenience, superette, service stations and small grocers
Supermarket Supermarket franchises
Fruit/vegetable Retailers of fresh produce
in New Zealand (Pearce et al., 2007; Pearce, Day, et al., 2008; Sushil et al., 2017). Many TAs noted, however, that data was already uploaded to the FCP or was incomplete, given that they do not register multinational chains, which is the responsibility of MPI.
Closed premises were removed (Figure 1). If duplicates entries for one premise were given only the latest registration was kept, however, duplicate business names at different locations were kept as unique records. Notably, there are a substantial number of duplicates (Figure 1), as some TAs provided data for all years and therefore the same premises were entered every year, yet only the most recent was kept. Premises with insufficient spatial information were removed before the two datasets were combined, and duplicates removed, to create the final study categories (Figure 1). The final “study categories” (Figure 1) were geocoded using Google Maps Application Programming Interface (API), and the geographic coordinates for any un-matched records were manually looked up.
2.2 | Geographic scale and deprivation
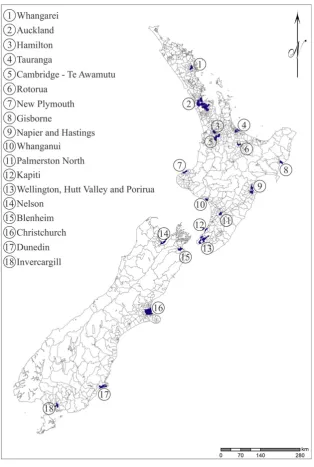
This research focuses on the main urban areas of New Zealand for three reasons: (a) data on environmental exposures is more reliable for urban areas, (b) a substantial proportion of the national population (approximately 86%) lives in urban areas and (b) urban areas reflect similar geo-graphic properties to one another. Urban areas, as shown in Figure 2, were defined using Statistics New Zealand Urban Areas Classification (2013) and Google Earth satellite imag-ery. Statistics New Zealand's Urban Areas Classification (2013) identifies concentrated urban settlements via a hierar-chical sub-division, main urban areas given by this classifi-cation system are generally centred on a city. To visualise the physical extent of urban areas, Google Earth satellite imagery was compared to the boundaries defined by the above classification to retain only the most intensified urban areas.
[image:3.595.146.453.312.741.2]Urban areas were aggregated to Data Zone (DZ) scale. DZs are geographic boundaries developed by Zhao and
Exeter (2016) to accurately reflect the New Zealand popula-tion while adhering to spatial and statistical criteria, which ensures they are robust for analysis. DZs are intermediary sized areas that fall between meshblock3 and census area unit4 scales and were used to avoid statistical issues that may skew analysis or render results unreliable. DZs repre-sent a significant development in socio-spatial research within New Zealand, enabling researchers to move beyond relying on geographic areas based solely on Census bound-aries that are predominately designed for data collection pur-poses. Of a total 5,958 DZs nationwide, 4,089 were classified as urban in this study as indicated in Table 2.
Furthermore, the socio-economic status of DZs was defined using the Index of Multiple Deprivation (IMD) developed by Exeter, Zhao, Crengle, Lee, and Browne (2017). Deprivation using this measure is categorised into
seven domains: employment, income, crime, housing, health, education and access (Exeter et al., 2017). These may be used individually, or in combination, to measure socio-economic deprivation in New Zealand. For this study, the IMD measure without the“access”domain was used in all analysis due to the similarity between some of the measures used to construct this domain and the environmental expo-sures used in this research.
2.3 | Analysis
[image:4.595.141.456.46.514.2]Spatial concurrence of environmental exposures was assessed using Pearson's two-tailed correlation. In essence, spatial concurrence indicates if areas with a high amount of a certain exposure also have a high amount of another and provides an indication of potential clustering of retailers.
Following this, in order to assess relationships between urban populations and environmental exposures population-weighted centroids (PWC) for DZs were created using lati-tude and longilati-tude coordinates of Land Information New Zealand electoral address points (2016). This more accurately reflects where a population is living than a geo-metric centroid and has important implications when consid-ering, for example, DZs with a large surface area of which only a small proportion is inhabited. Analysis was then undertaken in two stages. First, the total usually resident population and the number of each environmental exposure category were extracted for deprivation quintiles to calculate the rate per 1,000 population. Pearson's two-tailed correla-tion was used to assess both the direccorrela-tion and the extent of relationships. Second, an enhanced two-step floating catch-ment area (E2SFCA) model of spatial accessibility was used (Luo & Qi, 2009). Travel time in minutes, via motor vehicle and the road network (Beere, 2016), from each PWC to the nearest five of each environmental exposure was calculated and Gaussian-weighted. This study treats each exposure as having a capacity of one, therefore, the final weighted sum ranges from 0 to 5, representing areas with lowest to highest spatial accessibility. Maps were created to visualise results and the count and proportion of each environmental expo-sure category was calculated and stratified by deprivation quintile.
3 | R E S U L T S
3.1 | Spatial concurrence
Spatial concurrence of environmental exposures demon-strates a low to moderate degree of correlation between all environmental exposures, which are statistically significant at the 0.05 level (Table 3).
A moderate degree of correlation is shown between fast food, takeaways and dairy/convenience outlets (Table 3). Supermarkets are also shown to have moderate correlation, although slightly lower, while fruit/vegetable stores have a low degree of correlation with all exposure categories (Table 3). This relationship is generally expected as food outlets tend to cluster together, whether it be in shopping areas or in highly populated areas, to ensure maximum sales. Fruit/vegetable stores are commonly on the outskirts of urban centres, however, possibly contributing to the low cor-relation shown between this category and other exposures.
3.2 | Spatial accessibility: DZ
The relationship between exposures per 1,000 population and deprivation for main urban areas of New Zealand shows a clear social gradient (Table 4).
The most deprived areas have a higher ratio of all envi-ronmental exposure when compared to the least deprived areas, particularly fast food outlets (Table 4). All other expo-sures are also shown to be more prevalent in more deprived areas but to a lesser degree (Table 4). Although such results demonstrate a higher prevalence on all exposures in deprived areas, this analysis considers exposures within DZ bound-aries only and provides a limited interpretation of the rela-tionship with deprivation. Therefore, the next stage of analysis examined the relationship between deprivation and exposures using an E2SFCA model of spatial accessibility.
3.3 | Spatial accessibility: E2SFCA
[image:5.595.45.290.63.247.2]Visualisation of E2SFCA results are shown for Auckland region only as they are largely reflective of the results for all other urban areas. Results demonstrate low spatial accessi-bility of fruit/vegetable stores, with only small pockets of moderate accessibility (Figure 3). Supermarkets are also within lower and moderate ranks, however, there are signifi-cantly more moderate ranks, particularly in central areas
TABLE 2 Main urban areas
Usually resident populationa(2013)
Number of data zonesa
Auckland 1,251,714 1,697
Wellington 189,273 270
Christchurch 340,059 480
Other Urban—North Island:
Cambridge, Gisborne, Hamilton, Hastings, Kapiti, Hutt Valley, Napier,
New Plymouth, Palmerston North, Porirua, Rotorua, Tauranga, Te Awamutu, Whanganui, Whangarei
915,942 1,299
Other Urban—South Island:
Blenheim, Dunedin, Invercargill, Nelson
248,508 343
TOTAL 2,945,496 4,089
aThe University of Auckland. New Zealand Data Zones developed by Zhao &
Exeter, 2016 and licensed by The University of Auckland for re-use under the Creative Commons Attribution 3.0 New Zealand Licence.
TABLE 3 Spatial concurrence of environmental exposures
Fast food Takeaway Dairy/convenience Supermarket Fruit/vegetable
Fast food 1
Takeaway .602** 1
Dairy/convenience .523** .639** 1
Supermarket .460** .409** .337** 1
Fruit/vegetable .215** .258** .276** .196** 1
[image:5.595.43.560.667.746.2](Figure 3). Fast food, takeaway, and dairy/convenience reflect similar patterns to one another where more populated areas show the highest ranks of accessibility (Figure 3). Overall, high accessibility is fairly focussed on central areas that are largely reflective of the processes by which busi-nesses locations are selected.
This pattern is reflected in all other main urban areas. The assumption behind such spatial patterns is that areas with the highest accessibility are generally centrally located, densely populated areas where there are more shopping areas and less residential spaces. This is an expected pattern as outlets tend to locate in areas that will provide regular patronage and thus be profitable. While this is often central areas, rents can be high in such areas and secondary areas of high accessibility may be less central yet possibly more socially deprived. Generally, urban areas had the highest
accessibility to takeaway and dairy/convenience categories, reflecting the larger number of these outlets and the tendency for such outlets to locate in populated areas. Additionally, dairy/convenience is the most widespread category in regard to accessibility, this is likely because such outlets commonly locate throughout residential areas as well as larger central areas and therefore tend to exhibit a less defined spatial pat-tern. Conversely, fruit/vegetable was the least accessible exposure reflecting both the lower numbers and the general sparseness of locations.
[image:6.595.45.548.63.164.2]Results demonstrating the relationship between depriva-tion and the E2SFCA sum weight, given as 0–5 representing low to high accessibility, are shown in Table 5. Overall, highly deprived areas are less likely to have low accessibility and more likely to have high accessibility to all environmen-tal exposures. The dairy/convenience category exhibited the
TABLE 4 Rate of exposures per 1,000 population by deprivation quintile Deprivation quintile
Q1
Low Q2 Q3 Q4
Q5 High
Ratio
Q5:Q1 ra pvalue
Fast food 0.04 0.19 0.19 0.33 0.27 7.45 .870 .055
Takeaway 0.20 0.60 0.64 0.94 0.76 3.83 .845 .072
Dairy/convenience 0.17 0.40 0.50 0.66 0.67 4.02 .962 .009
Supermarket 0.05 0.08 0.12 0.16 0.13 2.57 .878 .050
Fruit/vegetable 0.02 0.03 0.06 0.07 0.06 3.17 .875 .052
a
Pearson's correlation coefficients.
[image:6.595.106.491.421.741.2]strongest social gradient whereby highly deprived areas are 64% less likely to have low accessibility but over three times more likely to have high accessibility (Table 5). This was reflected in the fast food, takeaway and supermarket expo-sure categories, although to a slightly lesser extent. Fruit/ vegetable, while demonstrating that highly deprived areas are roughly five times more likely to have moderate accessi-bility than less deprived areas, did not show the same pattern in the most accessible measure (Table 5). As discussed pre-viously, this may be due to the very few areas that had the highest accessibility measure to this exposure category, reflecting its sparse nature.
4 | D I S C U S S I O N
Globalisation and urbanisation have led to rapidly changing environments with populations experiencing fundamental shifts in dietary consumption patterns. Food environments
are increasingly saturated with energy-dense and nutrient-poor foods with results of this study indicating that highly deprived neighbourhoods are excessively serviced by a range of food providers. This excess of food availability, if partnered with the economic accessibility of low-nutrient foods, can impact significantly on population health and could begin to explain patterns of increased negative health outcomes in deprived areas.
[image:7.595.46.550.63.491.2]This study has demonstrated a social gradient of all food environment exposures, with generally increased spatial accessibility in highly deprived areas. Findings support inter-national studies that have found higher densities of environ-mental exposures, particularly unhealthy exposures, in highly deprived areas (Lamichhane et al., 2013; Macdonald, Cummins & Macintyre, 2007). Interestingly, however, find-ings do not support international evidence that food environ-ment exposures commonly considered as healthy tend to be located in less deprived areas (Moore & Diez Roux, 2006;
TABLE 5 Socio-economic deprivation and exposure accessibility based on two-step floating catchment area (E2SFCA) Deprivation quintile
Q1
Low Q2 Q3 Q4
Q5
High Total Ratio Q5:Q1
Fast food
0–1 28.3 (280) 18.0 (178) 17.6 (174) 15.5 (153) 20.5 (203) 100 (988) 0.73 1.1–2 22.6 (217) 16.8 (162) 18.4 (177) 19.0 (183) 23.2 (223) 100 (962) 1.03 2.1–3 17.6 (162) 19.7 (182) 18.9 (174) 21.1 (195) 22.8 (210) 100 (923) 1.3 3.1–4 11.2 (90) 18.6 (149) 23.7 (190) 24.7 (198) 21.7 (174) 100 (801) 1.93
4.1–5 7.0 (29) 17.8 (74) 22.4 (93) 28.9 (120) 23.9 (99) 100 (415) 3.41
Takeaway
0–1 31.1 (123) 21.3 (84) 17.5 (69) 13.7 (54) 16.5 (65) 100 (395) 0.53
1.1–2 26.3 (173) 17.8 (117) 17.3 (114) 11.1 (73) 27.5 (181) 100 (658) 1.05 2.1–3 23.9 (187) 18.3 (143) 19.9 (156) 18.3 (143) 19.7 (154) 100 (783) 0.82 3.1–4 17.5 (179) 19.3 (198) 19.2 (197) 21.7 (222) 22.3 (228) 100 (1024) 1.27 4.1–5 9.4 (116) 16.5 (203) 22.1 (272) 29.0 (357) 22.9 (281) 100 (1229) 2.42 Dairy/convenience
0–1 34.4 (115) 21.6 (72) 19.8 (66) 12.0 (40) 12.3 (41) 100 (334) 0.36
1.1–2 29.5 (191) 17.1 (111) 14.0 (91) 15.9 (103) 23.5 (152) 100 (648) 0.8 2.1–3 20.3 (202) 20.1 (200) 21.2 (211) 19.6 (195) 18.6 (185) 100 (993) 0.92 3.1–4 17.5 (189) 18.4 (198) 20.2 (218) 19.4 (209) 24.5 (264) 100 (1078) 1.4 4.1–5 7.8 (81) 15.8 (164) 21.4 (222) 29.2 (302) 25.8 (267) 100 (1036) 3.3 Supermarket
0–1 27.1 (339) 19.6 (246) 18.6 (233) 15.0 (188) 19.6 (246) 100 (1252) 0.73 1.1–2 17.3 (290) 18.1 (304) 18.8 (316) 22.1 (372) 23.7 (398) 100 (1680) 1.37 2.1–3 14.2 (114) 15.2 (122) 21.9 (176) 24.8 (199) 23.9 (192) 100 (803) 1.68
3.1–4 10.7 (33) 17.9 (55) 23.5 (72) 25.4 (78) 22.5 (69) 100 (307) 2.09
4.1–5 4.3 (2) 38.3 (18) 23.4 (11) 25.5 (12) 8.5 (4) 100 (47) 2
Fruit/vegetable
0–1 22.6 (652) 18.9 (546) 19.3 (559) 18.6 (538) 20.6 (595) 100 (2890) 0.91 1.1–2 12.4 (104) 16.3 (137) 22.7 (191) 24.3 (204) 24.4 (205) 100 (841) 1.97
2.1–3 6.2 (17) 14.2 (39) 15.3 (42) 32.4 (89) 32.0 (88) 100 (275) 5.18
3.1–4 5.8 (4) 20.3 (14) 18.8 (13) 26.1 (18) 29.0 (20) 100 (69) 5
4.1–5 7.1 (1) 64.3 (9) 21.4 (3) 0.0 (0) 7.1 (1) 100 (14) 1
Morland et al., 2002; Walker et al., 2010). Results instead demonstrate that highly deprived areas are more likely to have both unhealthy and healthy food environment expo-sures. Such relationships differ from those found in North America, but are similar to relationships found in previous New Zealand research (Pearce et al., 2007; Pearce, Day, et al., 2008; Pearce, Witten, et al., 2008; Sushil et al., 2017) and reflective of mixed results found in the United King-dom. This may be, in part, due to historical and cultural fac-tors that have shaped not only population composition but also the spatial provision and perceptions of food retailers.
The results of this study expand on prior New Zealand research that demonstrated social stratification in the range and density of environmental exposures in urban areas (Pearce, Day, et al., 2008). This research builds on that of Pearce, Day, et al. (2008) using not only more up-to-date data but also a more robust spatial scale and advanced mea-sures of environmental expomea-sures. Furthermore, unlike this study, Pearce, Day, et al. (2008) did not distinguish between multinational and local fast food for buffer analysis. For this study, this category was divided into fast food, to represent multinational outlets, and takeaway to represent local outlets. It is also important to note that this study used broader counts of environmental exposures when compared to Pearce, Day, et al. (2008) to ensure that a significant propor-tion of DZs were available for all categories.
While results demonstrated minor differences to previous New Zealand studies (Pearce, Day, et al., 2008) the general direction and strength of relationships remained similar despite the differing measure of spatial accessibility used. This indicates that relationships between accessibility to food retailers and deprivation persist beyond immediate neighbourhoods, stretching into the scope of the wider com-munity. Despite how such accessibility is measured, socio-economic factors still influence the excessive levels of food providers and choice in highly deprived areas. Explanations behind this social patterning are likely reflective of many facets. Notably, the price of land values and zoning mea-sures play an important role in the location of environmental exposures. For example, lower rental costs and restrictions of business locations may encourage businesses to cluster in highly deprived areas. Additionally, public resistance to cer-tain businesses in affluent areas may compound such spatial patterns.
Results should be of interest to urban planning and pol-icymakers in New Zealand as a better understanding of local environments can not only have significant implications when it comes to addressing inequalities but also when con-sidering health outcomes, particularly for vulnerable popula-tions. While findings demonstrate a limited influence of spatial accessibility, they do contribute to an improved understanding of the contextual relationship between envi-ronmental exposures and socio-economic deprivation. This aids in not only shedding light on the environment that
current policies and planning initiatives have created but also encourages governing bodies to be mindful of the contextual aspect of such issues in order to mitigate further exacerba-tion of “food swamps” in highly deprived areas. Further research on such relationships and inequalities in population health outcomes is warranted to fully understand the impli-cations of environmental exposures.
Results of this study should be interpreted with consider-ation of its limitconsider-ations. First, this study is cross-sectional and can only provide a limited measure of spatial accessibility over a given time. Second, there are many factors besides spatial proximity that should be taken into account when try-ing to assess how populations access environmental expo-sures such as quality and cost of products. Food knowledge and the purchasing and eating behaviours of varying socio-economic groups are also important factors to consider as they are likely to influence consumption patterns. Finally, not only do populations regularly access food outside of their direct neighbourhood but their perception of neighbour-hood may differ from the measures used in this study. Fur-ther assessment of the influence of quality, cost, food knowledge and mobility patterns of residents is needed to fully understand relationships discussed within this study.
5 | C O N C L U S I O N
In conclusion, this study contributes to a growing body of research that assesses contextual understandings of the food environment and socio-economic deprivation. Previous stud-ies have generally considered isolated environmental expo-sures or geographic areas and have used meaexpo-sures of spatial accessibility that consider defined spatial boundaries only, such as census area or buffers. This study has built on this by considering all urban areas of New Zealand and multiple environmental exposures, with an advanced measure of spa-tial accessibility.
This study demonstrates social stratification of many environmental exposures that are disproportionately located in highly deprived areas of urban New Zealand, raising the question of access versus excess. Findings highlight the importance of considering multiple environmental exposures and advanced measures of spatial accessibility when asses-sing relationships between food retailers and socio-economic deprivation. Such research provides a platform on which to develop strategies and policies to reduce inequalities for urban populations, however, further research is needed to evaluate the impact of environmental exposures on popula-tion health outcomes.
A C K N O W L E D G E M E N T S
University of Auckland, for the provision of data relating to spatial scale and socio-economic deprivation.
N O T E S
1
Territorial authorities are the second tier of local government.
2
The Chatham Islands are located approximately 800 km east of the South Island, forming an archipelago in the Pacific Ocean.
3
Meshblocks are the smallest geographical unit for data dissemination con-taining approximately 100 people.
4
Census area units generally coincide with whole suburbs, or part thereof, and contain populations up to 5,000.
R E F E R E N C E S
Beere, P. (2016).Creating a road network analysis layer with travel time esti-mates from open-source data.White Paper Report, GeoHealth The Labora-tory, New Zealand. Retrieved from http://www.geohealth.canterbury.ac.nz/ working/beere2016.pdf
Duran, A. C., Diez Roux, A. V., Latorre, M. d. R. D. O., & Jaime, P. C. (2013). Neighborhood socioeconomic characteristics and differences in the availabil-ity of healthy food stores and restaurants in Sao Paulo, Brazil. Health & Place,23, 39–47. https://doi.org/10.1016/j.healthplace.2013.05.001 Exeter, D. J., Zhao, J., Crengle, S., Lee, A., & Browne, M. (2017). The
New Zealand Indices of Multiple Deprivation (IMD): A new suite of indica-tors for social and health research in Aotearoa, New Zealand.PLOS One,
12(8), 1–19. https://doi.org/10.1371/journal.pone.0181260
Feng, J., Glass, T. A., Curriero, F. C., Stewart, W. F., & Schwartz, B. S. (2010). The built environment and obesity: A systematic review of the epidemiologic evidence. Health & Place, 16(2), 175–190. https://doi.org/10.1016/j. healthplace.2009.09.008
Fraser, L. K., Edwards, K. L., Cade, J., & Clarke, G. P. (2010). The geography of fast food outlets: A review. International Journal of Environmental Research and Public Health, 7(5), 2290–2308. https://doi.org/10.3390/ ijerph7052290
Lake, A., & Townshend, T. (2006). Obesogenic environments: Exploring the built and food environments.Journal of the Royal Society for the Promotion of Health,126(6), 262–267. https://doi.org/10.1177/1466424006070487 Lamichhane, A. P., Warren, J., Puett, R., Porter, D. E., Bottai, M.,
Mayer-Davis, E. J., & Liese, A. D. (2013). Spatial patterning of supermarkets and fast food outlets with respect to neighborhood characteristics.Health & Place,23, 157–164. https://doi.org/10.1016/j.healthplace.2013.07.002 Land Information New Zealand street electoral address data (2016).Street
elec-toral address data.Retrieved from https://data.linz.govt.nz/group/electoral/ data/category/roads-and-addresses
Lowe, M. R., Butryn, M. L., Didie, E. R., Annunziato, R. A., Thomas, J. G., Crerand, C. E., & Halford, J. (2009). The power of food scale. A new mea-sure of the psychological influence of the food environment.Appetite,53(1), 114–118. https://doi.org/10.1016/j.appet.2009.05.01
Luo, W., & Qi, Y. (2009). An enhanced two-step floating catchment area (E2SFCA) method for measuring spatial accessibility to primary care physi-cians. Health & Place, 15(4), 1100–1107. https://doi.org/10.1016/j. healthplace.2009.06.002
Macdonald, L., Cummins, S., & Macintyre, S. (2007). Neighbourhood fast food environment and area deprivation-substitution or concentration?. Appetite,
49(1), 251–254. https://doi.org/10.1016/j,appet.2006.11.004
Macdonald, L., Ellaway, A., & Macintyre, S. (2009). The food retail environ-ment and area deprivation in Glasgow city, UK. International Journal of Behavioral Nutrition and Physical Activity,6(1), 52–52. https://doi.org/10. 1186/1479-5868-6-52
Macintyre, S., Macdonald, L., & Ellaway, A. (2008). Do poorer people have poorer access to local resources and facilities? The distribution of local resources by area deprivation in Glasgow, Scotland.Social Science & Medi-cine,67(6), 900–914. https://doi.org/10.1016/j.socscimed.2008.05.029 Macintyre, S., McKay, L., Cummins, S., & Burns, C. (2005). Out-of-home food
outlets and area deprivation: Case study in Glasgow, UK. International
Journal of Behavioral Nutrition and Physical Activity,2(1), 16–16. https:// doi.org/10.1186/1479-5868-2-16
Maguire, E. R., Burgoine, T., & Monsivais, P. (2015). Area deprivation and the food environment over time: A repeated cross-sectional study on takeaway outlet density and supermarket presence in Norfolk, UK, 1990-2008.
Health & Place, 33, 142–147. https://doi.org/10.1016/j.healthplace.2015. 02.012
Maguire, E. R., Burgoine, T., Penney, T. L., Forouhi, N. G., & Monsivais, P. (2017). Does exposure to the food environment differ by socioeconomic position? Comparing area-based and person-centred metrics in the fenland study, UK.International Journal of Health Geographics,16, 33. https://doi. org/10.1186/s12942-017-0106-8
Ministry for Primary Industries. (2016a).Public register of food control plans and food businesses subject to a nation programme.Retrieved from: http:// mpiportal.force.com/publicregister
Ministry for Primary Industries. (2016b).Food safety.Retrieved from http:// www.foodsafety.govt.nz/registers-lists
Moore, L. V., & Diez Roux, A. V. (2006). Associations of neighborhood charac-teristics with the location and type of food stores.American Journal of Pub-lic Health,96(2), 325–331. https://doi.org/10.2105/AJPH.2004.058040 Morland, K., Wing, S., Diez Roux, A., & Poole, C. (2002). Neighborhood
char-acteristics associated with the location of food stores and food service places.
American Journal of Preventive Medicine,22(1), 23–29.
Pearce, J., Blakely, T., Witten, K., & Bartie, P. (2007). Neighborhood depriva-tion and access to fast-food retailing: A nadepriva-tional study.American Journal of Preventive Medicine,32(5), 375–382.
Pearce, J., Day, P., & Witten, K. (2008). Neighbourhood provision of food and alcohol retailing and social deprivation in urban New Zealand.Urban Policy and Research,26(2), 213–227. https://doi.org/10.1080/08111140701697610 Pearce, J., Witten, K., Hiscock, R., & Blakely, T. (2008). Regional and urban–
rural variations in the association of neighbourhood deprivation with com-munity resource access: A national study. Environment and Planning,
40(10), 2469–2489. https://doi.org/10.1068/a409
Schneider, S., D'Agostino, A., Weyers, S., Diehl, K., & Gruber, J. (2015). Neigh-borhood deprivation and physical activity facilities—No support for the dep-rivation amplification hypothesis.Journal of Physical Activity & Health,
12(7), 990–997.
Smoyer-Tomic, K. E., Spence, J. C., Raine, K. D., Amrhein, C., Cameron, N., Yasenovskiy, V., & Healy, J. (2008). The association between neighborhood socioeconomic status and exposure to supermarkets and fast food outlets.Health & Place,14(4), 740–754. https://doi.org/10.1016/j.healthplace.2007.12.001 Statistics New Zealand. (2013). Urban-rural classification. Retrieved from
http://archive.stats.govt.nz/methods/classifications-and-standards/ classification-related-stats-standards/urban-area.aspx
Sushil, Z., Vandevijvere, S., Exeter, D. J., & Swinburn, B. (2017). Food swamps by area socioeconomic deprivation in New Zealand: A national study. Inter-national Journal of Public Health,62(8), 869–877. https://doi.org/10.1007/ s00038-017-0983-4
Svastisalee, C. M., Nordahl, H., Glümer, C., Holstein, B. E., Powell, L. M., & Due, P. (2011). Supermarket and fast-food outlet exposure in Copenhagen: Asso-ciations with socio-economic and demographic characteristics.Public Health Nutrition,14(9), 1618–1626. https://doi.org/10.1017/S1368980011000759 Swinburn, B., Sacks, G., Hall, K., McPherson, K., Finegood, D., Moodie, M., &
Gortmaker, S. (2011). The global obesity pandemic: Shaped by global drivers and local environments.Lancet,378(9793), 804–814.
Walker, R. E., Keane, C. R., & Burke, J. G. (2010). Disparities and access to healthy food in the United States: A review of food deserts literature.Health & Place,16(5), 876–884. https://doi.org/10.1016/j.healthplace.2010.04.013 Zhao, J., & Exeter, D. J. (2016). Developing intermediate zones for analysing the
social geography of Auckland, New Zealand.New Zealand Geographer,
72(1), 14–27.