ISSN Print: 2151-1950
DOI: 10.4236/jgis.2019.113025 Jun. 30, 2019 405 Journal of Geographic Information System
GIS Water Quality Simulation Study: Chinchuba
Watershed
Gianna M. Cothren
Department of Civil and Environmental Engineering, College of Engineering, University of New Orleans, New Orleans, LA, USA
Abstract
The purpose of the study is to enhance the watershed management for St. Tammany parish, LA through development of a model that will account for water quality impacts. Bayou Chinchuba in St. Tammany parish Louisiana is selected for this water quality model. Developed with HSPF (Hydrologic Si-mulation Program in Fortran), the model is used to calculate NO3, PO4, and
BOD loading rates for varying scenarios of land use development. GIS tools are used to determine, visualize, and compare the total loads generated within sub-basins of the watershed based on the model simulation results. With the GIS calculation of NO3, PO4, and BOD total load and visualization
enhance-ment, this tool simulates existing conditions and compares the water quality impact to 2020 expectation values.
Keywords
GIS, HSPF, Water Quality Simulation, Landuse
1. Introduction
An HSPF (Hydrologic Simulation Program in Fortran) model has been devel-oped that can be used to visualize the impact on water quality with changes in land use. The study area selected for this project is Bayou Chinchuba which is 5780 acres consisting of undeveloped land, commercial property, and residential development [1]. Part of the watershed is within the City of Mandeville. The main channel of Bayou Chinchuba is 7.5 miles in length and discharges to Lake Ponchartrain. The lower part of the watershed, nearest Lake Pontchartrain, has had rapid residential development over the past 10 years [1]. The upper end of the watershed is less developed, but overall development patterns in St Tamma-ny parish suggest that this area will see development in the immediate future [1]. Without a comprehensive management approach to future land development How to cite this paper: Cothren, G.M.
(2019) GIS Water Quality Simulation Study: Chinchuba Watershed. Journal of Geographic Information System, 11, 405-410.
https://doi.org/10.4236/jgis.2019.113025
Received: July 31, 2018 Accepted: June 27, 2019 Published: June 30, 2019
Copyright © 2019 by author(s) and Scientific Research Publishing Inc. This work is licensed under the Creative Commons Attribution International License (CC BY 4.0).
DOI: 10.4236/jgis.2019.113025 406 Journal of Geographic Information System that takes into account water quality, a decrease in the beneficial uses of this wa-terway could occur. The Bayou Chinchuba water quality model has been devel-oped to be used as a guide in making decisions concerning land development within the existing system. This project will focus on using GIS to calculate and display water quality loading rates within sub basins of the Bayou Chinchuba watershed.
2. Methodology
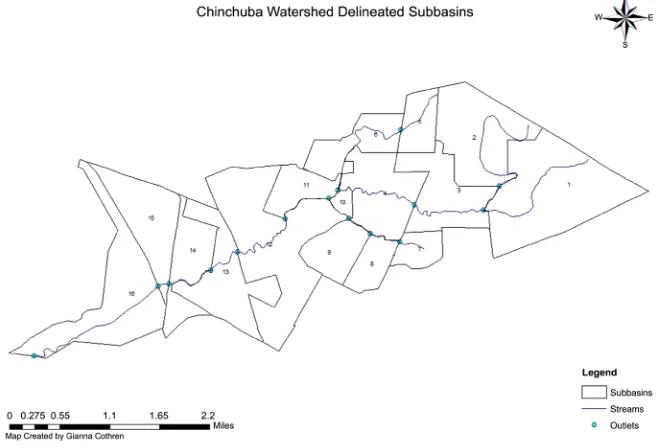
The HSPF model [2] uses a GIS database for development of the model and, through this project, the display of the water quality results. The shape file of the Chinchuba watershed from a previous study is imported and associated with the National Hydrography Dataset (NHD) stream database, soils, and land use (Figure 1). The sub-basins within the Chinchuba watershed are manually deli-neated and clipped to the watershed boundary. The EPA BASIN’s networking tool is used to create outlets, sub-basins, and steams for the HSPF [3]. The model simulation is calibrated for flow, and then the water quality components are added including parameters for NO3, PO4, and BOD [4]. Each is calibrated for
flow and then water quality using existing data.
[image:2.595.208.536.407.631.2]A base case is considered the current state of the watershed with regard to landuse distribution and topographical data that are used to build the model
Figure 1. Chinchuba Watershed delineated shape file with Hydrography Dataset (NHD) stream database and outlets (USGS) along Bayou Chinchuba, St. Tammany parish Loui-siana imported to ArcGIS 10.3. Source: United States Geological Survey (2008). National Hydrography Dataset (NHD)—USGS National Map Downloadable Data Collection. Available from USGS website:
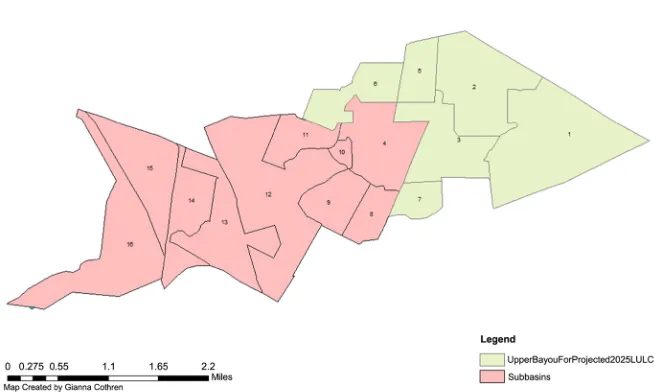
DOI: 10.4236/jgis.2019.113025 407 Journal of Geographic Information System (Table 1). The future development scenario using the St. Tammany 2025 land use development plan is created (Figure 2). The greatest change in landuse from existing conditions to expected 2025 land use occurred with forest land in the upper watershed being converted to conservative residential [1]. Within HSPF, program modules for pervious land and impervious land are setup with initial values for the water quality parameters and accumulated over the simulation pe-riod. This results in predicted loading rates, which are calibrated to match his-torical observations, leading to final water quality loading rates. The HSPF mod-el land use area is modified to the expected 2025 land use to simulate this differ-ence by remapping the current condition landuse in HSPF to match the St. Tammany land use plan (Table 1). Forested areas of the upper watershed are converted to pervious built up land in the model. The new load rate for each specific land use is re-calculated by the HSPF model. The average annual land use load rate in lbs/acre for NO3, PO4, and BOD are exported to be used to
[image:3.595.208.540.365.537.2]po-pulate an average annual load rate table in the GIS (Table 2). The HSPF model’s simulated land cover classifications are remapped to match the landuse data of the existing landuse file shown in Table 1.
Table 1. Re-mapping of land use classifications in HSPF model to match the St. Tamma-ny Land Use Plan.
Existing Landuse Classifications HSPF Landcover Classifications
Open/Forest Forest
Low Density Residential Urban
Municipal/Urban Urban
Commercial Urban
Roads Urban
Coastal Marsh Wetland
Water Water
Ag/Pasture/Cropland Barren
Ag/Pasture/Cropland Agriculture
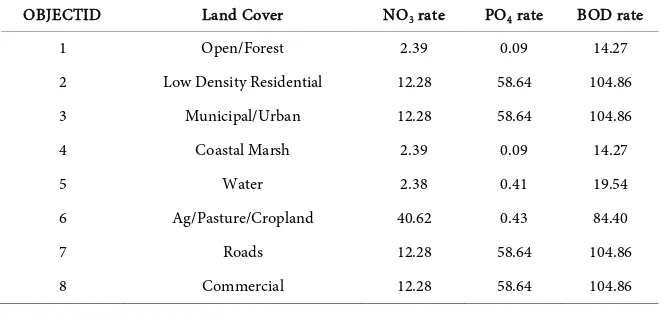
Table 2. Load rate (lb/ac.yr) table created in the project geodatabase.
OBJECTID Land Cover NO3 rate PO4 rate BOD rate
1 Open/Forest 2.39 0.09 14.27
2 Low Density Residential 12.28 58.64 104.86
3 Municipal/Urban 12.28 58.64 104.86
4 Coastal Marsh 2.39 0.09 14.27
5 Water 2.38 0.41 19.54
6 Ag/Pasture/Cropland 40.62 0.43 84.40
7 Roads 12.28 58.64 104.86
[image:3.595.209.540.569.731.2]DOI: 10.4236/jgis.2019.113025 408 Journal of Geographic Information System
Figure 2. 2025 Projected landuse change in upper Chinchuba watershed.
With ArcCatalog [5], the AvgAnnualLoadperLandCover table is created with NO3_rate, PO4_rate, BOD_rate, fields using double precision data type. This
ta-ble is populated with the loading rates using the editor. An intersection of the Chinchuba watershed and existing landuse is performed and three new fields for NO3, PO4, and BOD load calculation are added. Three fields are added to the
in-tersection table for the NO3, PO4, and BOD loads. The
AvgAnnualLoadper-LandCover is joined to the watershed/existing land use Intersection layer using LandCover and Reclassify fields so that the load can be calculated using the sub-basin areas and the load rates for each land use in each subsub-basin. The Field Cal-culator is used to multiply the load rate by each landuse area divided by the 4046.86 mm2/ac conversion to acres resulting in the total load in lbs for each
landuse polygon. The final step is to create three copies of the layers to be sym-bolized for NO3, PO4, and BOD. Each is then symbolized with quantities using
graduated color.
3. Results and Discussion
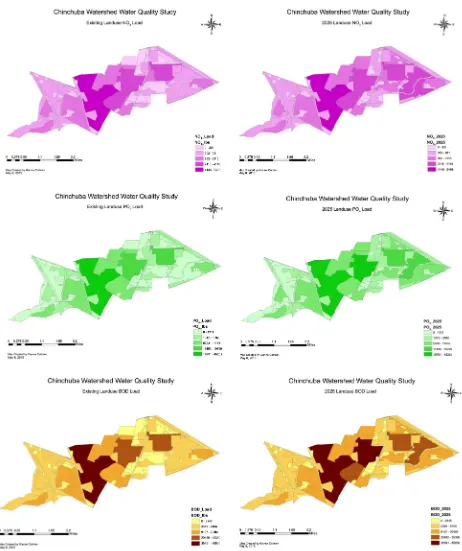
The final results in Figure 3 are created in side-by-side ArcMap layouts [5]. These results depict changes in water quality loads of NO3, PO4, and BOD as landuse
changes from existing conditions to the future expected 2025 condition in the upper watershed of Bayou Chinchuba. The deeper hues in the upper Chinchuba graphically present the increased loads expected in 2025.
DOI: 10.4236/jgis.2019.113025 409 Journal of Geographic Information System
Figure 3. NO3, PO4, and BOD simulated load differences from exiting to future conditions.
into a tool that can be used to visualize the impact on water quality with changes in landuse.
Conflicts of Interest
DOI: 10.4236/jgis.2019.113025 410 Journal of Geographic Information System
References
[1] Bayou Chinchuba Watershed Management Plan (2006) Buchart Horn, Inc.
[2] Bricknell, B.R., Imhoff, J.C., Kittle, J.L., Donigan, A.S. and Johanson, R.C. (1996) Hydrological Simulation Program—FORTRAN User’s Manual for Release 11. U. S. Environmental Protection Agency, Athens.
[3] Better Assessment Science Integrating Point Sources (2001) BASINS Version 3.0 User Manual, United States Environmental Protection Agency, EPA-823-B-01-001, Office of Water, Washington DC.
[4] Environmental Protection Agency (2000) BASINS Technical Note 6: Estimating Hydrology and Hydraulic Parameters for HSPF; EPA 823-R00-0012, U.S. Environ-mental Protection Agency, Washington DC.