ISSN Online: 2152-7261 ISSN Print: 2152-7245
DOI: 10.4236/me.2019.106104 Jun. 28, 2019 1581 Modern Economy
Economic Impact of McNenny State Fish
Hatchery, Spearfish, South Dakota, USA
Michael E. Barnes
*, Timothy Palmer
McNenny State Fish Hatchery, South Dakota Game, Fish and Parks, Spearfish, USA
Abstract
McNenny State Fish Hatchery, rural Spearfish, South Dakota, USA produces trout and salmon for stocking into public recreational fishing waters in South Dakota. Hatchery operations at McNenny are funded solely by the sale of hunting and fishing licenses and an excise tax on fishing equipment. This study evaluated the monetary contribution of hatchery expenditures and fish production to the local economy of South Dakota for calendar year 2017. The economic value of the fish raised at McNenny State Fish Hatchery in 2017 was calculated to be $6,609,576.03 USD. When added to the estimated McNenny share of angler expenditures in the Black Hills National Forest, the total local monetary impact of McNenny State Fish Hatchery operations and fish stocking was slightly more than $22 million. Based on annual hatchery expenditures, McNenny operations generated $51.68 of local economic out-put for every budgetary dollar spent in 2017.
Keywords
Fish Hatchery, Economic Impact, Recreational Fishing
1. Introduction
Recreational angling is a very important component of the gross domestic product of the United States [1]. After jogging, it is the second most popular outdoor activity in the country [2]. In 2017, over 49 million Americans representing 17% of the entire population of the United States took approx-imately 885 million fishing outings [2]. These anglers generated nearly $50 bil-lion (USD) in retail sales, impacting the livelihoods of more than 800,000 people [3].
Fish produced in publicly-owned hatcheries are critical to the creation, main-tenance, and improvement of recreational fishing opportunities in the United
How to cite this paper: Barnes, M.E. and Palmer, T. (2019) Economic Impact of McNenny State Fish Hatchery, Spearfish, South Dakota, USA. Modern Economy, 10, 1581-1588.
https://doi.org/10.4236/me.2019.106104
Received: May 10, 2019 Accepted: June 25, 2019 Published: June 28, 2019
Copyright © 2019 by author(s) and Scientific Research Publishing Inc. This work is licensed under the Creative Commons Attribution International License (CC BY 4.0).
http://creativecommons.org/licenses/by/4.0/
DOI: 10.4236/me.2019.106104 1582 Modern Economy States [4]. For example, in 2016, the United States Fish and Wildlife Service produced and released 135 million adult and juvenile fishes from 66 federal hat-cheries into the waters of 44 states [5]. Nearly every state government also owns and operates numerous hatcheries producing fish for recreational angling. Some examples include Colorado, with 19 government freshwater hatcheries produc-ing 90 million fish a year for stockproduc-ing into public fishproduc-ing waters
(https://cpw.state.co.us/hatcheries), New York, with 12 hatcheries producing 2.3 million catchable-size trout (http://www.dec.ny.gov/outdoor/7742.html), and Texas, with 3 saltwater and 5 freshwater hatcheries, growing and stocking nearly 40 million fish each year
(https://tpwd.texas.gov/fishboat/fish/management/stocking/). In 2016, the state of Oregon employed 166 individuals at its 32 publically-owned hatcheries, who were responsible for producing nearly 47 million trout and salmon weighing 1,800 t [6]. In total, government hatcheries produced nearly 29,000 t of fish for recreational purposes in 2013, over half of which was rainbow trout (
Oncor-hynchus mykiss) [7]. Rainbow trout are one of the most widely stocked fish in
North America [8], and are typically produced at a size suitable for immediate harvest [9]. The economic benefits and impacts of hatchery-reared fish, particu-larly rainbow trout and other salmonid species, stocked into public fishing wa-ters can be considerable [10] [11] [12] [13].
The state of South Dakota owns and operates two hatcheries focused solely on trout and salmon production: Cleghorn Springs State Fish Hatchery in Rapid City and McNenny State Fish Hatchery near Spearfish. No trout or salmon are native to South Dakota [14], and natural reproduction is negligible except for brown trout (Salmo trutta) and brook trout (Salvelinus fontinalis) in selected streams in the Black Hills. Thus, hatchery rearing is essential to recreational fishing for trout and salmon in South Dakota. The stocking of hatchery-reared fish accounts for nearly all of the rainbow trout, and absolutely all of the Chi-nook salmon (Oncorhynchus tshawytscha), caught by anglers in South Dakota. From July 1, 2017 to June 30, 2018, 417,757 trout and salmon produced at Cleg-horn and McNenny State Fish Hatcheries were stocked into public fishing waters in South Dakota [15].
DOI: 10.4236/me.2019.106104 1583 Modern Economy The remainder of this paper is organized with the next section after this in-troduction describing the methods used for this study. After the methods, Sec-tion 3 describes the results, including the overall local economic impact of McNenny State Fish Hatchery and the return on budgetary expenditures in US dollars. Following the results, the final section compares and contrasts the re-sults with those from the few other studies examining the economic impact of other public fish hatcheries, and also discusses the significance of the results.
2. Methods
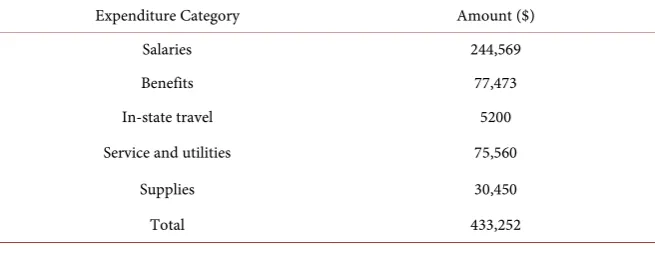
A combination of hatchery expenditure data and stocking data was used to eva-luate the local (within South Dakota) economic impact of fish production at McNenny State Fish Hatchery. The economic analysis used actual expenditure data for 2017, removing out-of-state expenditures. Included in the summation of local spending were the wages and benefits paid to permanent and temporary hatchery employees, supplies, fuel, equipment, and other materials purchased from South Dakota vendors, as well as utility costs and services provided by local contractors (Table 1). All of this data was considered local economic output, because spending was put back into South Dakota businesses and directly rein-vested into the local economy. Non-local expenditures which were excluded from the analysis included the costs of fish food, computer hardware, and spe-cialized scientific equipment procured from out-of-state vendors. In addition, any money spent on one-time, monetarily-large, construction projects was also excluded.
In addition to direct economic expenditures, all of the fish from the hatchery stocked in 2017 were included in the analysis. As a facility owned and operated by the State of South Dakota, and funded entirely from the sale of fishing li-censes and an excise tax on fishing equipment [17], all of the fish produced at McNenny State Fish Hatchery are stocked into public fishing waters within the state of South Dakota. Rainbow trout, brown trout, and Chinook salmon were stocked from McNenny Hatchery in 2017 at locations throughout the state.
[image:3.595.210.538.601.733.2]Using the values obtained by Johnson and Walsh [10], all of the trout stocked were assigned a base dollar value and adjusted to current Consumer Price Index (CPI) Standards [18] based on what an angler would be willing to pay for each
Table 1. McNenny State Fish Hatchery expenditure categories and amount spent in 2017.
Expenditure Category Amount ($)
Salaries 244,569
Benefits 77,473
In-state travel 5200
Service and utilities 75,560
Supplies 30,450
DOI: 10.4236/me.2019.106104 1584 Modern Economy fish. Because anglers are willing to pay more for larger fish [19], which White-head and Aiken [20] estimated at 3.5% more per cm increase in trout length greater than 23 cm, the inflated-adjusted base value was increased accordingly for fish at each stocking size.
Unlike the rainbow and brown trout which are stocked into public fishing waters to provide immediate recreation under the assumption that they will be caught relatively quickly [21] [22], Chinook salmon are stocked at a much smaller size and expected to grow for at least two years prior to being caught. For these stockings, the total economic value of the salmon fishery was deter-mined by multiplying the number of angler trips [23] by the average spending per trip [24]. This value was adjusted to current CPI standards and multiplied by the percentage of the total salmon raised and stocked from McNenny hatchery. This value was then divided by the total number of salmon stocked to create a per-fish value for the salmon. In addition to the per fish valuations, the value of the expenditures per day for anglers in the Black Hills National Forest of South Dakota ($74.93/day, and a total of 2,984,192 angler days per year) was multiplied by the percent share (66.67%) of the fish stocked from McNenny of all of the fish stocked in the Black Hills National Forest [25].
The total value of fish stocked by McNenny was calculated by adding the val-ues for each species and size of fish. The share of angler expenditures in the Black Hills attributed to the hatchery was then added to the total value of the fish stocked to produce the total economic impact. The economic impact per dollar spent by the hatchery was then determined by dividing the total economic im-pact by the annual budgetary expenditures of McNenny.
3. Results
[image:4.595.207.539.612.739.2]The economic value of the fish raised at McNenny State Fish Hatchery was cal-culated to be $6,609,576.03 (Table 2). When added to the estimated McNenny share of angler expenditures in the Black Hills National Forest, the total mone-tary impact of McNenny State Fish Hatchery operation and fish stocking was slightly more than $22 million (Table 3). Based on annual hatchery expendi-tures, McNenny operations generated $51.68 of economic output for every bud-getary dollar spent.
Table 2. Number, size, and species of fish stocked from McNenny State Fish Hatchery in
2017, along with base values (USD) per fish and fish size multipliers.
Species Size (cm) Number Multiplier Base Value ($) Total Value ($) Rainbow trout 28 28,809 2.50 5.60 161,272.78 Rainbow trout 31 24,809 3.75 6.85 169,892.03 Rainbow trout 41 25,000 8.75 11.85 296,200.00 Brown trout 26 12,692 1.00 4.10 52,011.82 Chinook salmon 9 32,000 1.00 185.29 5,929,200.00
DOI: 10.4236/me.2019.106104 1585 Modern Economy
Table 3. Economic impact (USD) of McNenny State Fish Hatchery fish production and
stocking on local South Dakota, USA, economies, along with the impact per budgetary dollar spent.
Category Value ($)
Fish stocked 6,609,576.63 Share of Black Hills angler expenditures 15,780,048.02
Total economic impact 22,388,624.65 Hatchery budgetary expenditures 433,252.00 Economic impact/budgetary dollar spent 51.68
4. Discussion
The economic output of $51.68 per budget dollar expenditure for McNenny Hatchery is relatively close to the inflation-adjusted (to 2018 USD) economic output of $47.94 calculated for hatcheries operated by the US Fish and Wildlife Service [13]. In contrast, economic effects ranging from $109 to $141 for each hatchery budget spent have been reported from hatcheries producing catcha-ble-sized trout in the more heavily populated southeastern portion of the United States [26]. The economic impact of McNenny Hatchery identified in this study confirms the substantial economic activity generated by the stocking of hat-chery-reared trout and salmon for recreational fishing identified across the United States [10] [11] [12] [27].
The local total economic impact of slightly more than $22 million by McNen-ny Hatchery occurred without the expenditure of aMcNen-ny South Dakota government general tax revenue [17]. This indicates that the current user-pay model, where-by anglers pay for hatchery operations where-by purchasing licenses and fishing equipment, is providing substantial benefits to the non-angling public. Direct spending on outdoor recreation and the associated indirect benefits are a sub-stantial component of the economy of South Dakota [28].
The economic impact from McNenny Hatchery operations is likely much greater than that reported in this study. Several large regular expenditures, such as fish food purchases, were excluded from the analysis because the manufactur-er was located outside of South Dakota. The impact of one-time, monetari-ly-large, irregularly-occurring, construction expenditures was also excluded. Last-ly, this study did not include the long-term economic impacts of hatchery re-search and innovation. Although somewhat difficult to quantify [29] [30] [31], the considerable and consistent year-to-year research output at McNenny likely produces substantial long-term economic benefits both within the local econo-my and well-beyond the borders of South Dakota [32] [33] [34].
DOI: 10.4236/me.2019.106104 1586 Modern Economy well as a large survey of anglers to determine more accurate values for willing-ness-to-pay per fish caught or for increases in fish size.
Acknowledgements
We thank Jill Voorhees and Nathan Huysman for their review of this manu-script and Robert Hanten for his assistance in obtaining information on the Chinook salmon program.
Conflicts of Interest
The authors declare no conflicts of interest regarding the publication of this pa-per.
References
[1] Bureau of Economic Analysis (BEA) (2018) Outdoor Recreation Satellite Account. https://www.bea.gov/news/2018/outdoor-recreation-satellite-account-updated-stati stics-2012-2016
[2] Outdoor Industry Association (OIA) (2018) Outdoor Participation Report.
https://outdoorindustry.org/resource/2018-outdoor-participation-report
[3] U.S. Fish and Wildlife Service and U.S. Census Bureau (USFWS and USCB) (2018) 2016 National Survey of Fishing, Hunting, and Wildlife-Associated Recreation. Publication FHW/16-Nat(RV). https://doi.org/10.3886/ICPSR08201
[4] Jackson, J.R., Boxrucker, J.C. and Willis, D.W. (2004) Trends in Agency Use of Propagated Fishes as a Management Tool in Inland Fisheries. American Fisheries Symposium, 44, 121-138.
[5] U.S. Fish and Wildlife Service (USFWS) (2019) Fish Production.
https://www.fws.gov/fisheries/nfhs/fish_production.html
[6] Chilton, G. (2017) Fish Propagation Annual Report for 2016. Fish Division, Oregon Department of Fish and Wildlife, Salem. https://doi.org/10.2172/963065
[7] United States Department of Agriculture (USDA) (2014) 2012 Census of Agricul-ture. Census of Aquaculture (2013), Volume 3, Part 2, AC-12-SS-2, Washington DC.
https://www.agcensus.usda.gov/Publications/2012/Online_Resources/Aquaculture/ aquacen.pdf
[8] MacCrimmon, H.R. (1971) World Distribution of Rainbow Trout (Salmo gairdne-ri). Journal of the Fisheries Research Board of Canada, 28, 663-704.
https://doi.org/10.1139/f71-098
[9] Kerr, S.J. and Lasenby, T.A. (2000) Rainbow Trout Stocking in Inland Lakes and Streams: An Annotated Bibliography and Literature Review. Fish and Wildlife Branch, Ontario Ministry of Natural Resources, Peterborough.
[10] Johnson, D.M. and Walsh, R.G. (1987) Economic Benefits and Costs of the Fish Stocking Program at Blue Mesa Reservoir, Colorado. Colorado Water Resources Research Institute, Fort Collins.
[11] Caudill, J. (2005) The Economic Effects of Rainbow Trout Stockings by Fish and Wildlife Service Hatcheries in FY 2004. U.S. Fish and Wildlife Service, Division of Economics, Arlington.
DOI: 10.4236/me.2019.106104 1587 Modern Economy Southeast Aquatic Resources Partership (SARP). U.S. Fish and Wildlife Service, Di-vision of Economics, Arlington.
[13] U.S. Fish and Wildlife Service (USFWS) (2006) Economic Effects of Rainbow Trout Production by the National Fish Hatchery System. USFWS, Atlanta.
[14] Barnes, M.E. (2007) Fish Hatcheries and Stocking Practices: Past and Present. In: Berry, C., Higgins, K., Willis, D. and Chipps, S., Eds., History of Fisheries and Fish-ing in South Dakota, South Dakota Department of Game, Fish and Parks, Pierre, 267-294.
[15] South Dakota Department of Game, Fish and Parks (SDGFP) (2018) Final Perfor-mance Report. F16AF00525/F-41-D-27, Pierre.
[16] South Dakota Department of Game, Fish and Parks (SDGFP) (2015) Strategic Plan 2016-2020, Pierre. https://gfp.sd.gov/userdocs/docs/strategic-plan-2.pdf
[17] South Dakota Department of Game, Fish and Parks (SDGFP) (2019) Division of Wildlife Budget Information, Pierre. https://gfp.sd.gov/budget
[18] Bureau of Labor Statistics (BLS) (2018) Bureau of Labor Statistics. https://doi.org/10.4135/9781412963947.n46
[19] Dalton, R.S., Bastian, C.T., Jacobs, J.J. and Wesche, T.A. (1998) Estimating the Economic Value of Improved Trout Fishing on Wyoming Streams. North American Journal of Fisheries Management, 18, 786-797.
https://doi.org/10.1577/1548-8675(1998)018<0786:ETEVOI>2.0.CO;2
[20] Whitehead, J.C. and Aiken, R. (2007) Temporal Reliability of Willingness to Pay from the National Survey of Fishing, Hunting and Wildlife-Associated Recreation. Applied Economics, 39, 777-786. https://doi.org/10.1080/00036840500438996 [21] Johnson, D.M., Behnke, R.J., Harpman, D.V. and Walsh, R.G. (1995) Economic
Benefits and Costs of Stocking Catchable Rainbow Trout: A Synthesis of Economic Analysis in Colorado. North American Journal of Fisheries Management, 15, 26-32. https://doi.org/10.1577/1548-8675(1995)015<0026:EBACOS>2.3.CO;2
[22] Barnes, M.E., Simpson, G. and Durben, D.J. (2009) Post-Stocking Harvest of Cat-chable-Sized Rainbow Trout Enhanced by Dietary Supplementation with a Fully Fermented Commercial Yeast Culture during Hatchery Rearing. North American Journal of Fisheries Management, 29, 1287-1295.
https://doi.org/10.1577/M08-218.1
[23] Johnson, B., Lott, J., Nelson-Stastny, W. and Riis, J. (1997) Annual Fish Population and Sport Fish Harvest Surveys on Lake Oahe, South Dakota 1996. Annual Report 97-15, South Dakota Department of Game, Fish and Parks, Pierre.
[24] U.S. Fish and Wildlife Service and U.S. Census Bureau (USFWS and USBC) (1997) 1996 National Survey of Fishing, Hunting, and Wildlife-Associated Recreation. Washington DC. https://doi.org/10.3886/ICPSR34641
[25] American Sportfishing Association (ASA) (2007) State and National Economic Ef-fects of Fishing, Hunting and Wildlife-Related Recreation on U.S. Forest Ser-vice-Managed Lands. https://doi.org/10.3886/ICPSR34641
[26] U.S. Fish and Wildlife Service (USFWS) (2001) Economic Effects of Trout Produc-tion by NaProduc-tional Fish Hatcheries in the Southeast. USFWS, Atlanta.
[27] Charbonneau, J.J. and Caudill, J. (2010) Conserving America’s Fisheries. An As-sessment of Economic Contributions from Fisheries and Aquatic Resource Conser-vation. U.S. Fish and Wildlife Service, Division of Economics, Arlington.
https://www.fws.gov/home/feature/2011/pdf/fisherieseconomicreport.pdf
DOI: 10.4236/me.2019.106104 1588 Modern Economy
https://sdvisit.com/sites/default/files/2018-06/17EcoImp_Tourism_Economics.pdf
[29] Griliches, Z. (1979) Issues in Assessing the Contribution of Research and Develop-ment to Productivity Growth. Bell Journal of Economics, 10, 92-116.
https://doi.org/10.2307/3003321
[30] Williams, D. and Rank, A.D. (1998) Measuring the Economic Benefits of Research and Development: The Current State of the Art. Research Evaluation, 7, 17-30. https://doi.org/10.1093/rev/7.1.17
[31] Bessette, R.W. (2003) Measuring the Economic Impact of University-Based Re-search. Journal of Technology Transfer, 28, 355-361.
https://doi.org/10.1023/A:1024917601088
[32] Evenson, R.E. (2001) Economic Impacts of Agricultural Research and Extension. In: Gardner, B.L. and Rausser, G.C., Eds., Handbook of Agricultural Economics, Vol. 1, Elsevier, Amsterdam, 573-628. https://doi.org/10.1016/S1574-0072(01)10014-9 [33] Salter, A.J. and Martin, B.R. (2001) The Economic Benefits of Publicly Funded Basic
Research: A Critical Review. Research Policy, 30, 509-532. https://doi.org/10.1016/S0048-7333(00)00091-3