ISSN Online: 1949-5005 ISSN Print: 1949-4998
DOI: 10.4236/health.2019.116064 Jun. 25, 2019 792 Health
An Analysis of the Effects of Blood Pressure and
Antihypertensive Drugs on Heart Disease
Kazumitsu Nawata
1,2, Hayato Sugano
1, Moriyo Kimura
31Graduate School of Engineering, University of Tokyo, Tokyo, Japan
2Research Institute of Economy, Trade and Industry (RIETI), Tokyo, Japan
3The Public Health Institute, Tokyo, Japan
Abstract
Background: The American College of Cardiology (ACC), American Heart Association (AHA) and other organizations announced a new hypertension guideline (2017 ACA/AHA Guideline) in November 2017. However, other organizations such as the European Society of Cardiology and European So-ciety of Hypertension maintained their diagnostic thresholds. It is necessary to evaluate the effects of blood pressure (BP) and antihypertensive drugs on the probability of having heart disease (HD). Data and Methods: The effects of BP, antihypertensive drugs and other factors on the probability of under-going HD treatment were analyzed. We used a dataset containing 83,287 medical check-up and treatment records obtained from 35,504 individuals in 5 fiscal years. The probit models were used in the study. Considering the pos-sibility of endogeneity problems, different types of models were used. Results: We could not find evidence that a higher systolic BP increased the probability of undergoing HD treatment. However, diastolic BP increased the probability in most of the models. Taking antihypertensive drugs also increased the probability of undergoing HD treatment. Diabetes was another important risk factor. Conclusion: The results of this study did not support the new 2017 ACC/AHA Guideline. It is necessary to choose proper drugs and methods to reduce the risks of side effects. Limitations: The dataset was observatory, the data were obtained from just one medical society, and sample selection bias might exist.
Keywords
Heart Disease, 2017 ACC/AHA Hypertension Guideline, Hypertension, Blood Pressure, Antihypertensive Drug, Diabetes
How to cite this paper: Nawata, K., Suga-no, H. and Kimura, M. (2019) An Analysis of the Effects of Blood Pressure and Anti-hypertensive Drugs on Heart Disease. Health, 11, 792-816.
https://doi.org/10.4236/health.2019.116064
Received: May 26, 2019 Accepted: June 22, 2019 Published: June 25, 2019
Copyright © 2019 by author(s) and Scientific Research Publishing Inc. This work is licensed under the Creative Commons Attribution International License (CC BY 4.0).
http://creativecommons.org/licenses/by/4.0/
DOI: 10.4236/health.2019.116064 793 Health
1. Introduction
High blood pressure (BP) or hypertension is considered one of the most
impor-tant health risk factors. The World Health Organization (WHO) [1] mentioned
that “Worldwide, raised blood pressure is estimated to cause 7.5 million deaths, about 12.8% of the total of all deaths. This accounts for 57 million disability ad-justed life years (DALYS) or 3.7% of total DALYS. Raised blood pressure is a major risk factor for coronary heart disease and ischemic as well as hemorrhagic
stroke”. WHO and the International Society of Hypertension (ISH) [2]
esti-mated that hypertension is estiesti-mated to cause 4.5% of the current global disease
burden. Gaziano et al. [3] also estimated that the global cost of suboptimal BP
was $370 billion ($ refers to US $) in 2001. More recently, the cost of
hyperten-sion in the United States became $51.2 billion per year in 2012-2013 [4] [5]. The
Centers for Disease Control and Prevention [6] also estimated that the cost of
hypertension was $48.6 billion. In Japan, the medical expenditure on
hyperten-sion was 1.8 trillion yen in fiscal year 2016 [7], and it is considered a very
im-portant disease. Furthermore, it has been reported that hypertension reduces
quality of life [8] [9] and it has been suggested that the real cost of hypertension
including indirect costs might be higher.
The distribution of BP is continuous, and several criteria of hypertension were
proposed. For example, the Japanese Society of Hypertension (JSH) [10] and the
Blood Pressure Association of United Kingdom [11] diagnosed hypertension if
the systolic BP (SBP) was 140 mmHg or more or the diastolic BP (DBP) was 90 mmHg or over (hereafter, 140/90). The National Heart, Lung and Blood
Insti-tute of the United States [12] classified hypertension into Stage 1 (SBP of 140 -
159 mmHg; DBP of 90 - 99 mmHg) and Stage 2 (SBP of 160 mmHg or over;
DBP of 100 mmHg or over). WHO and ISH [13] classified hypertension into
the following three categories: Grade 1 (mild), SBP of 140 - 159 mmHg or DBP of 90 - 99 mmHg; Grade 2 (moderate), SBP of 160 - 179 mmHg or DBP of 100 - 109 mmHg; and Grade 3 (severe), SBP of 180 mmHg or over or DBP of 110 mmHg or over. They predicted the probability of serious cardiovascular disease (CVD) in the next 10 years based on BP and other risk factors. The probabilities were 20% - 30% and 30% or more in the high- and very-high-risk groups, re-spectively.
In November, 2017, the American College of Cardiology (ACC), American Heart Association (AHA), and nine other organizations presented the “2017 ACC/AHA/AAPA/ABC/ACPM/AGS/APhA/ASH/ASPC/NMA/PCNA Guideline for the Prevention, Detection, Evaluation, and Management of High Blood
Pressure in Adults” [14] (hereafter the 2017 ACC/AHA Guideline). In the 2017
DOI: 10.4236/health.2019.116064 794 Health
the previous 160/100 mmHg criterion [15] [16]. They also declared that
numer-ous innovations and modifications to the guidelines were implemented
begin-ning in 2017 [17]. This is the first major revision since the “Seventh report of the
joint national committee on prevention, detection, evaluation, and treatment of
high blood pressure (JNC 7)” in 2003 [16] [18] [19]. The 2017ACC/AHA
Guide-line is an official policy of the ACC/AHA, and it targets treatments in the United States; however, it will likely have an effect throughout the world, as noted in the
guideline itself [14].
Khera etal.[20] estimated that 63% and 55% of the populations in the 45-to
75-year-old age groups would be considered to have hypertension in the Unites States and China with the adoption of the 2017 ACC/AAHA Guideline,
respec-tively. Chung etal.[21] reported that the national weighted prevalence rates of
brachial hypertension according to the 2017 guideline would be 40.7% in men and 30.7% in women, increasing by 18.8% and 9.4% in men and women, respec-tively, from that determined according to the previous criterion in Taiwan.
Marchesan and Spritzer [22] reported that the prevalence of systemic arterial
hypertension among women with polycystic ovary syndrome was 65% according to the 2017 ACC/AHA Guideline and 26.6% according to the JNC7 criterion.
On the other hand, the European Society of Cardiology and the European
So-ciety of Hypertension (ESC/ESH) [23], Hypertension Canada [24] [25] and the
American Diabetes Association [26] maintained the diagnostic threshold of
140/90 mmHg for the general public in their 2018 guidelines. The Japanese So-ciety of Hypertension (JSH) has been revising the 2014 Guidelines for the Man-agement of Hypertension (JSH 2014 Guideline), and in their 2019 guideline de-clared that “We will not change the definition or category of hypertension be-cause we think it appropriate to define hypertension as the level of BP at which the benefits of treatment unequivocally outweigh risks of treatment in the line of
ESC/ESH guidelines” [27]. Moreover, the American Academy of Family
Physi-cians (AAFP) [28], an organization that initially adopted the 2017 ACC/AHA
Guideline, declared that they would not follow the 2017 ACC/AHA Guideline and would use the previous guideline. The AAFP explained that systematic re-views of the new guideline had not been done, that the prevalence of hyperten-sion among US adults would increase from 32% to 46%, and that substantial weight had been given to the Systolic Blood Pressure Intervention Trial (SPRINT)
[29] but that other trials were minimized.
DOI: 10.4236/health.2019.116064 795 Health
2. Reviews of Previous Studies
Many studies of the relationships between BP and health conditions have been
done, including the well-known, long-term Framingham Heart Study (FHS) [30],
which has been continuously conducted by Boston University and the National Heart, Lung, & Blood Institute since 1948 in Framingham, Massachusetts. As the initial cohort, 5209 males and females aged 30 - 62 without clear signs or symp-toms of HD were chosen. The study has found that male sex, age, cholesterol, SBP and diabetes are prediction factors of CVD over the course of 30 years.
The SPRINT [29], weighted heavily in the 2017ACC/AHA Guideline, was a
trial in which 9361 persons with SBP of 130 mmHg or higher and an increased CVD risk, but without diabetes, were randomly assigned into two groups. One group was the intensive treatment group of 4678 persons with an SBP target less than 120 mmHg and the other was the standard treatment group of 4683 per-sons. The enrollment period ran from November 2010 to March 2013, and the trial was terminated earlier than the planned period. The median follow-up pe-riod on August 20, 2015 was 3.26 years, and the planned average pepe-riod was 5 years. The trial found lower rates of fatal and nonfatal major cardiovascular events and of death from any cause. In the trial, lifestyle modifications were en-couraged. The average numbers of BP medications given to participants were 2.8 and 1.8, and the mean SBP values were 121.5 and 134.6 mmHg in the intensive treatment and standard treatment groups, respectively. However, the SPRINT was not a blinded, randomized clinical trial. The participants and doctors (or researchers) could easily know which groups the participants belonged to.
Therefore, we could not deny effects similar to the placebo effect [31] [32]. The
rates of death from any cause were similar for the first two years, and the num-ber of participants decreased after 3 years or more. Lowering BP with medica-tions may cause adverse effects. The SPRINT research group themselves
admit-ted that [29] “acute kidney injury, … were higher in the intensive-treatment
group than in the standard-treatment group”. With regard to SPRINT, also see
Leung etal.[33].
SPRINT used the same method used by the Action to Cardiovascular Risk in
Diabetes (ACCORD) Study Group [34]. The ACCORD study involved 4733
persons with type 2 diabetes. The ACCORD study reported that lowering the SBP below 120 mmHg did not reduce the major CVD or death rates compared to the cases in which the SBP was lowered below 140 mmHg.
The Prospective Studies Collaboration [35] performed a meta-analysis using
individual data for one million adults obtained from the results of 61 prospective studies. In this study, they analyzed 12.7 million person-years and reported 56,000 vascular mortalities including 12,000 due to stroke and 34,000 due to ischemic HD (IHD). They also reported that deaths due to IHD increased as SBP and DBP increased in all age cohorts (from 40 - 49 to 80 - 89).
Ettehad etal.[36] performed a meta-analysis using 123 studies selected from
DOI: 10.4236/health.2019.116064 796 Health
The total number of individuals included in the analysis was 613,815. They re-ported that treatments for lowering BP significantly reduced the major CVD risk and that lowering SBP by 10 mmHg reduced mortality rates from all causes by 13%.
Joffres etal.[37] analyzed BP using Canadian (Canadian Heart Health Survey
(CHHS)) and US (NHANESIII) data. These data included 23,111 observations in Canada and 15,326 in the United States. They reported similar trends con-cerning age in both datasets, with prevalence rates of diabetes in the age range of 10 - 74 of 20.1% in the NHANES and 21.1% in the CHHS, and about half of di-abetes patients had hypertension and were managed poorly.
Rapsomaniki et al. [38] did an analysis of 2.25 million people from 1977 to
2010 using CALIBAR (CArdiovascular research using LInked Bespoke studies and Electronic health Records). In the analysis, CVD was observed for the first time in 83,098 cases. They concluded that the lifetime risks of CVD for hyper-tensive individuals at age 30 would be 63.3% compared to 46.1% for normoten-sive individuals and that hypertennormoten-sive individuals would exhibit CVD 5 years earlier than normotensive individuals.
Muntner etal.[39] used data from the 2011-2012 and 2013-2014 cycles of the
National Health and Nutrition Examination Survey (NHANES) and analyzed 10,907 adult patients. They declared that the 2017 ACC/AHA Guideline would increase the use of hypertension drugs and lower the prevalence of CVD events. However, in their analysis, while some characteristics of the patients were
con-sidered, “obesity” was not. Ihum etal. [40] discussed the issues, particularly the
optimal target BP, from an Asian perspective.
In Japan, a survey of “Nippon Data 2010” [41] performed using funds from
the Ministry of Health, Labor and Welfare was done. In this survey, the BP levels of 2891 participants were recorded and the average SBP levels were 137.4 for males and 130.8 mmHg for females. In a national survey, SBP has been declining for 50 years for all ages and genders. However, for DBP, the same trend was
ob-served for females but not males [42]. Fujiyoshi etal. [43] analyzed the relation
between BP and CVD using a dataset of 63,309 individuals by cohorts based on age and gender. They reported 1944 CVD mortalities in 10.2 years and a positive
relation between CVD and BP. Asayama et al.[44] analyzed the mortality risk
due to CVD of 39,705 participants (the median follow-up period was 10.0 years) of 6 cohorts that satisfied necessary conditions from among 13 cohorts that were part of EPOCH-JAPAN. They reported that in individuals without treatment, the risk of CVD mortality became higher even if the effects of age, body mass index (BMI), anamnesis of CVD, diabetes, total cholesterol, smoking, and be-longing cohorts were considered in the Cox proportional hazard model. Howev-er, a clear relation between the hypertension stages and CVD mortality risk was not observed for males undergoing hypertension treatment.
epide-DOI: 10.4236/health.2019.116064 797 Health
miological survey (Kugayama Study) for residents of the town of Kugayama
(population about 8400) in Fukuoka Prefecture since 1961, for over 50 years [45].
Honda etal. [46] analyzed 2462 residents aged 40 - 84 for 24 years using the Cox
proportional hazard model. They reported age, gender, SBP, hemoglobin A1c (HbA1c) low-density lipoprotein cholesterol (LDL), high-density lipoprotein cholesterol (HDL), smoking, and daily exercise as prediction factors of CVD.
Most studies mentioned that a higher SBP made the risk of CVD higher. However, questions have arisen about the results of previous studies, as pointed
out by Nawata, Sekizawa, and Kimura [47]. Biases such as publication, conflict
of interest, and termination (or endpoint) biases might exist in these studies. The selection criteria of the studies might also be problematic for meta-analysis. Although the selection criteria should have been determined before the studies were done, they were in fact determined after the studies ended, which might cause another type of bias. For the cohort studies, the effects of individual cha-racteristics other than BP could not be removed if the cohort interval was too large. For example, 10-year (or longer) age cohort intervals were often used.
Nawata etal.[48] found that SBP increased by about 5 mmHg with 10 years of
increased age, and thus the 10-year age cohort interval might have been too large. Sample-selection biases and the selection of explanatory variables were other
important problems to be properly treated [49].
More recently, Nawata and Kimura [49] [50] analyzed the total annual
medi-cal expenditures and results of BP measured using the power transformation Tobit models for a dataset containing 175,123 cases obtained from 88,211 indi-viduals. They found that the medical expenditure declined as SBP increased. Al-though their target was the medical expenditure which represented the overall health conditions and not only CVD, the results were the opposite of those of
most studies. Nawata and Kimura [50] also analyzed if individuals had CVD/HD
as anamnesis by the probit model. They found a negative relationship between SBP and having CVD/HD in the anamnesis. The problem of the study is that they considered anamnesis obtained from inquiries done at medical checkups, which means that the individuals might not have had CVD/HD at the time of the medical checkups and that the information might not be correct because the information relied on the memories of individuals.
3. Data and Methods
3.1. Data
Japan has a public health insurance system that requires all citizens to belong to some type of public health insurance organization. Most employees 40 years of
age or older are required to undergo medical checkups once a year by law [51],
DOI: 10.4236/health.2019.116064 798 Health
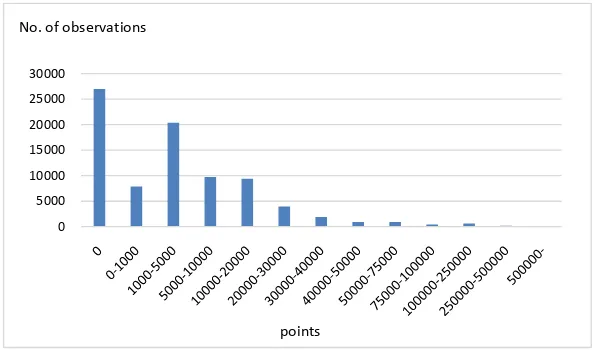
monthly reports of all medical treatments and payments sent from medical in-stitutes to the health insurance societies are called “receipts”. We used a dataset containing 83,287 observations obtained from 35,504 individuals for which both the results of medical checkups and receipts were available in the same fiscal year. (The Japanese fiscal year starts in April and ends in March of the next year.) The sample period was from April 2011 to December 2014 and from April 2015 to February 2017. Unfortunately, we could not obtain the data for fiscal year 2013. Receipts were classified into five categories: dental; inpatients of DPC hos-pitals; outpatients and inpatients of non-DPC hoshos-pitals; and pharmacies. Of these, we used the sum of DPC, outpatient & non-DPC hospital, and pharmacy receipts as the medical expenditures. The medical expenditures are measured by
points in Japan. Ten yen per points are paid to medical institutes. Figure 1
shows the distribution of medical expenditures. The distribution is skewed and has a very heavy tail on the right side. A total of 32.4% of all observations of medical expenditures are zero. On the other hand, 1.0%, 0.3%, and 0.1% used more than 100,000, 250,000 and 500,000 points, and their medical expenditures accounted for 26.3%, 13.7% and 6.0% of total medical expenditures.
Under the 140/90 criterion, 20.7% were diagnosed with hypertension. Under the 2017 ACC/AHA Guideline of 130/80, this value jumps up to 49.0%, about a half of observations, suggesting the effect of changing the criterion is quite large. The definitions of CVD/HD were not very clear and might not have been the same as in previous studies. To avoid ambiguity in the definitions, the diseases classified as HD were chosen according to the classification of the Ministry of
Health, Labour and Welfare [52], which is based on the International Disease
Classification 10th Revision (ICD 10) of WHO [53]. HD selected in this paper
[image:7.595.225.524.529.704.2]included: acute rheumatic fever, chronic rheumatic HD, hypertensive HD, ischemic HD, pulmonary HD, diseases of pulmonary circulation, and other forms of HD. Among 83,287 observations, 5942, or 7.1%, were for individuals undergoing HD treatments.
Figure 1. Distribution of medical expenditures.
0 5000 10000 15000 20000 25000 30000
No. of observations
DOI: 10.4236/health.2019.116064 799 Health
3.2. Probit Model
In many studies, including SPRINT, the Cox proportional hazard method [54] is
used. However, Cox’s method is improper when time-dependent or time-varying covariates are included, as shown in Appendix A. Therefore, we used the probit
model. Let HDit be a dummy variable taking 1 if an individual was undergoing
HD treatment in fiscal year t and 0 otherwise. The basic model is given by
*
it it it
Y =x′
β
+u (1)1 it
HD = if * 0
it
Y > and
0 it
HD = if * 0
it
Y ≤ , and
(
)
P(
* 0)
(
)
P HDit = =1 Yit > = Φ xit′β
where P
(
HDit =1)
is the probability that HDit =1, xit is a vector ofcova-riates, uit follows the standard normal distribution, and Φ is the distribution
function of the standard normal distribution. *
it
Y is a latent variable, and only
its sign is observable.
4. Models and Covariates
4.1. Covariates Used in the Analysis
We considered several different models, and the covariates used in this study
[image:8.595.206.538.445.741.2]were as follows (Table 1):
Table 1. Covariates used in the estimation.
Variable Variable
Age Eat_fast (0: eating faster than other people; 1: normal; 2: slower)
Female (1: if female; 0: otherwise) Late_supper (1: eating supper within two hours before bedtime three times or more in a week; 0: otherwise)
Height (cm) After_supper (1: eating snacks after supper three times or more in a week, 0: otherwise)
BMI (Body Mass Index) =
weight(Kg)/height(m)2 No_breakfast (1: not eating breakfast three times or more in a week; 0: otherwise)
SBP (mmHg) Exercise (1: doing exercise for 30 minutes or more twice or more in a week for more than a year; 0: otherwise)
DBP (mmHg) Daily_activity (1: doing physical activities (walking or equivalent) for one hour or more daily, 0: otherwise),
HDL (high-density lipoprotein
cholesterol, mg/dL) Speed (1: walking faster than other people of a similar age and the same gender; 0: otherwise) LDL (low-density lipoprotein
cholesterol, mg/dL) Smoke (1: smoking; 0: otherwise)
DOI: 10.4236/health.2019.116064 800 Health Continued
GGP (γ-glutamyl transferase, units per liter: U/L)
Alcohol_amount (0: not drinking; 1: drinking less than 180 ml of Japanese sake wine (with an alcohol percentage of about 15%) or equivalent alcohol in a day when drinking; 2: drinking 180 - 360 ml; 3: drinking 360 - 540 ml; 4: drinking 540 ml or more)
AST (aspartate aminotransferase, U/L) Sleep (1: sleeping well; 0: otherwise), Diabetes (getting diabetes treatments; 0: otherwise)
ALT (alanine aminotransferase, U/L) Diabetes (getting diabetes treatments; 0: otherwise)
Blood_sugar (mg/dL) Antihypertensive (1: taking antihypertensive drugs, 0: otherwise)
Urine_sugar (integers of 1 - 5, sugar in urine increasing with number; 1 is
normal, 5 is worst) F_year11 (1: fiscal year 2011; 0: otherwise) Urine_protein (same as Urine_sugar) F_year12 (1: fiscal year 2012; 0: otherwise) HbA1c (hemoglobin A1c, %) F_year14 (1: fiscal year 2014; 0: otherwise) Weight_20 (weight increased by 10 kg or
more from age 20) F_year15 (1: fiscal year 15; 0: otherwise)
Weight_1 (weight changed by 3 kg or more in a year)
Age, Female and Height represent basic individual characteristics; BMI represents obesity; while HDL, LDL, and Triglyceride represent the lipid
con-centration in the blood [55]. If the lipid concentration is abnormal, an individual
is diagnosed with dyslipidemia, and dyslipidemia is currently mainly hyperlipi-demia, in which the lipid concentration is too high. Although our bodies need
lipids to build cells, an excess of lipids could be a problem [56]. LDL and HDL
cholesterol levels are classified as “bad” and “good” [57] [58]. GGP, AST and
ALT are mainly related to liver functions; Blood_sugar, HbA1c and Urine_sugar are important indicators of diabetes; and Urine_protein represents the condition
of the kidneys [59]. The Antihypertensive covariate evaluates the effects of
anti-hypertensive drugs.
4.2. Estimated Models
We first estimated the relation between undergoing HD treatment and the val-ues of the covariates in the same fiscal year. Since taking antihypertensive drugs obviously affects the values of SBP and DBP, we considered two models given by:
Model A:
1 2 3 4 5 6
7 8 9 10 11
12 13 14 15
16 17 18
19 20 21
* Age Female Height BMI SBP
DBP HDL LDL Triglyceride GGP
AST ALT Blood_sugar HbA1c
Urine_sugar Urine_protein Weight_20
Weight_1 Eat_fast Late_
it
Y β β β β β β
β β β β β
β β β β
β β β
β β β
= + + + + +
+ + + + +
+ + + +
+ + +
DOI: 10.4236/health.2019.116064 801 Health
22 23 24
25 26 27
28 29 30
31 32 33
34 35 1
After_supper No_breakfast Exercise
Daily_activity Walk_fast Smoke
Alcohol_freq Alcohol_amount Sleep
Diabetes F_year11 F_year12
F_year14 F_year15 uit
β β β
β β β
β β β
β β β
β β + + + + + + + + + + + + + + + (2) Model B:
1 2 3 4 5 6
7 8 9 10 11
12 13 14 15
16 17 18
19 20 21
* Age Female Height BMI SBP
DBP HDL LDL Triglyceride GGP
AST ALT Blood_sugar HbA1c
Urine_sugar Urine_protein Weight_20
Weight_1 Eat_fast Late_
it
Y β β β β β β
β β β β β
β β β β
β β β
β β β
= + + + + +
+ + + + +
+ + + +
+ + +
+ + + supper
22 23 24
25 26 27
28 29 30
31 32 33
36
34 35
After_supper No_breakfast Exercise
Daily_activity Walk_fast Smoke
Alcohol_freq Alcohol_amount Sleep
Diabetes F_year11 F_year12
F_year14 F_year15 Antihyper
β β β
β β β
β β β
β β β
β β β
+ + +
+ + +
+ + +
+ + +
+ + + tensive+u2it
(3)
Model A does not include Antihypertensive, and Model B includes Antihy-pertensive. Excluding observations with missing covariate values, we used 73,471
observations (HDit =1: 5301, and HDit =0: 68,710) for the estimation of the
model. A summary of the covariates is given in Table 2. Hereafter we refer to
[image:10.595.207.540.435.731.2]Model A and Model B as HD models.
Table 2. Summary of covariates.
Variable Average SD Variable
Age 50.2 9.0 Weight_20 1:40.7%; 0:59.3%
Female 1:32.5%; 0:67.5% Weight _1 1:29.8%; 0:70.2%
Height 165.1 8.5 Exercise 0:30.0%; 1:60.9%; 2:9.1%
BMI 23.1 3.8 Daily_activity 1:41.6%; 0:58.4%
SBP 123.6 18.2 Speed 1:13.5%; 0:86.5%
DBP 76.2 12.5 Eat_fast 1:29.2%; 0:70.8%
HDL 61.6 16.7 Late_supper 1:24.8%; 0:75.2%
LDL 125.0 33.0 After_supper 1:38.6%; 0:61.4%
Triglyceride 123.7 107.7 No_breakfast 1:43.3%, 0:56.7%
GTP 44.6 56.1 Smoke 1:41.8%, 0:58.2%
ATL 24.8 20.3 Drink_freq 0:26.2%; 1:35.9%; 2:37.9%
AST 23.9 23.1 Drink_amount 0:37.9%; 1:19.6%; 2:24.9%; 3:13.1%; 4:4.5%
Blood_sugar 81.7 40.6 Sleep 1:56.5%; 0:43.5%
DOI: 10.4236/health.2019.116064 802 Health Continued
Urine_sugar 1:96.1%; 2:0.6%; 3:1.0%; 4:0.8%; 5:1.4% Antihypertension 1:14.2%; 0:85.8%
Urine_protein 1:91.8%; 2:4.5%; 3:2.6%; 4:0.8%; 5: 0.3% Fiscal year 11:18.9%, 12: 26.5%; 14: 18.7%; 15: 21.3%; 16: 14.5%
SD: Standard Deviation.
Antihypertensive drugs might be used for the HD treatment. In such cases, Antihypertensive might be an endogenous variable, and we cannot use the stan-dard method for estimation of the model. Hence, we considered the following
models for those who did not undergo HD treatment at time t and for whom we
could get information regarding the HD treatment at time t + 1.
Model C:
1 2 3 4 5 6
7 8 9 10 11
12 13 14 15
16 17 18
1 *
1
9 20 21
Age Female Height BMI SBP
DBP HDL LDL Triglyceride GGP
AST ALT Blood_sugar HbA1c
Urine_sugar Urine_protein Weight_20
Weight_1 Eat_fast Lat
it
Y β β β β β β
β β β β β
β β β β
β β β
β β β
+ = + + + + +
+ + + + +
+ + + +
+ + +
+ + + e_supper
22 23 24
25 26 27
28 29 30
31 32 33
3 1
34 35
After_supper No_breakfast Exercise
Daily_activity Walk_fast Smoke
Alcohol_freq Alcohol_amount Sleep
Diabetes F_year11 F_year12
F_year14 F_year15 uit
β β β
β β β
β β β
β β β
β β +
+ + + + + + + + + + + + + + + (4) Model D:
1 2 3 4 5 6
7 8 9 10 11
12 13 14 15
16 17 18
1 *
1
9 20 21
Age Female Height BMI SBP
DBP HDL LDL Triglyceride GGP
AST ALT Blood_sugar HbA1c
Urine_sugar Urine_protein Weight_20
Weight_1 Eat_fast Lat
it
Y β β β β β β
β β β β β
β β β β
β β β
β β β
+ = + + + + +
+ + + + +
+ + + +
+ + +
+ + + e_supper
22 23 24
25 26 27
28 29 30
31 32 33
36
34 35
After_supper No_breakfast Exercise
Daily_activity Walk_fast Smoke
Alcohol_freq Alcohol_amount Sleep
Diabetes F_year11 F_year12
F_year14 F_year15 Antihyper
β β β
β β β
β β β
β β β
β β β
+ + +
+ + +
+ + +
+ + +
+ + + tensive+u4 1it+
(5)
* 1 it
Y+ is a variable observed at t + 1. On the other hand, the covariates on the
right-hand side are measured at the previous fiscal t. (To avoid unnecessary
complications, we eliminated the subscript t for covariates on the right-hand
side of the equations. Since the data for fiscal year 2013 were not available, the
2014 and 2012 data are used for t + 1 and t when t = 2012.) Since individuals did
not undergo HD treatment in fiscal year t, we can void the endogeneity problem.
Hereafter we refer to Model C and Model D as the predicting HD models. A
DOI: 10.4236/health.2019.116064 803 Health
observed; 34,947 were (HDti=0, HDt i+1 =0 ) and 1469 were (HDti =0,
1 1
t i
HD+ = ).
4.3. Results of Estimation
Table 3 shows the estimation results of Model A and Model B. A positive esti-mate value means that the variable increases the probability of undergoing HD treatment. In these models, undergoing HD treatment and the covariates were measured in the same fiscal year, and the values of the covariates might have been affected by the HD treatment. The estimates of variables other than Anti-hypertensive were similar in both models. For BP variables, the estimates of SBP were negative in both models and significant at the 1% level in Model B. The es-timates of DBP were positive and significant at the 1% level in both models. This means that the probability of undergoing HD treatment became significantly higher as DBP becomes higher, but this is not true for SBP. Antihypertensive was positive and significant at the 1% level in Model B. For non-BP variables, the estimates of Age, BMI, DBP, Weight_1, Urine_protein, Weight_1 and Diabetes and the fiscal year dummies were positive and significant at the 1% level in both models. The estimates of Female were positive and significant at least at the 5% level in both models. The estimates of AST and Drink_amount were positive in both models and significant at the 5% level in one model. The estimates of LDL, Speed, Smoke, and Drink_freq were negative and significant at the 1% level in both models. The estimates of HDL, ATL and Urine_sugar were negative and significant (at least) at the 5% level in both models. The estimates of No_breakfast were negative in both and significant at the 5% level in Model B. The estimates of other covariates were not significant in Model A and Model B.
The results of Model C and Model D are given in Table 4. In these models,
undergoing HD treatment was measured at t + 1 (i.e., HDit+1), and all covariates
were measured at (the previous year) t. Moreover, we selected individuals who
were not undergoing HD treatment at t (i.e., HDit =0). Therefore, all covariates
were free from the endogeneity problem. Since the number of observations
be-came smaller (total: 36,416, HDt i+1 =0: 34,947 and HDt i+1 =1: 1469), the
DOI: 10.4236/health.2019.116064 804 Health Table 3. Results of estimation (Model A and Model D).
Model A Model B
Variable Estimate SE t-value Variable Estimate SE t-value
Constant −3.7596 0.2743 −13.70** Constant −3.3273 0.2793 −11.91**
Age 0.0269 0.0010 27.35** Age 0.0193 0.0010 18.77**
Female 0.0579 0.0268 2.164* Female 0.0725 0.0272 2.668**
Height 0.0012 0.0014 0.902 Height 0.0023 0.0014 1.647
BMI 0.0210 0.0026 8.027** BMI 0.0089 0.0027 3.289**
SBP −0.0012 0.0007 −1.633 SBP −0.0024 0.0007 −3.365**
DBP 0.0041 0.0010 3.975** DBP 0.0042 0.0011 4.006**
HDL −0.0019 0.0006 −3.211** HDL −0.0014 0.0006 −2.330*
LDL −0.0030 0.0003 −11.99** LDL −0.0021 0.0003 −8.183**
Triglyceride 0.00004 0.0001 0.462 Triglyceride 0.00004 0.0001 0.395
GTP 0.00004 0.0002 −0.276 GTP −0.0001 0.0002 −0.577
ATL −0.0012 0.0006 −2.025* ATL −0.0017 0.0006 −2.846**
AST 0.0006 0.0004 1.780 AST 0.0009 0.0004 2.379*
Blood_sugar 0.0003 0.0002 1.383 Blood_sugar 0.0002 0.0002 1.153
HbA1c −0.0039 0.0067 −0.580 HbA1c −0.0083 0.0068 −1.230
Urine_sugar −0.0386 0.0120 −3.211** Urine_sugar −0.0273 0.0122 −2.236* Urine_protein 0.0881 0.0130 6.793** Urine_protein 0.0608 0.0133 4.591**
Weight_20 −0.0195 0.0190 −1.025 Weight_20 −0.0288 0.0193 −1.489
Weight_1 0.0929 0.0175 5.301** Weight_1 0.0913 0.0178 5.122**
Exercise −0.0235 0.0194 −1.213 Exercise −0.0170 0.0197 −0.864
Daily_activity 0.0053 0.0173 0.303 Daily_activity 0.0060 0.0176 0.342
Speed −0.0815 0.0163 −4.992** Speed −0.0735 0.0166 −4.426**
Eat_fast −0.0054 0.0135 −0.398 Eat_fast −0.0039 0.0137 −0.283
Late_supper −0.0077 0.0172 −0.448 Late_supper −0.0121 0.0175 −0.696 After_supper −0.0102 0.0236 −0.431 After_supper 0.0116 0.0239 0.484 No_breakfast −0.0496 0.0192 −2.592** No_breakfast −0.0334 0.0195 −1.710
Smoke −0.0891 0.0176 −5.070** Smoke −0.0756 0.0179 −4.226**
Drink_freq −0.0510 0.0152 −3.363** Drink_freq −0.0792 0.0155 −5.094** Drink_amount 0.0236 0.0106 2.235* Drink_amount 0.0185 0.0108 1.710
Sleep −0.0447 0.0159 −2.805** Sleep −0.0514 0.0162 −3.168**
Diabetes 0.9750 0.0178 54.66** Diabetes 0.8473 0.0185 45.74**
F_year11 0.2528 0.0424 5.958** F_year11 0.2713 0.0433 6.263**
F_year12 0.2526 0.0396 6.376** F_year12 0.2775 0.0404 6.870**
F_year14 0.4881 0.0287 17.03** F_year14 0.5075 0.0293 17.33**
F_year15 0.4165 0.0281 14.82** F_year15 0.4362 0.0287 15.18**
Antihypertensive 0.6274 0.0195 32.10**
log L −15,796.72 log L −15,288.8
SE: standard error, *: significant at the 5% level, **: significant at the 1% level. 73,471 observations
DOI: 10.4236/health.2019.116064 805 Health Table 4. Results of estimation (Model C and Model D).
Model C Model D
Variable Estimate S.E. t-value Variable Estimate SE t-value
Constant −4.4543 0.4477 −9.949** Constant −4.3784 0.4470 −9.796**
Age 0.0206 0.0017 12.46** Age 0.0182 0.0017 10.77**
Female 0.1733 0.0440 3.938** Female 0.1876 0.0438 4.283**
Height 0.0026 0.0022 1.166 Height 0.0030 0.0022 1.359
BMI 0.0078 0.0045 1.727 BMI 0.0057 0.0045 1.270
SBP 0.0005 0.0012 0.410 SBP 0.00004 0.0012 0.037
DBP 0.0032 0.0017 1.854 DBP 0.0037 0.0017 2.144*
HDL −0.0014 0.0010 −1.435 HDL −0.0013 0.0010 −1.338
LDL 0.0000 0.0004 −0.120 LDL 0.0002 0.0004 0.447
Triglyceride 0.0001 0.0001 0.727 Triglyceride 0.0001 0.0001 0.688
GTP −0.0002 0.0003 −0.681 GTP −0.0002 0.0003 −0.692
ATL 0.0000 0.0011 0.012 ATL −0.0002 0.0011 −0.165
AST 0.0026 0.0013 2.096* AST 0.0027 0.0013 2.183*
Blood_sugar 0.0009 0.0003 2.979** Blood_sugar 0.0010 0.0003 3.060**
HbA1c 0.0039 0.0099 0.399 HbA1c 0.0036 0.0099 0.363
Urine_sugar 0.0185 0.0216 0.858 Urine_sugar 0.0166 0.0215 0.773
Urine_protein 0.0303 0.0242 1.254 Urine_protein 0.0138 0.0241 0.575
Weight 20 0.0126 0.0310 0.406 Weight 20 0.0063 0.0310 0.203
Weight 1 0.0775 0.0286 2.712** Weight_1 0.0779 0.0285 2.735**
Exercise 0.0164 0.0316 0.519 Exercise 0.0181 0.0316 0.574
Daily_activity −0.0588 0.0286 −2.058* Daily_activity −0.0567 0.0285 −1.992*
Speed −0.0209 0.0263 −0.793 Speed −0.0186 0.0262 −0.709
Eat_fast −0.0247 0.0220 −1.122 Eat_fast −0.0245 0.0219 −1.116
Late_supper 0.0426 0.0276 1.547 Late_supper 0.0410 0.0275 1.490
After_supper −0.0224 0.0381 −0.588 After_supper −0.0226 0.0380 −0.596 No_breakfast −0.0592 0.0301 −1.963* No_breakfast −0.0559 0.0301 −1.858
Smoke −0.0100 0.0282 −0.354 Smoke 0.0008 0.0282 0.027
Drink_freq −0.0139 0.0241 −0.576 Drink_freq −0.0214 0.0241 −0.886
Drink_amount 0.0179 0.0167 1.070 Drink_amount 0.0152 0.0167 0.908
Sleep −0.0412 0.0258 −1.599 Sleep −0.0494 0.0257 −1.924
Diabetes 0.3065 0.0366 8.381** Diabetes 0.2568 0.0375 6.838**
F_year11 0.4120 0.0662 6.226** F_year11 0.4196 0.0663 6.332**
F_year12 0.8546 0.0637 13.42** F_year12 0.8644 0.0638 13.56**
F_year14 0.6670 0.0479 13.94** F_year14 0.6776 0.0480 14.13**
Antihypertensive 0.2170 0.0369 5.884**
LogL −5709.861 LogL −5693.143
DOI: 10.4236/health.2019.116064 806 Health
5. Discussion
First, we considered the effects of SBP and DBP on HD. In all four models, the estimates of SDP were either negative or insignificant. On the other hand, all es-timates of DBP were positive and significant at least at the 5% level in three models. Although previous studies such as the SPRINT and ACCORD trials mainly considered SBP to represent hypertension, the results of this paper sug-gest that DBP is a more important factor to be considered. To clarify the mean-ing of these results, we replaced SBP and DBP with BP_level = (SBP + DBP)/2 and BP_difference = SBP − DBP in Models A-D. We denoted these as Models A’-D’; BP_level represents the absolute level of BP, and BP_difference is the dif-ference between SBP and DBP, which is important in sending blood through the body. The results of the estimation of BP_level and BP_difference are given in
Table 5. Since BP_level and BP_difference were obtained by linear transforma-tions of SBP and DBP, the results of all of the other covariates were unchanged. The estimates of BP_level were positive and significant at the 1% level in all models. The estimates of BP_difference were negative in all models and signifi-cant at the 1% level in Models A’ and B’. In Model B’, the absolute value of the estimate of BP_difference was almost twice as large as that of BP_level. These results strongly suggest that both SBP and DBP should be considered in the evaluation of BP. Lowing SBP is not sufficient, and lowering DBP is more
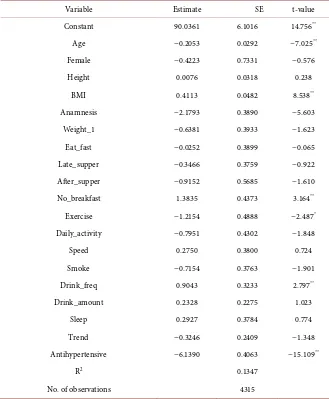
im-portant. Nawata, Sekizawa, and Kimura [47] suggested that taking
antihyperten-sive drugs would reduce SBP by 9.17 mmHg. Using the same model, taking an-tihypertensive drugs would reduce DBP by 6.14 mmHg. (The results of the
esti-mation are given in Table 6 in Appendix B). This means that the BP level
creased by 7.65 mmHg (not 9.17) and the difference between SBP and DBP de-creased by 3.0 mmHg. In other words, the effect of antihypertensive drugs might be smaller than previously considered.
The estimates of Antihypertensive were 0.627 and 0.217 with t-values of 32.10 and 5.88 in Model B and Model D, respectively. The values of the estimates and t-values were much larger than those of the other covariates except Diabetes. This means that taking antihypertensive drugs would increase the probability of undergoing HD treatment. As mentioned earlier, the endogeneity problem, namely that antihypertensive drugs might be used for the HD treatment, might exist in Model B, but we obtained the same results in Model D. The following three possible hypotheses can be considered:
1) The health conditions of individuals taking antihypertensive drugs were worse than those not taking antihypertensive drugs, and they were in the pre-stages of HD.
2) Individuals taking antihypertensive drugs went to hospitals or clinics more frequently than those not taking antihypertensive drugs. As a result, HD was more likely to be found earlier.
DOI: 10.4236/health.2019.116064 807 Health Table 5. Result of estimation of BP_level and BP_difference.
Model BP_level BP_difference
Estimates SE t-value Estimates SE t-value
A' 0.0030 0.0007 4.436** −0.0026 0.0008 −3.212**
B' 0.0018 0.0007 2.643** −0.0033 0.0008 −3.976**
C' 0.0037 0.0011 3.427** −0.0014 0.0014 −0.985
D' 0.0035 0.0011 3.254** −0.0016 0.0014 −1.137
SE: standard error, **: significant at the 1% level.
Table 6. Effect of antihypertensive drugs on DBP.
Variable Estimate SE t-value
Constant 90.0361 6.1016 14.756**
Age −0.2053 0.0292 −7.025**
Female −0.4223 0.7331 −0.576
Height 0.0076 0.0318 0.238
BMI 0.4113 0.0482 8.538**
Anamnesis −2.1793 0.3890 −5.603
Weight_1 −0.6381 0.3933 −1.623
Eat_fast −0.0252 0.3899 −0.065
Late_supper −0.3466 0.3759 −0.922
After_supper −0.9152 0.5685 −1.610
No_breakfast 1.3835 0.4373 3.164**
Exercise −1.2154 0.4888 −2.487*
Daily_activity −0.7951 0.4302 −1.848
Speed 0.2750 0.3800 0.724
Smoke −0.7154 0.3763 −1.901
Drink_freq 0.9043 0.3233 2.797**
Drink_amount 0.2328 0.2275 1.023
Sleep 0.2927 0.3784 0.774
Trend −0.3246 0.2409 −1.348
Antihypertensive −6.1390 0.4063 −15.109**
R2 0.1347
No. of observations 4315
SE: standard error, **: significant at the 1% level, *: significant at the 5% level.
[image:16.595.209.538.237.636.2]DOI: 10.4236/health.2019.116064 808 Health
precisely at the current stage and cannot reject the third hypothesis.
The major pharmacological classes of antihypertensive drugs used are [60] [61]
[62]: calcium channel blockers, angiotensin II receptor antagonists,
angioten-sin-converting enzyme inhibitors, diuretics, and β-blockers. In addition to these
medicines, alpha-adrenergic receptor blockers and others (including vasodilators, centrally acting drugs, and renin inhibitors) are used based on the conditions of
the patients. Every drug has side effects [63]. For the mechanism of action of the
side effects, see the review work of Laurent [62]. It is necessary to choose the
proper methods [64] and drugs to reduce the risks of side effects [61] [65]. These
results suggested that the 2017 ACC/AHA Guideline was not supported. We could not deny the possibility that the negative side effects might be more sig-nificant than the benefits of the antihypertensive drugs. We need more detailed analyses using a larger dataset with a longer time-range to assess the benefits and negative side effects.
Most of the estimates of the other covariates had the expected signs. Although LDL cholesterol is referred to as “bad” cholesterol, higher LDL values lowered the probability of undergoing HD treatment. Also, although the reason is un-known, higher levels of urine sugar also reduced the probability of undergoing HD treatment. Smoking lowered the probability of undergoing HD treatment; however, other negative effects of smoking were not analyzed in this paper. Age, gender, weight change of more than 3 kg within a year, and diabetes were signif-icant in both the having and predicting HD models. Among these covariates, the estimates and t-values of Diabetes were very large in all models. Special care is necessary to prevent HD in individuals with these risk factors, especially those with diabetes. BMI, ALT, AST, walking faster than other people, not eating breakfast, and sleeping well were significant factors in the HD models. The esti-mation results of the predicting models suggested that AST and blood sugar le-vels might be important predicting factors, and that daily physical activities might reduce the probability of undergoing HD treatment in the next year. All fiscal year dummies were positive and significant in all models. This may reflect the fact that the number of months included in fiscal year 2016 was smaller than that in the other fiscal years.
6. Conclusion
DOI: 10.4236/health.2019.116064 809 Health
of the covariates, and an endogeneity problem might exist. To avoid this prob-lem, we next evaluated individuals who were not undergoing HD treatment in
fiscal year t and the probabilities that these individuals would undergo HD
treatment in the next fiscal year, t + 1, with the two predicting HD models. The
estimates of SBP become positive, but they were not significant. The estimates of DBP were positive and significant in one model. These results might imply that DBP was a more important risk factor than SBP. Levels of BP should be defined using both SBP and DBP (such as by using the average), and differences in SBP and DBP should also be considered. Therefore, previous studies that just focused on SBP, such as ACCORD and SPRINT, should be revised. We then evaluated the effects of hypertensive drugs. Surprisingly, taking hypertensive drugs made the probability of undergoing HD treatment higher. It is necessary to choose proper drugs and methods to reduce the risks of side effects, considering the various health conditions of individuals. These results did not support the 2017 ACC/AHA Guideline.
Most of the estimates of other covariates have the expected signs. However, the estimates of LDL, referred to as “bad” cholesterol, were negative and signifi-cant as those of HDL (“good” cholesterol). The estimates of Urine_sugar and Smoke were also negative in the HD models. However, other negative effects of smoking were not analyzed in this paper. Age, Female, AST, Weight_1, and Di-abetes were significant in both the HD and predicting HD models. In particular, diabetes was considered a very important risk factor. BMI, ALT, No_breakfast Drink_amount, Drink_freq, and Sleep were significant in the HD models. The estimates of Blood_sugar were positive in the predicting HD models.
Although the guidelines of the ESC/ESH, Hypertension Canada, American Diabetes Association, and JSH maintained the diagnostic threshold of 140/90 mmHg for the general public, the influence of the 2017 ACC/AHA Guideline is so large that further studies to reevaluate the relationships among BP, antihy-pertensive drugs, and various health conditions should be done as soon as possi-ble. This study is based on the dataset from just one health insurance society, and a sample selection bias might exist. Analyses using a larger dataset with a longer time-range from various insurance societies are necessary. We are now negotiating various health insurance societies to provide us their data. There are several types of antihypertensive drugs. It is also necessary to determine their ef-fects and the side efef-fects of the drugs more precisely. These are topics to be stu-died in the future.
Acknowledgements
DOI: 10.4236/health.2019.116064 810 Health
Institute of Economics, Trade and Industry (RIETI). The dataset was anony-mized at the health insurance society. This study was approved by the Institu-tional Review Boards of the University of Tokyo (number: KE17-30). The au-thors would like to thank the health insurance society for their sincere coopera-tion in providing us the data. We would also like to thank an anonymous referee for his/her helpful comments and suggestions.
Conflicts of Interest
The authors declare no conflicts of interest regarding the publication of this pa-per.
References
[1] World Health Organization (WHO) (2019) Raised Blood Pressure.
https://www.who.int/gho/ncd/risk_factors/blood_pressure_prevalence_text/en/ [2] WHO and International Society of Hypertension Writing Group (2003) 2003 World
Health Organization (WHO)/International Society of Hypertension (ISH) State-ment on ManageState-ment of Hypertension. JournalofHypertension, 11, 1983-1992. https://doi.org/10.1097/00004872-200311000-00002
[3] Gaziano, T.A., Bitton, A., Anand, S. and Weinstein, M. (2009) The Global Cost of Nonoptimal Blood Pressure. JournalofHypertension, 27, 1472-1477.
https://doi.org/10.1097/HJH.0b013e32832a9ba3
[4] Benjamin, E.J., Blaha, M.J., Chiuve, S.E., etal. (2017) Heart Disease and Stroke Sta-tistics—2017 Updates: A Report from the American Heart Association. Circulation, 135, e146-e603. https://doi.org/10.1161/CIR.0000000000000491
[5] Wang, G., Grosse, G.S.D. and Schooley, M.W. (2017) Conducting Research on the Economics of Hypertension to Improve Cardiovascular Health. AmericanJournal
ofPreventiveMedicine, 53, S115-S117.
https://doi.org/10.1016/j.amepre.2017.08.005
[6] Centers for Disease Control and Prevention (2016) High Blood Pressure Fact Sheet. https://www.cdc.gov/dhdsp/data_statistics/fact_sheets/fs_bloodpressure.htm [7] Ministry of Health, Welfare, and Labor (2018) Heisei 28 nendo kokumin iryouhi no
gayou (Summary of National Medical Expenditures, Fiscal Year 2016) (in Japanese). [8] Blanchflower, D.G. and Oswald, A.J. (2008) Hypertension and Happiness across
Nations. JournalofHealthEconomics, 27, 218-233. https://doi.org/10.1016/j.jhealeco.2007.06.002
[9] Mojon-Azzi, S. and Sousa-Pazo, A. (2011) Hypertension and Life Satisfaction: An Analysis Using Data from the Survey of Health, Aging and Retirement in Europe.
AppliedEconomicsLetters, 18, 183-187.
https://doi.org/10.1080/13504850903508291
[10] Japanese Society of Hypertension (2014) Guidelines for the Management of Hyper-tension 2014. (In Japanese) http://www.jpnsh.jp/data/jsh2014/jsh2014v1_1.pdf [11] Blood Pressure Association (2008) Blood Pressure Chart for Adults.
http://www.bloodpressureuk.org/BloodPressureandyou/Thebasics/Bloodpressurech art
DOI: 10.4236/health.2019.116064 811 Health [13] Guidelines Subcommittee (1999) 1999 World Health Organization—International Society of Hypertension Guidelines for Management of Hypertension. Journalof
Hypertension, 17, 151-183.https://doi.org/10.1097/00004872-199917020-00001
[14] Whelton, P.K., Carey, R.M., Arrow, W.S., et al. (2018) 2017 ACC/AHA/AAPA/ ABC/ACPM/AGS/APhA/ASH/ASPC/NMA/PCNA Guideline for the Prevention, Detection, Evaluation, and Management of High Blood Pressure in Adults: A Re-port of the American College of Cardiology/American Heart Association Task Force on Clinical Practice Guidelines. Hypertension, 71, e13-e115.
https://doi.org/10.1161/HYP.0000000000000076
[15] Whelton, P.K., Carey, R.M., Arrow, W.S., etal. (2018) 2017 Guideline for Blood Pressure in Adults. American College of Cardiology.
http://www.acc.org/latest-in-cardiology/ten-points-to-remember/2017/11/09/11/41/ 2017-guideline-for-high-blood-pressure-in-adults
[16] Carey, R.M. and Whelton, P.K. (2018) Prevention, Detection, Evaluation, and Management of High Blood Pressure in Adults: Synopsis of the 2017 American College of Cardiology/American Heart Association Hypertension Guideline. Annals
ofInternalMedicine, 168, 351-335.https://doi.org/10.7326/M17-3203
[17] Levine, G.N., O’Gara, P.T., Beckman, J.A., etal. (2019) Modifications, and Evolu-tion of ACC/AHA Clinical Practice Guidelines: An Update for Our Constituencies.
Journal of the American College of Cardiology, 73, 1990-1998.
https://doi.org/10.1016/j.jacc.2019.02.012
[18] Chobanian, A.V., Bakris, G.L., Black, H.B., etal. (2003) Seventh Report of the Joint National Committee on Prevention, Detection, Evaluation, and Treatment of High Blood Pressure. Hypertension, 42, 1206-1252.
https://doi.org/10.1161/01.HYP.0000107251.49515.c2
[19] National Heart, Lung, and Blood Institute, U.S. Department of Health and Human Services (2004) National High Blood Pressure Education Program: Seventh Report of the Joint National Committee on Prevention, Detection, Evaluation, and Treat-ment of High Blood Pressure (Complete Report).
https://www.nhlbi.nih.gov/files/docs/guidelines/jnc7full.pdf
[20] Khera, R., et al. (2018) Impact of 2017 ACC/AHA Guidelines on Prevalence of Hypertension and Eligibility for Antihypertensive Treatment in United States and China: Nationally Representative Cross Sectional Study. The British Medical Jour-nal, 362, k2357. https://doi.org/10.1136/bmj.k2357
[21] Chuang, S.Y., Chang, H.Y., Cheng, H.M., Pan, W.-H. and Chen, C.-H. (2019) Im-pacts of the New 2017 ACC/AHA Hypertension Guideline on the Prevalence of Brachial Hypertension and Its Concordance with Central Hypertension. American
Journal of Hypertension, 32, 409-417.https://doi.org/10.1093/ajh/hpz008
[22] Marchesan, L.B. and Spritzer, P.M. (2019) ACC/AHA 2017 Definition of High Blood Pressure: Implications for Women with Polycystic Ovary Syndrome. Fertility
and Sterility, 111, 579-587.https://doi.org/10.1016/j.fertnstert.2018.11.034
[23] Williams, B., Mancia, G., Spiering, W., etal. (2018) 2018 ESC/ESH Guidelines for the Management of Arterial Hypertension. European Heart Journal, 39, 3021-3104. [24] Nerenberg, K.A., Zarnke, K.B., Leung, A.A., et al. (2018) Hypertension Canada’s
2018 Guidelines for Diagnosis, Risk Assessment, Prevention, and Treatment of Hypertension in Adults and Children. Canadian Journal of Cardiology, 34, 506-525. [25] Goupil, R., Lamarre-Cliche, M. and Vallée, M.(2018) The 2017 American College
DOI: 10.4236/health.2019.116064 812 Health 34, 665-669.https://doi.org/10.1016/j.cjca.2018.01.011
[26] American Diabetes Association (2018) Cardiovascular Disease and Risk Manage-ment: Standards of Medical Care in Diabetes—2018. DiabetesCare, 41, S86-S104. https://doi.org/10.2337/dc18-S009
[27] Hirawa, N., Umemura, S. and Ito, S. (2019) Viewpoint on Guidelines for Treatment of Hypertension in Japan. CirculationResearch, 124, 981-983.
https://doi.org/10.1161/CIRCRESAHA.119.314991
[28] American Academy of Family Physicians (AAFP) (2017) AAFP Decides to Not En-dorse AHA/ACC Hypertension Guideline, Academy Continues to EnEn-dorse JNC8 Guideline. AAFP News.
https://www.aafp.org/news/health-of-the-public/20171212notendorseaha-accgdlne. html
[29] Wright, J.T., Williamson, J.D., Whelton, P.K., etal. (2015) A Randomized Trial of Intensive versus Standard Blood-Pressure Control. TheNew England Journal of
Medicine, 373, 2103-2116.https://doi.org/10.1056/NEJMoa1511939
[30] Boston University and the National Heart, Lung, & Blood Institute (2019) Fra-mingham Heart Study. https://www.framinghamheartstudy.org/
[31] Harvard Health Publishing (2017) The Power of the Placebo Effect. Harvard Medi-cal School.
https://www.health.harvard.edu/mental-health/the-power-of-the-placebo-effect [32] Hoenemeyer, T.W., Kaptchuk, T.J., Mehta, T.S. and Fontaine, K.R. (2018) Open-Label
Placebo Treatment for Cancer-Related Fatigue: A Randomized-Controlled Clinical Trial. ScientificReports, 8, Article No. 2784.
https://doi.org/10.1038/s41598-018-20993-y
[33] Leung, A.A., Chang, H.J., McAlister, F.A., etal. (2018) Applicability of the Systolic Blood Pressure Intervention Trial (SPRINT) to the Canadian Population. Canadian
Journal of Cardiology, 34, 670-675.https://doi.org/10.1016/j.cjca.2018.01.008
[34] ACCORD Study Group (2010) Effect of Intensive Blood-Pressure Control in Type 2 Diabetes Mellitus. TheNewEnglandJournalofMedicine, 362, 1575-1585.
https://doi.org/10.1056/NEJMoa1001286
[35] Prospective Studies Collaboration (2002) Age-Specific Relevance of Usual Blood Pressure to Vascular Mortality: A Meta-analysis of Individual Data for One Million Adults in 61 Prospective Studies. TheLancet, 360, 1903-1913.
https://doi.org/10.1016/S0140-6736(02)11911-8
[36] Ettehad, D., Emdin, C.A., etal. (2016) Blood Pressure Lowering for Prevention of Cardiovascular Disease and Death: A Systematic Review and Meta-Analysis. The
Lancet, 387, 957-967.https://doi.org/10.1016/S0140-6736(15)01225-8
[37] Joffres, M.R., Mamet, P., MacLean, D.R., L’italien, G.J. and Fodor, G. (2001) Distri-bution of Blood Pressure and Hypertension in Canada and the United States. American. JournalofHypertension, 14, 1099-1105.
https://doi.org/10.1016/S0895-7061(01)02211-7
[38] Rapsomaniki, E., Timmis, A., George, J., etal. (2014) Blood Pressure and Incidence of Twelve Cardiovascular Diseases: Lifetime Risks, Healthy Life-Years Lost, and Age-Specific Associations in 1.25 Million People. TheLancet, 383, 1899-1911. https://doi.org/10.1016/S0140-6736(14)60685-1
[39] Muntner, P., Carey, R.M., Gidding, S., etal. (2018) Potential U.S. Population Impact of the 2017 ACC/AHA High Blood Pressure Guideline. Journal ofthe American
DOI: 10.4236/health.2019.116064 813 Health [40] Ihm, S.H., Bakris, G., Sakuma, I., etal. (2019) Controversies in the 2017 ACC/AHA
Hypertension Guidelines: Who Can Be Eligible for Treatments under the New Guidelines?—An Asian Perspective. CirculationJournal, 83, 504-510.
[41] Department of Public Health, Shiga University of Medical Science (2018) NIPPON DATA 2010. (In Japanese)
https://hs-web.shiga-med.ac.jp/Nippondata/NIPPONDATA2010/
[42] Miura, K., Nagai, M. and Ohkubo, T. (2013) Epidemiology of Hypertension in Ja-pan—Where Are We Now? CirculationJournal, 77, 2226-2231.
[43] Fujiyoshi, A., Ohkubo, T., Miura, K., et al. (2012) Blood Pressure Categories and Log-Term Risk of Cardiovascular Disease According to Age Group in Japanese Men and Women. HypertensionResearch, 35, 947-953.
https://www.nature.com/articles/hr201287 https://doi.org/10.1038/hr.2012.87
[44] Asayama, K., Satoh, M., Murakami, Y., etal. (2014) Cardiovascular Risk With and Without Antihypertensive Drug Treatment in the Japanese General Population Par-ticipant-Level Meta-Analysis. Hypertension, 63, 1189-1197.
https://doi.org/10.1161/HYPERTENSIONAHA.113.03206
[45] Department of Epidemiology and Public Health, Department of Epidemiology and Public Health, Graduate School of Medical Sciences, Kyushu University (2018) Ku-gayama Kenkyu (KuKu-gayama Study). (In Japanese)
http://www.hisayama.med.kyushu-u.ac.jp/about/index.html
[46] Honda, T., Yoshida, D., Hata, J., etal. (2018) Development and Validation of Mod-ified Risk Prediction Models for Cardiovascular Disease and Its Subtypes: The Hi-sayama Study. Atherosclerosis, 279, 38-44.
https://doi.org/10.1016/j.atherosclerosis.2018.10.014
[47] Nawata, K., Sekizawa, Y. and Kimura, M. (2018) Evaluation of Blood Pressure Con-trol Medicines Using Health and Medical Checkup Data in Japan: Alternative Me-thods for Randomized Controlled Trials. Health, 10, 587-603.
https://doi.org/10.4236/health.2018.105047
[48] Nawata, K., Matsumoto, A., Kajihara, K. and Kimura, M. (2017) Evaluation of the Distribution of and Factors Affecting Blood Pressure Using Medical Checkup Data in Japan. Health, 9, 124-137. https://doi.org/10.4236/health.2017.91009
[49] Nawata, K. and Kimura, M. (2018) Empirical Studies of Effects of High Blood Pres-sure on Medical Costs and Heart Disease: Is the 2017 ACC/AHA Guideline Sup-ported by Enough Evidence? Health, 10, 1498-1519.
https://doi.org/10.4236/health.2018.1011115
[50] Nawata, K. and Kimura, M. (2018) Does High Systolic Blood Pressure Truly In-crease Medical Expenditure? An Empirical Analysis of the New 2017 ACC/AHA Hypertension Guideline. Health, 10, 1044-1065.
https://doi.org/10.4236/health.2018.108079
[51] Japanese Law Translation (2009) Industrial Safety and Health Act. http://www.japaneselawtranslation.go.jp/law/detail/?id=1926&vm=&re
[52] Ministry of Health Labour and Welfare (2016) Diseases of the Circulatory System. https://www.mhlw.go.jp/toukei/sippei/dl/naiyou09.pdf
[53] World Health Organization (2019) ICD-10 Online Versions. https://www.who.int/classifications/icd/icdonlineversions/en/
[54] Cox, D.R. (1972) Regression Models and Life-Tables. Journal of the Royal Statistical
DOI: 10.4236/health.2019.116064 814 Health https://doi.org/10.1111/j.2517-6161.1972.tb00899.x
[55] American Heart Association (AHA) (2017) About Cholesterol.
http://www.heart.org/HEARTORG/Conditions/Cholesterol/AboutCholesterol/Abo ut-Cholesterol_UCM_001220_Article.jsp#.Wtrw2ojFKUk
[56] WHO (2018) Raised Cholesterol.
http://www.who.int/gho/ncd/risk_factors/cholesterol_text/en/
[57] Centers for Disease Control and Prevention (2017) LDL and HDL Cholesterol: “Bad” and “Good” Cholesterol. https://www.cdc.gov/cholesterol/ldl_hdl.htm [58] American Heart Association (2017) HDL (Good), LDL (Bad) Cholesterol and
Trig-lycerides.
https://www.heart.org/en/health-topics/cholesterol/hdl-good-ldl-bad-cholesterol-an d-triglycerides
[59] U.S. National Library of Medicine (2018) Medical Encyclopedia. https://medlineplus.gov/encyclopedia.html
[60] Medline Plus (2018) High Blood Pressure Medicines. U.S. National Library of Med-icine https://medlineplus.gov/ency/article/007484.htm
[61] The Japanese Society of Hypertension (2014) Guidelines for the Management of Hypertension 2014. (In Japanese)
http://www.jpnsh.jp/data/jsh2014/jsh2014v1_1.pdf
[62] Laurent, S. (2017) Antihypertensive Drugs. Pharmacological Research, 124, 116-125.
https://doi.org/10.1016/j.phrs.2017.07.026
[63] WebMed (2018) Side Effects of High Blood Pressure Medications.
https://www.webmd.com/hypertension-high-blood-pressure/guide/side-effects-hig h-blood-pressure-medications#1
[64] Kario, K., Thijs, L. and Staessen, J.A. (2019) Blood Pressure Measurement and Treatment Decisions, Masked and White-Coat Hypertension. CirculationResearch, 124, 990-1008.https://doi.org/10.1161/CIRCRESAHA.118.313219
[65] Harvard Heath Publishing (2017) Controlling Blood Pressure with Fewer Side Ef-fects. Harvard Medical School.
DOI: 10.4236/health.2019.116064 815 Health
Appendix A: Cox Proportional Hazard Method When
Time-Dependent or Time-Varying Covariates Are Included
In studies such as SPRINT, the Cox proportional hazard model was used. How-ever, when the covariates include time-dependent or time-varying covariates that change over time, it is necessary to consider their influence. To the best of our knowledge, this section is the first explicit representation of medical dataanalyses. Suppose that there are n individuals, i=1,2, , n, and the time
conti-nuous. Let ti be the time that i begins to undergo HD treatment. Since the
con-tinuous time model is considered, t t i ji ≠ j, ≠ . Let t t1< <2 <tn. In the Cox
proportional hazard model, the hazard function h ti
( )
is given by a part thatdepends on time and a part that only depends on the characteristics of the
indi-vidual, represented by a vector of covariates, xi, that is unchanged over time.
Under these conditions, we get
( )
( )
exp( )
i i
h t =
λ
t x′β
. (6)For the estimation of the model, the partial likelihood method (also known as
Cox regression) is used. Let Ai be a set of individuals who do not undergo HD
treatment. The i-th individual begins to undergo HD treatment at ti.
(Individu-al i begins to undergo HD treatment just after ti and i A∈ i.) From time t to
t+ ∆t, where ∆t is an infinitesimal time interval, the probability of one
indi-vidual beings to undergo HD treatment is approximately given by
( )
i j j A∈ h t t
∆
∑
.The conditional probability that i undergoes HD treatment is given by
( )
( )
exp( )
exp( )
i i
i i i j i j
j A j A
L h t t h t t xβ xβ
∈ ∈
′ ′
= ∆
∑
∆ =∑
. (7)By multiplying the conditional probabilities for all individuals, we get the par-tial likelihood, which is similar to the logit method,
1 2 n
L L L= ⋅ L . (8) By maximizing this function, we can obtain estimators. In this estimation
method, only orders of ti are used, and values of ti themselves are not used.
However, the Cox method assumes that the hazard function is given by the product of the time-dependent and non-time-dependent parts. However, when the values of covariates change over time, this creates a serious problem. Health conditions change very rapidly over time, and we cannot use the Cox method in these cases.
Therefore, we should use a model as shown in the following example. Let time
t be a discrete variable, and the value of the variable changes periodically (for
example, by year or month), and the value of variable does not change within a
period. Let *
it
y be a latent variable representing the health conditions of the
in-dividual i at time t. *
it
y is given by the linear function of a vector xit that
represents various characteristics of i and is given by
* , 1,2, ,
it it it
y =x′
β
+u i= n (9)it
x may depend on t, Individual i does not undergo HD treatment if * 0
it