Development of novel fluorescent
histamine H
1
-receptor antagonists
to study ligand-binding kinetics in
living cells
Leigh A. Stoddart
1,4, Andrea J. Vernall
2, Monica Bouzo-Lorenzo
1,4, Reggie Bosma
3,
Albert J. Kooistra
3, Chris de Graaf
3
, Henry F. Vischer
3, Rob Leurs
3, Stephen J. Briddon
1,4,
Barrie Kellam
2,4& Stephen J. Hill
1,4
The histamine H1-receptor (H1R) is an important mediator of allergy and inflammation. H1R antagonists have particular clinical utility in allergic rhinitis and urticaria. Here we have developed six novel
fluorescent probes for this receptor that are very effective for high resolution confocal imaging, alongside bioluminescence resonance energy transfer approaches to monitor H1R ligand binding kinetics in living cells. The latter technology exploits the opportunities provided by the recently described bright bioluminescent protein NanoLuc when it is fused to the N-terminus of a receptor. Two different pharmacophores (mepyramine or the fragment VUF13816) were used to generate fluorescent H1R antagonists conjugated via peptide linkers to the fluorophore BODIPY630/650. Kinetic properties of the probes showed wide variation, with the VUF13816 analogues having much longer H1R residence times relative to their mepyramine-based counterparts. The kinetics of these fluorescent ligands could also be monitored in membrane preparations providing new opportunities for future drug discovery applications.
G protein-coupled receptors (GPCR) are one of the major targets for currently approved drugs, with circa 30% acting at the GPCR superfamily1. Furthermore, there remains huge potential for innovation within this protein family since only 30% of the non-olfactory GPCRs have been successfully targeted2. The development of new therapeutics has been hampered in recent years, however, by the failure of many drugs in late-stage clinical trials as a consequence of a lack of appropriate clinical efficacy3. The increasing number of crystal structures available for GPCRs has facilitated the application of rational design efforts to the drug discovery process4,5 but since these receptors are highly dynamic proteins that can adopt a wide range of conformations, there is a need to study these receptors in their natural cellular environment6.
An important, but often overlooked, property of a drug candidate is the rate at which it binds to, and disso-ciates from, its target receptor7. Drugs with similar affinity can display markedly different binding kinetics, and optimising a drug’s binding kinetics to clinical need is thought to be one way to reduce drug discovery attrition rates8,9. The use of isolated membranes from homogenized cells in combination with radiolabelled ligands has been the most frequently used method to measure ligand binding kinetics to a GPCR. However, intracellular signalling proteins can have marked allosteric influences on the binding of ligands to GPCRs10–12 and one conse-quence of allosteric interactions is that they change ligand binding kinetics13. As a result of this, there may be dif-ferences in the binding kinetics of compounds measured in whole cells compared to those measurements made in
1Division of Pharmacology Physiology and Neuroscience, School of Life Sciences, University of Nottingham, Nottingham, NG7 2UH, UK. 2School of Pharmacy, Division of Biomolecular Science and Medicinal Chemistry, Centre for Biomolecular Sciences, University of Nottingham, Nottingham, NG7 2RD, UK. 3Department of Chemistry and Pharmaceutical Sciences, Division of Medicinal Chemistry, Amsterdam Institute for Molecules, Medicines and Systems (AIMMS), Vrije Universiteit, Amsterdam, PO Box 7161, Amsterdam, The Netherlands. 4Centre of Membrane Proteins and Receptors, University of Birmingham and University of Nottingham, Midlands, UK. Correspondence and requests for materials should be addressed to B.K. (email: [email protected]) or S.J.H. (email:
Received: 25 October 2017 Accepted: 3 January 2018 Published: xx xx xxxx
www.nature.com/scientificreports/
isolated membranes. One way to study ligand-binding kinetics of receptors in their natural cellular environment is through the use of fluorescently labelled agonists and antagonists14,15.
Fluorescent ligands for GPCRs have been used to study various aspects of receptor pharmacology and func-tion including ligand binding16,17, endogenous receptor localisation18–20, receptor organisation within the cell membrane21,22 and ligand binding kinetics23–25. However, fluorescent ligands often require optimisation for use in a specific application. For example, in the case of the histamine H1 receptor (H1R), Rose et al. described a
fluorescent ligand that was successfully used for fluorescence correlation spectroscopy, but showed high levels of non-specific membrane binding and cytoplasmic uptake that made confocal imaging difficult26. Fluorescent ligands for GPCRs are normally composed of an agonist or antagonist for the receptor of interest chemically linked to a fluorescent molecule such as one of the boron-dipyrromethene (BODIPY) or cyanine dyes27. For flu-orescent small molecule ligands, such as those for Class A GPCRs, addition of the linker and fluorophore results in a significant increase in molecular weight and complexity and these molecules should therefore be treated as new pharmacological entities. For instance, we have shown that the linker region can influence the fluorescent ligand properties, with peptide-based linkers improving both affinity and imaging capabilities of Xanthine Amine Congener based ligands for the adenosine A3 receptor28.
The H1R is a Class A GPCR which couples predominantly to Gq/11 proteins, leading to phospholipase C
acti-vation and release of intracellular calcium29. It is expressed in a wide variety of cell types including, smooth muscle, endothelium, immune cells and neurons30, and its activation by the endogenous ligand histamine is a key mediator of allergy and inflammation. A wide range of clinically approved antagonists for the H1R have
been successfully used for many years in the treatment of allergy related conditions such as allergic rhinitis and urticaria31. The crystal structure of an antagonist bound H
1R has been recently solved32 and therefore to gain
further understanding of the dynamic regulation of ligand binding to this receptor in live cells, improvements to the currently available fluorescent ligands26 needed to be made. By using the strategy previously described for the adenosine A3 receptor28, where peptide linkers were introduced between the fluorophore and pharmacophore,
we aimed to generate broad utility fluorescent ligands for the H1R that are suitable for use in a range of different
fluorescent techniques including confocal microscopy, but particularly for assessing receptor binding kinetics using bioluminescence resonance energy transfer (BRET).
Results
Pharmacological Characterization of Fluorescent Ligands.
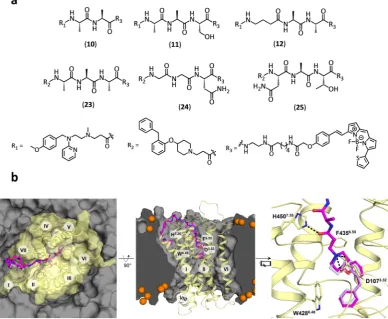
Six fluorescent antagonists for the H1Rwere synthesized as part of this study (Figure S1); three based on the commonly used H1R antagonist mepyramine
and three based on the recently described fragment-like antagonist VUF1381633,34 (Fig. 1a). The di- or tripeptide linkers were designed based on the predicted docking pose of VUF1381634 in the H
1R crystal structure32 (Fig. 1b).
The binding mode of VUF13816 has been experimentally validated by combined structure-activity relationship and site-directed mutagenesis studies35 and suggests that the basic amine nitrogen atom that interacts with the anionic D1073.32 residue in TM helix III provides a good point to attach a peptide linker that: i) has the
appropri-ate length to cross the extracellular vestibule to place the fluorophore in the membrane bilayer, and ii) is compat-ible with the H1R binding surface (Fig. 1b). 6-(((4,4-Difluoro-5-(2-thienyl)-4-bora-3a,4a-diaza-s-indacene-3-yl)
styryloxy)acetyl)aminohexanoic acid (BODIPY630/650-X) was preferred due to previous success with this fluorophore for Class A GPCR fluorescent ligands28,36,37 as it has favourable excitation/emission wavelength for planned techniques. BODIPY630/650 is known to have an increased quantum yield in a lipid environment38 and as the modelling suggests the fluorophore would reside within the membrane bilayer this would increase its brightness for imaging studies and reduce background fluorescence in aqueous solution.
To confirm that the newly synthesized fluorescent ligands retained the ability to bind to the human H1R in
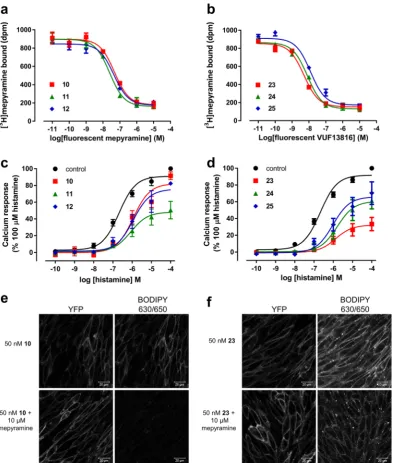
HEK293T cells, competition radioligand binding studies were performed. All six compounds retained affinity at the H1R (Fig. 2, Table 1) demonstrating that the peptide linker and appended fluorophore were well tolerated
and did not lead to a reduction in affinity compared to the parent pharmacophores. No significant difference in the affinity of the mepyramine-based compounds (10–12) was observed despite the different peptide linkers, with all three compounds displaying affinities in the 10–25 nM range. This was also true for the VUF13816-based compounds (23–25), although they exhibited slightly higher affinity (4–6 nM) than those based on mepyramine. Each of the compounds was also tested for their ability to antagonize histamine-stimulated calcium release in CHO cells expressing the H1R (Fig. 2). All six compounds produced a rightward-shift in the histamine mediated
concentration response curves. As seen previously for the H1R, a suppression of the maximal calcium response
was observed in the presence of each of the compounds, which is related to the non-equilibrium kinetics of the assay26,39. Taking this into account EC
25, rather than EC50, values were used to estimate the pKB of the fluorescent
compounds (Table 1). The values obtained in the calcium assay were in close agreement with those from the radioligand binding experiments, with the VUF13816 based conjugates again displaying higher affinity than the mepyramine based compounds.
Confocal Microscopy.
Peptide linkers were used between the pharmacophore and fluorophorecompo-nent of the fluorescent ligands in an attempt to reduce the compounds’ lipophilicities and ability to cross cell membranes (compared to the equivalent alkyl linker), thus optimising their properties for use in confocal imaging. Imaging studies were performed on CHO cells expressing H1R linked to yellow fluorescent protein
(H1-YFP), which was predominantly expressed at the cell surface. Exposure of H1-YFP cells to 50 nM of 10, 11
or 12 for 30 min at 37 °C resulted in clear membrane localisation of the BODIPY630/650 fluorescence emis-sion for each of the ligands (Fig. 2 and Figure S2). To confirm the specificity of binding to the H1R, H1-YFP
imaging properties obtained with the peptide linkers, cells were also exposed to a derivative with a non-peptidic linker, mepyramine-X-BODIPY630/65026, in the presence and absence of mepyramine. In contrast to the lig-ands with peptidic linkers, very little cell surface binding of mepyramine-X-BODIPY630/650 could be dis-cerned due to high levels of intracellular accumulation of the fluorescent ligand. This was not prevented by the presence of mepyramine, indicating significant non-specific binding and cellular uptake (Figure S3). The three VUF13816-based compounds (23–25) were also imaged in the presence and absence of mepyramine (Fig. 2 and S3). These fluorescent compounds also displayed clear cell surface binding which showed a similar binding pattern to the H1R-YFP fluorescence. For each of the compounds clear reduction in cell surface fluorescence
was observed following pre-treatment with the unlabelled antagonist mepyramine indicating the majority of the membrane fluorescence was specific binding to the H1R. Some residual binding was observed with 23, which may
be due to it being the highest affinity of the fluorescent ligands tested.
Saturation and competition binding studies using NanoBRET in whole cells.
Bioluminescenceresonance energy transfer (BRET) is a proximity (<10 nm) assay which can be used to measure the bind-ing of fluorescent ligands to a receptor of interest expressbind-ing a bioluminescent protein (NanoLuc) tag on the N-terminus40,41. We used our fluorescent ligands in conjunction with a NanoLuc tagged H
1R (Nluc-H1R) to
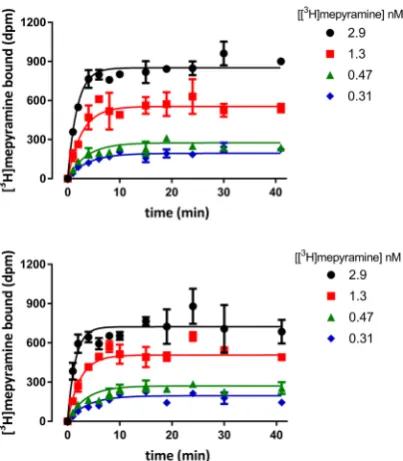
determine their binding kinetics at the receptor. Initially, to confirm that the NanoLuc tag had no steric hin-drance effects on the binding of ligands to the H1R, we performed association binding experiments using [3H]
mepyramine to determine its kinetic parameters at both HA-H1R and Nluc-H1R (Fig. 3). The association and
dis-sociation rates of [3H]mepyramine at Nluc-H
1R and HA-H1R, and consequently its affinity, were not significantly
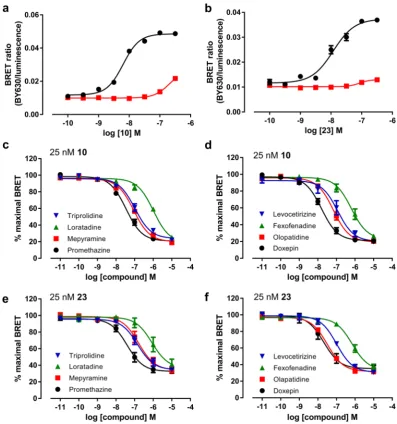
different (Table 2). All six of the fluorescent ligands used in this study showed a clear concentration-dependent and saturable increase in BRET signal when incubated with HEK293T cells stably expressing Nluc-H1 (Fig. 4 and S4).
Low levels of non-specific BRET were observed for all fluorescent ligands, as determined by co-incubation with a high concentration (10 µM) of unlabelled mepyramine. Due to the wide concentration range of fluorescent lig-ands used in these studies, specific binding was plotted versus ligand concentration on a log scale and fitted with a sigmoidal function to determine the KD value as the concentration at which 50% specific binding is achieved.
In addition, the wide concentration range of fluorescent ligand used also appeared to cause an increase in the non-specific binding at the highest concentration of fluorescent ligand used (300 nM). This was almost certainly due to a direct competition of fluorescent and unlabelled ligand for the receptor with the extent of the shift in Figure 1. Chemical structure and molecular modelling of fluorescent ligands for the H1R. (a) Chemical
structures of fluorescent mepyramine (10, 11, 12) and VUF13816 (23, 24, 25) derivatives (b) Modelled binding pose of 23 in the H1R, based on the experimentally validated binding mode of VUF1381634,35 in the H1R crystal
[image:3.595.159.548.50.369.2]www.nature.com/scientificreports/
the log concentration-binding curve effectively reflecting the affinity of mepyramine for the H1R. The KD values
obtained for each of the six fluorescent H1R antagonists in Nluc-H1R-HEK293T cells are shown in Table 1.
To further study the suitability of these novel fluorescent ligands to monitor ligand binding at the H1R we used
the mepyramine- and VUF13816-based fluorescent ligands with the highest affinity for the receptor (10 and 23) Figure 2. Pharmacological characterisation and live cell confocal imaging of fluorescent ligands at the H1R.
(a and b) Inhibition of specific [3H]mepyramine binding to cell homogenates transiently expressing the human
H1R by mepyramine (a) and VUF13816 (b) based fluorescent antagonists. Data points represent mean ± SEM
of triplicate determinations. Graphs shown are representative of three experiments performed. (c and d) CHO-K1 cells stably expressing the human H1R were preincubated with 100 nM of the indicated fluorescent
antagonist for 30 min at 37 °C prior to the addition of increasing concentrations of histamine and changes in intracellular calcium monitored. Data were normalized to basal (in the absence of histamine or antagonist) and 100 µM histamine for each experiment. The data shown represent the mean ± SEM of four experiments performed in triplicate. (e and f) Live cell confocal images of CHO cells expressing H1-YFP incubated with
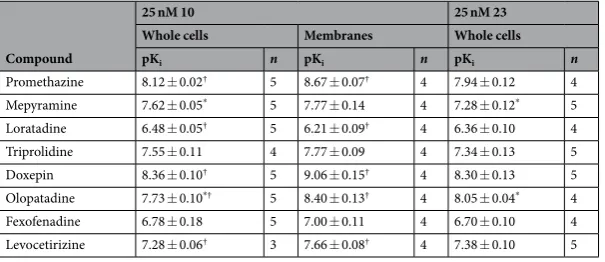
[image:4.595.158.552.44.508.2]to perform competition binding assays (Fig. 4). All eight compounds caused a concentration-dependent decrease in BRET ratio with both fluorescent ligands and this allowed pKi values of eight diverse H1R antagonists to be
determined (Table 3). In general, the pKi values obtained using 10 or 23 were comparable (R2= 0.91) with
dox-epin displaying the highest affinity for the H1R and loratadine the lowest. Of the eight compounds tested, two
Compound
Radioligand binding Calcium assay NanoBRET saturation NanoBRET kinetics
pKi n pKD n pKD n kon (× 106 M−1min−1) koff (min−1) Tr (min) pKD n
10 7.6 ± 0.1 3 7.5 ± 0.2 4 8.1 ± 0.1 6 46.4 ± 5.9 0.214 ± 0.029 4.99 ± 0.78 8.3 ± 0.01 4
11 8.0 ± 0.1 3 7.9 ± 0.1 4 7.2 ± 0.1 4 19.8 ± 2.2 0.126 ± 0.015 8.40 ± 0.91 8.2 ± 0.06 5
12 7.7 ± 0.1 3 7.8 ± 0.1 4 7.3 ± 0.2 5 3.3 ± 0.6 0.134 ± 0.011 7.68 ± 0.58 7.4 ± 0.09 6
23 8.4 ± 0.1 3 8.6 ± 0.2 4 8.1 ± 0.1 6 1.6 ± 0.3 0.019 ± 0.002 54.08 ± 5.33 7.9 ± 0.10 4
24 8.3 ± 0.1 3 8.1 ± 0.3 4 7.6 ± 0.1 5 2.9 ± 0.6 0.027 ± 0.002 37.81 ± 3.44 8.0 ± 0.09 4
25 8.2 ± 0.2 3 7.8 ± 0.3 4 7.5 ± 0.1 5 2.6 ± 0.4 0.030 ± 0.006 39.53 ± 9.40 8.0 ± 0.10 4
Table 1. Binding affinities and kinetic parameters of fluorescent antagonists at the human H1R. pKi values
were calculated from inhibition of [3H]mepyramine binding to membranes from HEK293T cells transiently
expressing human H1R. Calcium assay pKD values were estimated from a shift in histamine concentration
response curves to 100 nM of each fluorescent compound in CHO cells expressing H1R. NanoBRET saturation
pKD values were calculated from the saturation curve of the fluorescent ligands binding to HEK293T
cells expressing Nluc-H1R. The kinetic parameters, kon, koff and pKD values were obtained using varying
concentrations of fluorescent ligand and measuring the NanoBRET signal over time in HEK293T cells expressing Nluc-H1R. The non-specific signal was determined using a high concentration (10 μM) of doxepin
as a competitor. The residence time (Tr) was calculated as the mean of the reciprocal of the koff values from each
individual experiment. All values represent mean ± SEM from n separate experiments performed in triplicate.
Figure 3. Association binding of [3H]mepyramine at HA-H
1R and Nluc-H1R. Specific [3H]mepyramine
binding over time to cell homogenate transiently expressing the human H1R was measured for cells expressing
the HA-tagged receptor (a) or the Nluc-tagged receptor (b). Data points represent mean ± SEM of duplicate determinations. Graphs shown are representative of 12 (a) or 4 (b) experiments performed.
kon (×106 M−1 min−1) koff (min−1) pKD n
HA-H1R 122 ± 7 0.21 ± 0.01 8.7 ± 0.0 12
Nluc-H1R 147 ± 16 0.24 ± 0.02 8.8 ± 0.0 4
Table 2. Kinetic parameters of [3H]mepyramine at HA-H
1R and Nluc-H1R. Kinetic parameters for [3H]
mepyramine-receptor binding were determined by monitoring [3H]mepyramine binding to a homogenate
of HEK293T cells expressing either HA-H1R or Nluc-H1R. All values represent mean ± SEM from n separate
[image:5.595.155.376.276.313.2] [image:5.595.157.359.384.615.2]www.nature.com/scientificreports/
compounds showed a small degree of probe-dependence; mepyramine was found to have a slightly higher affinity when using 10 as the tracer whereas olopatadine was slightly higher affinity in competition with 23 (p < 0.05, unpaired t-test).
Suitability of NanoBRET for kinetic studies.
The saturation and competition measurements described above were performed as end point readings with the assumption that equilibrium had been reached. If this was correct, then the pKi values obtained should be independent of the kinetics of the fluorescent and non-fluorescentcompounds used. To test this, we first used the NanoBRET assay to directly determine the kinetic constants (kon
and koff) of the fluorescent ligands. As the BRET measurements are dependent on the luminescence from the
NanoLuc protein, and since kinetic measurements may need to be taken for up to 2 hours, it was necessary to confirm that the BRET signal was stable over this time. To test this, Nluc-H1R HEK293T cells were treated with
25 nM 10 in the presence and absence of 10 μM doxepin for 60 min prior to the addition of 0.5 µM furimazine (Nluc substrate). Luminescence and fluorescence emissions were monitored every minute for 90 min and then an additional 0.5 µM furimazine was added and luminescence and fluorescence monitored for a further 30 min. Figure 4. Saturation and competition NanoBRET studies with Fluorescent Ligands 10 and 23. (a and b) Saturation binding curves from BRET experiments in Nluc-H1R HEK cells treated with increasing
concentrations of (a) 10 or (b) 23 in the absence (black circles) or presence (red squares) of 10 µM mepyramine. The data shown are representative of six independent experiments performed in triplicate. (c–f) Inhibition of BRET signal in Nluc-H1R HEK293T cells treated with 25 nM 10 (c,d) or 25 nM 23 (e,f) and increasing
[image:6.595.154.552.44.469.2]As seen in Figure S5, fluorescence and luminescence signals decayed with time after the addition of the substrate (due to consumption of the substrate by the bioluminescence reaction) and exhibited an instant increase after the addition of additional furimazine which subsequently decayed again with time. Due to the ratiometric nature of the BRET signal, however, the resulting BRET ratio was found to be very stable 15 min following the addition of substrate, even after the second substrate addition (Figure S5).
Kinetic studies in whole cells.
The kinetics of the six fluorescent ligands was therefore evaluated in Nluc-H1R HEK293T cells. The specific binding of these compounds at each time point was calculated bysubtract-ing non-specific bindsubtract-ing from the equivalent time-matched total signal (Fig. 5). The values for the non-specific signal were obtained in the presence of a high concentration (10 μM) of doxepin as a competitor. The kinetic KD,
kon and koff values obtained from the BRET data, as well as the calculated residence time for the six fluorescent
H1R antagonists in intact cells, are shown in Table 1. These kinetic studies showed that the residence time of the
fluorescent ligands based on mepyramine were approximately four fold less than those of the VUF13816 based fluorescent ligands. In addition, we observed that the kinetic KD values were comparable with those obtained
from the saturation binding experiments in the majority of the cases with the exception of 11, where the kinetic KD was tenfold lower than that obtained in the saturation studies. The direct measurement of kinetic parameters
at a GPCR in an intact cell environment is limited to compounds that are either fluorescently or radiolabelled. To overcome this, the theoretical framework developed by Motulsky and Mahan42 allow the kinetic parameters of unlabelled ligands to be quantified if the kinetics of the labelled ligand are known. To demonstrate the use-fulness of these novel ligands in kinetic screening of unlabelled compounds in the NanoBRET assay, we used 10 to determine the kinetic parameters of two unlabelled antagonists, promethazine and loratadine (Fig. 6 and Table 4). Kinetic data obtained in the presence of a range of competitor concentrations allowed their kon and koff
to be determined (Table 4).
BRET studies performed in cell membranes.
One of the main advantages of the NanoBRET techniqueis its ability to determine ligand binding parameters in living cells. To compare the effects of an intact cellular environment on the affinity and kinetics properties of our fluorescent ligands, we also performed BRET studies in membrane preparations from Nluc-H1 HEK293T cells. In initial optimisation studies, very low levels of specific
binding were observed when measuring the kinetics of conjugate 10. To overcome this, we performed experi-ments in the presence of the detergent saponin (1 mg/ml), in order to disrupt membrane vesicles, which greatly improved the specific BRET ratios obtained (Figure S6). Since saponin was found to have no effect no competi-tion binding curves and on the affinity of doxepin (Figure S6), all further studies in membranes were performed in the presence of saponin.
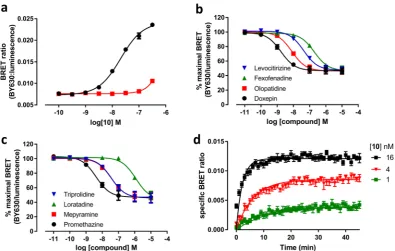
Saturation binding curves for 10 obtained in cell membranes from Nluc-H1R HEK293T cells obtained in the
presence and absence of 10 μM of unlabelled mepyramine are shown in Fig. 7. As in cells, compound 10 showed a clear concentration-dependent and saturable increase in BRET signal, with a pKD value of 7.54 ± 0.04 (n = 5).
We also used 10 to perform competition binding assays in cell membranes with the same eight H1R antagonists
as used previously (Fig. 7). The competition-binding pKi values obtained (Table 3) for unlabelled antagonists
were comparable with those obtained on intact cells (R2= 0.96) although some minor differences were seen for
individual compounds, with a trend for compounds to show higher affinity in membranes compared to whole cells. The affinity of promethazine, doxepin, olopatadine and levocetirizine was significantly higher (p < 0.05, unpaired t-test) in membranes than whole cells, whilst that for loratadine was lower (p < 0.05, unpaired t-test). Finally, we obtained the kinetic constants of 10 in membranes from cells expressing Nluc-H1 (Fig. 7). The kon
(19.64 ± 4.12 × 10⁶ M−1.min−1) and the k
off (0.065 min−1) determined in membranes were both signifcantly
slower (p < 0.05, unpaired t-test) than those obtained in intact cells, but there was no difference in the calculated affinity (pKD= 8.45 ± 0.12, n = 4, p > 0.05, unpaired t-test).
Compound
25 nM 10 25 nM 23
Whole cells Membranes Whole cells
pKi n pKi n pKi n
Promethazine 8.12 ± 0.02† 5 8.67 ± 0.07† 4 7.94 ± 0.12 4
Mepyramine 7.62 ± 0.05* 5 7.77 ± 0.14 4 7.28 ± 0.12* 5 Loratadine 6.48 ± 0.05† 5 6.21 ± 0.09† 4 6.36 ± 0.10 4
Triprolidine 7.55 ± 0.11 4 7.77 ± 0.09 4 7.34 ± 0.13 5
Doxepin 8.36 ± 0.10† 5 9.06 ± 0.15† 4 8.30 ± 0.13 5
Olopatadine 7.73 ± 0.10*† 5 8.40 ± 0.13† 4 8.05 ± 0.04* 4
Fexofenadine 6.78 ± 0.18 5 7.00 ± 0.11 4 6.70 ± 0.10 4
Levocetirizine 7.28 ± 0.06† 3 7.66 ± 0.08† 4 7.38 ± 0.10 5
Table 3. Affinities of unlabelled antagonists at Nluc-H1R measured in whole cells and membranes. pKi values of
eight H1R antagonists in HEK293T cells or membranes expressing Nluc-H1R were determined by competition
binding with 25 nM 10 (whole cells and membranes) or 25 nM 23 (whole cells only). All values represent mean ± SEM from n separate experiments performed in triplicate. *p < 0.05 pK
i measured using 10 versus 23 (Student’s unpaired t test). †p < 0.05 pK
i measured using 10 in whole cells versus membranes (Student’s
[image:7.595.156.459.46.177.2]www.nature.com/scientificreports/
Figure 5. NanoBRET association kinetic studies with mepyramine and VUF13816 based fluorescent ligands. Nluc-H1R HEK293 cells were treated with the indicated concentrations of 10 (a), 11 (b), 12 (c), 23 (d), 24 (e)
and 25 (f) and BRET monitored at room temperature every min for 60 min (a–c) or 90 min (d–f). The data shown are representative examples from four (10, 23, 24, 25), five (11) or six (12) independent experiments performed in triplicate.
Figure 6. Use of fluorescent ligand 10 to determine the kinetics of unlabelled ligands. Nluc-H1R HEK293 cells
[image:8.595.155.555.50.365.2] [image:8.595.157.359.454.665.2]Discussion
The recent development of fluorescent ligands has enabled many aspects of receptor pharmacology and function to be studied14,43. Here we have increased the range and improved the properties of fluorescent ligands available to study the H1R by synthesising six new ligands based on two different orthosteric binding moieties (mepyramine
and VUF13816). We have created a series of new, high affinity fluorescent H1R ligands suitable for use in both
confocal imaging and, in particular, in NanoBRET assays for monitoring ligand binding in living cells.
To date, there have been two reports on fluorescent ligands for the H1R based on the prototypic antagonist
mepyramine25,26, but in the case of mepyramine-X-BODIPY630/650 its lipophilic nature meant it was unsuitable for confocal microscopy26. Using a previous strategy to develop new fluorescent ligands for the adenosine A
3
receptor28,44, here we replaced the six carbon linker between the mepyramine and the BODIPY630/650 fluoro-phore26 with di- or tripeptides. Introduction of these peptide linkers resulted in some loss in affinity compared to the previously described fluorescent mepyramine (mepyramine-X-BODIPY630/650; pKD= 8.926), but more
importantly improved their imaging properties. All three new mepyramine fluorescent ligands allowed clear visualisation of membrane binding by confocal microscopy that could be prevented by a high concentration of unlabelled mepyramine. This was in direct contrast to mepyramine-X-BODIPY630/650, where intracellular accu-mulation of the fluorescent ligand masked the detection of specific membrane binding by confocal microscopy.
kon (×105 M−1 min−1) koff (min−1) pKD
Promethazine 337.6 ± 147.1 0.18 ± 0.05 8.18 ± 0.09 Loratadine 2.2 ± 0.4 0.35 ± 0.13 5.83 ± 0.20
Table 4. Kinetic parameters of promethazine and loratadine at Nluc-H1R determined using NanoBRET.
Kinetic parameters were obtained by monitoring the binding of 10 nM 10 in the presence of increasing concentrations of unlabelled ligand and calculated as detailed in Methods. All values represent mean ± SEM from 5 experiments performed in triplicate.
Figure 7. NanoBRET saturation, competition and kinetic binding studies with fluorescent ligand 10 in cell membranes. (a). Saturation BRET binding curves from membranes of Nluc-H1R HEK293 cells treated with
increasing concentrations of 10 in absence (black circles) or presence (red squares) of 10 µM mepyramine. The data shown are representative of five independent experiments performed in triplicate. (b and c) Inhibition of BRET signal in membranes of Nluc-H1R HEK293T cells treated with 25 nM 10 and increasing concentrations
of unlabelled ligands; tripolidine, loratadine, mepyramine and promethazine (b) or levocetirizine, fexofenadine, olopatadine and doxepin (c). Data were normalized to the maximal BRET ratio in each experiment. Data points are combined mean ± SEM from four separate experiments performed in triplicate (d). Membranes of HEK293T cells stably expressing Nluc-H1R treated with various concentrations of 10 were monitored by
BRET at room temperature every min for 30 min. All experiments using membranes expressing Nluc-H1R
[image:9.595.155.382.47.83.2] [image:9.595.156.552.161.412.2]www.nature.com/scientificreports/
Intracellular accumulation of fluorescent ligands has been previously observed as problematic with ligands for the β1 adrenoceptor17, cannabinoid CB
1 receptor20 and µ opioid receptor37.
We also synthesised a second series of fluorescent ligands based on a small molecule (VUF13816, MW = 267) that was first identified in a virtual screen of the H1R crystal structure34. Incorporation of peptide linkers and the
BODIPY630/650-X fluorophore onto this molecule resulted in three fluorescent ligands that retained similar affinity at the H1R to the parent compound (pKi= 8.2034). VUF13816 is structurally different from any other H1R
ligand, although molecular modelling indicated that it makes similar contacts in the receptor to doxepin34. There was little difference in the affinity of the three VUF13816-based fluorescent ligands, even though they contained more diverse peptide linkers than the mepyramine-based ligands. As with the mepyramine based derivatives, the VUF13816-based compounds were also suitable for confocal imaging. The success of these ligands, in particular those based on VUF13816, validates the combined virtual screening and ligand design as a more structured route to fluorescent ligand design.
Both the mepyramine and VUF13816 based fluorescent ligands used in the study had similar affinity val-ues to the parent compounds. However, for small molecule ligands for Class A GPCRs, addition of linker and fluorophore significantly increases the size and molecular complexity of the ligand. These compounds should therefore be treated as new pharmacological entities27, as often either increases28,36 or decreases45,46 in affinity are seen. Studies examining the influence of both the linker and fluorophore on the affinity of a fluorescent ligand have demonstrated that they can influence affinity in multiple different ways, with both the linker and flurophore playing a role in determining the final affinity of a compound27,28,36,38,47.
To further extend the use of the new fluorescent ligands to examine receptor binding kinetics, we examined their utility in a recently described NanoBRET proximity assay40. This assay utilises the extremely bright lucif-erase NanoLuc48 that is fused to the N-terminus of H
1R. The distance constraints of energy transfer49,50 mean
that BRET can only occur when the fluorescent ligand is in very close proximity to the receptor (i.e. <10 nm). Association kinetic binding assays using [3H]mepyramine indicated that the N/uc-H
1R showed similar binding
kinetics and affinity for mepyramine, suggesting that the N terminal tag did not significantly affect the receptor binding properties. The affinity of all six fluorescent ligands was measured using NanoBRET saturation assays, and the values obtained were consistent with those from radioligand binding and calcium assays. The affinities of eight unlabelled antagonists were also determined in competition binding assays using fluorescent ligands 10 and 23 as tracers. Two compounds, olopatadine and mepyramine, showed small but significant differences in their affinity depending on the fluorescent ligand used. Similar probe dependence has been observed previously for the adenosine A3 receptor40 and may reflect potential allosteric interactions across a dimeric interface24; the H1R has
been previously shown to form homodimers51.
The NanoBRET binding assay has the advantage that it is performed in intact cells that preserve the potential for allosteric interactions with intracellular signalling proteins10–12. In order to investigate the influence of an intact cellular environment on the affinity of unlabelled antagonists, NanoBRET assays were also performed in cell membranes. There was a general trend for the affinities obtained in membranes to be slightly higher than those deduced in intact cells. This may be due to the presence of phosphate in the buffer used for the membrane binding assays which has been shown to be a positive modulator of ligand binding at the H1R32.
It is becoming increasingly clear that determining binding kinetics is important in the development of new therapeutics9,52,53, and certain kinetic profiles are desirable depending on the disease being targeted54,55. The deter-mination of binding kinetics at a GPCR is often achieved through radioligand binding assays, where every time point requires a separate binding reaction that needs to be terminated before measurements can be made. This is time consuming and has led to the development of assays that allow continuous monitoring of binding, such as assays using a scintillation proximity assay for radioligands56,57. Greater resolution can be obtained, however, with proximity techniques such as the BRET assay used here or using fluorescence resonance energy transfer23,25. In the present study, the kinetic parameters of six fluorescent antagonists were determined. In equilibrium NanoBRET binding assays all of the fluorescent ligands showed similar affinities. However, the use of kinetics revealed that the VUF13816 based compounds had a slower off rate than their mepyramine counterparts. As a consequence, the VUF13816 based compounds had a residence time at the receptor that was circa four times longer than the mepyramine based compounds. The binding kinetics of compound 10 were also determined in membrane preparations where there were differences in both the association (19.64 × 10⁶ M−1.min−1 and 46.4 × 10⁶ M−1.
min−1; cells and membranes, respectively) and dissociation rate constants (0.065 min−1 and 0.214 min−1; cells
and membranes, respectively). Measuring the kinetics of a labelled compounds limits this to a small set of lig-ands for a given receptor, to overcome this the method developed by Motulsky and Mahan can be employed to determine the kinetics of unlabelled compounds. This was successfully achieved using the NanoBRET assay in combination with compound 10 for two unlabelled H1R antagonists, promethazine and loratadine. It was found
that both unlabelled ligand displayed similar koff rates but different kon rates which is reflected in their affinity at
equilibrium. The NanoBRET assay has also recently been used to resolve the kinetics of unlabelled ligands at the free fatty acid receptor 2 in cell membranes58. The ability to also perform these measurements in whole cells opens up the potential to assess the effect of cellular environments on rate constants as it has been shown that for some receptors that an intact cell environment can alter the binding kinetics59.
This study demonstrates the broad utility of fluorescent ligands for studying the H1R. The use of fluorescent
ligands and the NanoBRET assay allows multiple aspects of receptor pharmacology to be studied in ways that are difficult with traditional assays. These can provide important insights in the function of GPCRs and into the characteristics of lead compounds for drug discovery.
Methods
Sigma Aldrich. 6-(((4,4-Difluoro-5-(2-thienyl)-4-bora-3a,4a-diaza-s-indacene-3-yl)styryloxy)acetyl)aminohexa-noic acid, succinimidyl ester (BODIPY 630/650-X-SE) was purchased from Molecular Probes
®
(Invitrogen, UK). Unless otherwise stated, reactions were carried out at ambient temperature. Reactions were monitored by thin layer chromatography on commercially available pre-coated aluminium-backed plates (Merck Kieselgel 60 F254). Visualization was by examination under UV light (254 and 366 nm), or staining with KMnO4 dip. Flashchro-matography was performed using Merck Kieselgel 60, 230–400 mesh (Merck KgaA, Darmstadt, Germany) on a Biotage Flashmaster II system. 1H NMR spectra were recorded on a Bruker-AV 400 at 400.13 MHz or a Bruker
AV(II) 500 at 503.13 MHz. 13C NMR spectra were recorded on a Bruker AV(II) 500 with a dual (CH) cryoprobe at
125.8 MHz. Solvents used for NMR analysis (reference peaks listed) were DMSO-d6 ((CHD2)2SO at δH 2.50 ppm,
(CD3)2SO at 39.52 ppm) and CDCl3 (CHCl3 at δH 7.26 ppm, CDCl3 at 77.16). Chemical shifts (δ) are recorded in
parts per million (ppm). Coupling constants (J) are recorded in Hz and the significant multiplicities described by singlet (s), doublet (d), triplet (t), quadruplet (q), broad (br), and multiplet (m). Spectra were assigned using appropriate COSY, DEPT, HSQC and HMBC sequences. High resolution mass spectra (HRMS) – time of flight, electrospray (TOF ES +/−) were recorded on a Waters 2795 separation module/micromass LCT platform. RP-HPLC was performed using a Waters 2767 sample manager, Waters 2525 binary gradient module, and visual-ized at 254 nm and 366 nm with a Waters 2487 dual wavelength absorbance detector. Spectra were analyzed using MassLynx. Analytical reversed-phase high-performance liquid chromatography (RP-HPLC) was used to ensure that the purity of compounds tested in biological systems was ≥ 95% (the retention times (Rt) of these compounds
are reported). Analytical RP-HPLC was performed using a YMC-Pack C8 column (150 mm × 4.6 mm × 5 μm) at a flow rate of 1 mL/min, and using a method of 0–2 min 10% solvent B in solvent A, 2–25 min gradient of 10% to 90% solvent B in solvent A, 25–27 min held at 90% B in solvent A, 27–29 min gradient of 90% to 10% solvent B in solvent A, 29–33 min held at 10% solvent B in solvent A (solvent A = 0.05% TFA in H2O, solvent B = 0.05% TFA
in 9:1 v:v CH3CN:H2O).
Methyl 3-((2-((4-methoxybenzyl)(pyridin-2-yl)amino)ethyl)(methyl)amino)propanoate (2). Mepyramine (1) was purchased as the dimaleate salt. Prior to demethylation, mepyramine dimaleate salt was dissolved in dichloromethane and sequentially washed with saturated hydrogen bicarbonate and water. The dichlorometh-ane layer was dried over magnesium sulfate, filtered and the solvent evaporated under reduced pressure to give mepyramine free base as a colourless oil. Mepyramine (free base) (22.7 g, 79.5 mmol) was dissolved in 300 mL of 1,2-dichloroethane and a small amount (approx. 20–30 mg) of sodium hydrogen bicarbonate was added. The solution was cooled to 0 °C and 1-chloroethyl chloroformate (25 g, 175 mmol) was added in 5 equal portions over 2 h. The reaction mixture was then heated at 60 °C for 3 h. The solution was cooled to rt, filtered, and the filtrate evaporated under reduced pressure. Methanol (350 mL) was added to the orange residue obtained and the resultant solution refluxed for 2 h. The solvent was removed under reduced pressure, the residue treated with 2 M aq. sodium hydroxide solution and extracted three times with ethyl acetate. The ethyl acetate portions were combined, dried over magnesium sulfate, filtered and evaporated under reduced pressure to give the crude prod-uct as an orange oil. Purification by flash silica column chromatography (0.5% to 5% 7 M ammonia in methanol / ethyl acetate) gave N1-(4-methoxybenzyl)-N2-methyl-N1-(pyridin-2-yl)ethane-1,2-diamine (1.428 g, 5.27 mmol,
7%) as a colourless oil. 1H NMR (400 MHz, CDCl
3) δ 2.41 (s, 3 H, NHCH3), 2.80 (t, J= 6.6 Hz, 2 H, CH2CH2),
3.67 (t, J= 6.6 Hz, 2 H, CH2CH2), 3.76 (s, 3 H, OCH3), 4.70 (s, 2 H, CH2Ar), 6.48 (d, J= 8.6 Hz, 1 H, Ar pyridyl),
6.52 (m, 1 H, Ar pyridyl), 6.82 (d, J= 8.7 Hz, 2 H, Ar benzyl), 7.14 (d, J= 8.7 Hz, 2 H, Ar benzyl), 7.37 (m, 1 H, Ar pyridyl), 8.15 (m, 1 H, Ar pyridyl). 13C NMR (100 MHz, CDCl
3) δ 36.65, 48.28, 49.92, 51.51, 55.32, 106.03, 111.95,
114.04, 128.10, 130.69, 137.29, 148.04, 158.53, 158.70. HRMS calculated for C16H22N3O 272.1757 (M + H)+,
found 272.1740. To a stirred solution of N1-(4-methoxybenzyl)-N2-methyl-N1-(pyridin-2-yl)ethane-1,2-diamine
(1.428 g, 5.27 mmol) in 1,2-dichloroethane (8 mL) was added methyl acrylate (2.2 mL, approx. 26 mmol, approx. 5 equiv), and the mixture stirred at 80 °C for 3 h. The solvent was removed under reduced pressure to give an orange oil. Purification by flash silica column chromatography (0.1% to 0.5% 7 M ammonia in methanol / ethyl acetate) gave 2 (1.602 g, 4.49 mmol, 85%) as a pale yellow oil. 1H NMR (400 MHz, CDCl
3) δ 2.27 (s, 3 H, NCH3), 2.45 (t,
J= 7.2 Hz, 2 H, CH2CH2), 2.57 (t, J= 7.3 Hz, 2 H, CH2CH2), 2.73 (t, J= 7.2 Hz, 2 H, CH2CH2), 3.62 (t, J= 7.3 Hz,
2 H, CH2CH2), 3.65 (s, 3 H, CO2CH3), 3.78 (s, 3 H, OCH3), 4.69 (s, 2 H, CH2Ar), 6.44 (d, J= 8.8 Hz, 1 H, Ar
pyridyl), 6.52 (m, 1 H, Ar pyridyl), 6.84 (d, J= 8.6 Hz, 2 H, Ar benzyl), 7.16 (d, J= 8.6 Hz, 2 H, Ar benzyl), 7.37 (m, 1 H, Ar pyridyl), 8.16 (m, 1 H, Ar pyridyl). 13C NMR (100 MHz, CDCl
3) δ 32.61, 42.49, 46.49, 51.51, 51.64, 53.27,
54.66, 55.33, 105.83, 111.76, 114.01, 128.23, 130.89, 137.24, 148.12, 158.23, 158.71, 173.09. HRMS calculated for C20H28N3O3 358.2125 (M + H)+, found 358.2139.
3-((2-((4-Methoxybenzyl)(pyridin-2-yl)amino)ethyl)(methyl)amino)propanoic acid (3). To a stirred solution of 2 (1.602 g, 4.49 mmol) in THF at 0 °C was added dropwise a solution of 0.2 M aq. lithium hydroxide (8.98 mmol, 45 mL). The solution was stirred at 0 °C, monitored by LCMS, and after 2 h the reaction was complete. The solu-tion was adjusted to pH 7 using 1 M aq. HCl, gently evaporated under reduced pressure to constant volume (to remove the THF), and then freeze-dried to afford a white solid. Chloroform (approx. 100 mL) was added, the mixture sonicated, and then filtered. The filtrate was evaporated to dryness under reduced pressure, to yield approximately 2 g of white solid. To further desalt the sample, the solid was re-dissolved in chloroform and washed with water, the water layer extracted three times with chloroform, the chloroform extracts combined, dried, and evaporated to dryness to give 3 as a white solid (1.696 g). Assuming one equivalent of lithium chlo-ride, this gave 4.4 mmol, 90% yield. 1H NMR (400 MHz, CDCl
3) δ 2.45 (t, J= 6.1 Hz, 2 H, CH2CH2), 2.53 (s, 3 H,
NCH3), 2.89 (m, 4 H, CH2CH2, CH2CH2), 3.76 (s, 3 H, OCH3), 3.86 (t, J= 6.6 Hz, 2 H, CH2CH2), 4.60 (s, 2 H,
CH2Ar), 6.48 (d, J= 8.5 Hz, 1 H, Ar pyridyl), 6.56 (m, 1 H, Ar pyridyl), 6.83 (d, J= 8.4 Hz, 2 H, Ar benzyl), 7.11 (d,
www.nature.com/scientificreports/
(100 MHz, CDCl3) δ 30.43, 40.70, 44.89, 52.00, 53.38, 53.65, 55.36, 106.42, 112.62, 114.24, 128.05, 129.82, 137.58,
147.98, 157.89, 158.93, 174.20. HRMS calculated for C19H26N3O3 344.1969 (M + H)+, found 344.1951.
General Procedure A (Supplementary Figure 1a): Solid-phase synthesis of 7, 8, 9, 20, 21 and 22. 1,2-Diaminoethane trityl resin (substitution 1.2–1.7 mmol/g depending on batch) (200–350 mg, assume 0.34–0.60 mmol) was swelled in DMF for 4 h, drained, then a solution of the first Fmoc-amino acid (3 equiv), HBTU (3 equiv) and DIPEA (6 equiv) in DMF (approx. 3 mL) was added and left for 1–2 h. The resin was drained, washed with DMF, and double coupled using the same Fmoc-amino acid/HBTU/DIPEA coupling procedure. The resin was drained, washed with DMF, and a solution of acetic anhydride (500 µL) and DIPEA (500 µL) in DMF was added to cap any unreacted sites. The resin loading was estimated by determining the Fmoc-content of the resin and calcu-lated to be 0.5–0.7 mmol/g across different resin batches and experiments. The resin was then treated with three repeated cycles of 20% v/v piperidine in DMF for 10 min, washed with DMF, then the second Fmoc-amino acid (3 equiv rel. to resin loading) was coupled using HBTU (3 equiv) and DIPEA (6 equiv) in DMF (approx. 3 mL). The Fmoc groups was again cleaved using 20% v/v piperidine/DMF as described above, and then any additional amino acids (or Fmoc-4-aminobutyric acid) were added as required using the same HBTU coupling/Fmoc cleav-age standard solid-phase peptide synthesis procedure described above. After the last required amino acid was coupled and Fmoc deprotected, either the mepyramine derivative 3 or VUF13816 derivative 16 (1.1 equiv rel to resin loading) was coupled to the resin-bound peptide using HATU (1.1 equiv) and DIPEA (4 equiv) in DMF. The resin was washed with DMF then DCM, dried under nitrogen and vacuum, and the product cleaved from the resin using 5% TFA/DCM. The filtrate solvent was evaporated, and if the peptide contained t-butyl side chain protecting group(s), this residue was dissolved in 1:1 v/v DCM/TFA and stirred for 2–4 hours to allow for amino acid side-chain deprotection.
(S)-N-(2-aminoethyl)-2-((S)-2-(3-((2-((4-methoxybenzyl)(pyridin-2-yl)amino)ethyl)(methyl)amino)propanamido) propanamido)propanamide (7). 1,2-Diaminoethane trityl resin (560 mg) was reacted according to General Procedure A, and the crude resin-cleaved residue purified using preparative RP-HPLC to give 7 (166 mg) as a white solid. 1H NMR (400 MHz, DMSO-d
6) δ 1.20 (m, 6 H, ala CH3), 2.67 (t, J= 7.4 Hz, 2 H, COCH2), 2.83–2.87
(m, 5 H, NCH3, CH2NH2), 3.27–3.32 (m, 4 H, NHCH2, MeNCH2), 3.39 (m, 2 H, MeNCH2), 3.72 (s, 3 H, OMe),
3.90 (t, J = 6.5 Hz, 2 H, ArNCH2), 4.19 (m, 1 H, ala CH), 4.30 (m, 1 H, ala CH), 4.65 (s, 2 H, ArCH2), 6.66–6.73 (m,
2 H, ArH), 6.90 (d, J= 8.7 Hz, 2 H, ArH PMB), 7.15 (d, J= 8.7 Hz, 2 H, ArH PMB), 7.54 (m, 1 H, ArH), 7.92 (br s, 2 H, NH2), 8.08 (t, J= 5.5 Hz, 1 H, NHCH2), 8.12–8.15 (m, 2 H, ala NH, ArH), 8.40 (d, J= 7.8 Hz, 1 H, ala NH). 13C NMR (125 MHz, DMSO-d
6) δ 17.98, 18.09, 29.35, 36.46, 38.43, 43.47, 48.28, 48.38, 50.91, 51.87, 53.36, 55.08,
107.22, 112.68, 114.08, 127.99, 129.54, 138.40, 146.77, 157.10, 158.44, 168.90, 171.89, 172.76. HRMS calculated for C27H42N7O4 528.3293 (M + H)+, found 528.3271.
(S)-N-(2-aminoethyl)-3-hydroxy-2-((10 S,13 S)-1-(4-methoxyphenyl)-5,10,13-trimethyl-8,11-dioxo-2-(pyridin-2-yl)-2,5,9,12-tetraazatetradecan-14-amido)propanamide (8). 1,2-Diaminoethane trityl resin (222 mg) was reacted according to the General Procedure A to give the resin-cleaved crude 8 (120 mg) as a yellow oil. Analytical RP-HPLC and MS analysis showed approximately 50% of the sample to be the desired product and 50% the product but with the p-methoxybenzyl group cleaved. Therefore, a small amount of the crude 8 (10 mg) was puri-fied by preparative RP-HPLC to give a pure sample (4.4 mg, 7.2 µumol) free from any p-methoxybenzyl cleaved side-product. HRMS calculated for C30H47N8O6 615.3613 (M + H)+, found 615.3643. This purified material was
used to couple to BODIPY 630/650-X-SE.
N-((S)-1-(((S)-1-((2-aminoethyl)amino)-1-oxopropan-2-yl)amino)-1-oxopropan-2-yl)-4-(3-((2-((4-methoxy benzyl)(pyridin-2-yl)amino)ethyl)(methyl)amino)propanamido)butanamide (9). 1,2-Dichloroethane trityl resin (180 mg) was reacted according to the General Procedure A to give the resin-cleaved crude 9 (105 mg) as a white solid. The crude residue was purified using preparative HPLC to give 9 (65 mg) as a white solid. 1H NMR
(400 MHz, DMSO-d6) δ 1.20 (m, 6 H, ala CH3), 1.62 (m, 2 H, CH2), 2.13 (t, J= 7.4 Hz, 2 H, COCH2), 2.60 (t,
J= 7.1 Hz, 2 H, COCH2), 2.83–2.87 (m, 5 H, NCH3, CH2NH2), 3.04 (m, 2 H, NHCH2), 3.27–3.33 (m, 4 H, NHCH2,
MeNCH2), 3.39 (m, 2 H, MeNCH2), 3.72 (s, 3 H, OMe), 3.90 (t, J= 6.8 Hz, 2 H, ArNCH2), 4.14–4.26 (m, 2 H, ala
CH), 4.65 (s, 2 H, ArCH2), 6.66–6.71 (m, 2 H, ArH), 6.89 (d, J= 8.7 Hz, 2 H, ArH PMB), 7.15 (d, J= 8.7 Hz, 2 H,
ArH PMB), 7.53 (m, 1 H, ArH), 7.87 (br s, 2 H, NH2), 8.00–8.08 (m, 3 H, ala NH, ala NH, NHCH2), 8.12 (m, 1 H,
ArH), 8.19 (t, J= 5.4 Hz, 1 H, NHCH2). 13C NMR (125 MHz, DMSO-d6) δ 17.84, 17.85, 25.19, 29.30, 32.47, 36.43,
38.22, 38.44, 43.44, 48.35, 50.90, 52.06, 53.45, 55.07, 107.11, 112.67, 114.07, 127.96, 129.57, 138.26, 146.95, 157.21, 158.40, 168.96, 171.97, 172.27, 171.78. HRMS calculated for C31H49N8O5 613.3820 (M + H)+, found 613.3790.
General Procedure B: Synthesis of 10, 11, 12, 23, 24, 25 (Supplementary Figure 1b). The amine congener (as the TFA salt) was dissolved in methanol and Amberlyst 21 resin was added, the solution filtered and the filtrate evaporated to give the neutralized free amine congener. This free amine (1–5 equiv) was dissolved in DMF and BODIPY 630/650-X-SE (1 equiv) was added and the reaction stirred at rt for 2 h in the dark. The solvent was removed under reduced pressure and the residue purified by semi-preparative RP-HPLC.
6-(2-(4-((E)-2-(5,5-difluoro-7-(thiophen-2-yl)-5H-4λ4,5λ4-dipyrrolo[1,2-c:2′,1′-f][1,3,2]diazaborinin-3-yl)vinyl)
evaporated to give 10 (3.6 mg, 3.4 µmol, 57% yield) as a blue solid. HRMS calculated for C56H68BF2N10O7S
1073.5049 (M + H)+, found 1073.5050. Analytical RP-HPLC R
t= 18.8 min.
6-(2-(4-((E)-2-(5,5-difluoro-7-(thiophen-2-yl)-5H-4λ4,5λ4-dipyrrolo[1,2-c:2′,1′-f][1,3,2]diazaborinin-3-yl)
vinyl)phenoxy)acetamido)-N-((10 S,13 S,16 S)-16-(hydroxymethyl)-1-(4-methoxyphenyl)-5,10,13-trimethyl-8,11,14,17-tetraoxo-2-(pyridin-2-yl)-2,5,9,12,15,18-hexaazaicosan-20-yl)hexanamide (11). According to General Procedure B, the neutralized amine of 8 (2.2 mg, 3.6µmol) was reacted with BODIPY 630/650-X-SE (1 mg, 1.5 µmol) to give a blue solid. This was dissolved in methanol, filtered through a small column containing Amberlyst 21 resin, and the methanol evaporated to give 11 (1.0 mg, 0.86 µmol, 57% yield) as a blue solid. HRMS calculated for C59H73BF2N11O9S 1160.5369 (M + H)+, found 1160.5326. Analytical RP-HPLC Rt= 17.2 min.
5,5-difluoro-3-((E)-4-(((15 R,18 R)-1-(4-methoxyphenyl)-5,15,18-trimethyl-8,13,16,19,24,31-hexaoxo-2-(pyridin-2-yl)-2,5,9,14,17,20,23,30-octaazadotriacontan-32-yl)oxy)styryl)-7-(thiophen-2-yl)-5H-4λ4-dipyrrolo[1,2-c:2 ′,1′-f][1,3,2]diazaborinin-5-uide (12). According to General Procedure B, the neutralized amine of 9 (5 mg, 8.2 µmol) was reacted with BODIPY 630/650-X-SE (1 mg, 1.5 µmol) to give a blue solid. This was dissolved in methanol, filtered through a small column containing Amberlyst 21 resin, and the methanol evaporated to give 12 (0.7 mg, 0.6 µmol, 40% yield) as a blue solid. HRMS calculated for C60H75BF2N11O8S 1158.5576 (M + H)+, found
1158.5603. Analytical RP-HPLC Rt= 18.6 min.
tert-Butyl 4-(2-benzylphenoxy)piperidine-1-carboxylate (14). Potassium hydroxide (403 mg, 7.2 mmol), 2-benzylphenol (445 mg, 2.4 mmol) and tert-butyl 4-bromopiperidine-1-carboxylate (3.1 g, 11.8 mmol) were dis-solved in methanol (5 mL) and refluxed for 2 days. More potassium hydroxide (201 mg, 3.6 mmol) and tert-butyl 4-bromopiperidine-1-carboxylate (1.5 g, 5.7 mmol) were added and the reaction refluxed for a further day. The solvent was evaporated under reduced pressure and the residue dissolved in ethyl acetate. This was washed three times with 1 M NaOH aq. solution, once with saturated aq. brine, the ethyl acetate layer dried over MgSO4, fil-tered, and evaporated to give the crude product. This was purified using flash silica column chromatography (0 to 16% ethyl acetate in petroleum ether) to give 14 (246 mg, 0.67 mmol, 28% yield) as a colourless oil. 1H NMR
(400 MHz, CDCl3) δ 1.15 (s, 9 H, C(CH3)3), 1.74 (m, 2 H, CH2), 1.86 (m, 2 H, CH2), 3.41 (m, 2 H, CH2), 3.50 (m,
2 H, CH2), 4.02 (s, 2 H, ArCH2), 4.52 (m, 1 H, CH), 6.87–6.94 (m, 2 H, ArH), 7.17–7.30 (m, 7 H, ArH). 13C NMR
(100 MHz, CDCl3) δ 28.55, 30.47, 36.57, 40.45, 71.41, 79.62, 112.55, 120.62, 125.90, 127.48, 128.30, 128.88, 130.61,
131.13, 141.22, 154.94. HRMS calculated for C23H30NO3+ 368.2220 (M + H)+, found 368.2239.
Methyl 3-(4-(2-benzylphenoxy)piperidin-1-yl)propanoate (15). 14 (246 mg, 0.67 mmol) was dissolved in dichlo-romethane (4 mL) and trifluoroacetic acid (1 mL) was added. The mixture was stirred for 1 h at rt, then the solvent removed under reduced pressure, and the residue dissolved in ethyl acetate. The organic layer was washed three times was saturated aq. sodium bicarbonate, dried over MgSO4, and evaporated to give 4-(2-benzylphenoxy)
piperidine (178 mg, 0.67 mmol, quantitative) as a colourless oil. This was used without purification in the next reaction. HRMS calculated for C18H22NO+ 268.1696 (M + H)+, found 268.1699.
4-(2-benzylphenoxy)piperidine (170 mg, 0.64 mmol) was dissolved in DCM and neutralized by washing with saturated aq. sodium carbonate. The DCM layer was dried and the solvent removed under reduced pressure. This residue was dissolved in 1,2-dichloroethane (1 mL) and methyl acrylate (350 µl, 3.84 mmol) was added. The reaction was heated to 60 °C and stirred for 1.5 h. The solvent was removed under reduced pressure and the residue purified by silica flash column chromatography (petroleum ether, gradient of 0 to 30% solution of [5% 7 M ammonia in methanol in 95% ethyl acetate]) to give 15 (200 mg, 0.57 mmol, 89% yield) as a pale yellow oil.
1H NMR (400 MHz, CDCl
3) δ 1.83 (m, 2 H, CH2 pip), 1.95 (m, 2 H, CH2 pip), 2.36 (m, 2 H, CH2 pip), 2.52 (t,
J= 7.7 Hz, 2 H, CH2 ethyl), 2.61 (m, 2 H, CH2 pip), 2.70 (t, J= 7.7 Hz, 2 H, CH2 ethyl), 3.72 (s, 3 H, OMe), 4.00 (s,
2 H, ArCH2), 4.39 (m, 1 H, CH), 6.85–6.91 (m, 2 H, ArH), 7.12–7.30 (m, 7 H, ArH). 13C NMR (100 MHz, CDCl3)
δ 30.76, 32.36, 36.49, 50.11, 51.76, 53.66, 71.62, 112.59, 120.41, 125.84, 127.41, 128.30, 128.98, 130.60, 131.00, 141.36, 155.14, 173.14. HRMS calculated for C22H28NO3+ 354.2064 (M + H)+, found 354.2034.
3-(4-(2-Benzylphenoxy)piperidin-1-yl)propanoic acid (16). To a stirred solution of 15 (200 mg, 0.57 mmol) in THF (5 mL) at 0 °C was added dropwise a solution of lithium hydroxide in water (0.2 M, 1.14 mmol, 5.7 mL). The solution was stirred at 0 °C for 2 h, neutralized to pH = 7 using 1 M aq. hydrochloric acid, and the solvent removed under reduced pressure. The material was redissolved in water and freeze-dried overnight. Chloroform was added to the dried sample, and the sample filtered, the white solid washed with chloroform, the chloroform washings combined, dried over magnesium sulfate, and evaporated under reduced pressure to give 16 (180 mg, assuming one equiv. of LiCl salt, 0.47 mmol, 83%) as a pale yellow solid. 1H NMR (400 MHz, DMSO-d
6) δ 1.60
(m, 2 H, CH2 pip), 1.85 (m, 2 H, CH2 pip), 2.28–2.34 (m, 4 H, CH2), 2.50 (m, 2 H, CH2 ethyl), 2.54 (m, 2 H, CH2
pip), 3.88 (s, 2 H, ArCH2), 4.41 (m, 1 H, CH), 6.84 (m, 1 H, ArH), 6.95 (d, J= 7.9 Hz, 1 H, ArH), 7.11–7.25 (m, 7 H,
ArH). 13C NMR (100 MHz, DMSO-d
6) δ 30.14, 32.51, 35.72, 49.35, 53.60, 71.11, 112.93, 120.18, 125.70, 127.48,
128.15, 128.62, 129.97, 130.60, 141.15, 154.54, 174.29. HRMS calculated for C21H26NO3+ 340.1907 (M + H)+,
found 340.1941.
www.nature.com/scientificreports/
the isomer is resolved in the NMR, this is denoted with an *asterisk for the minor isomer. NMR was assigned using COSY and HSQC spectra. 1H NMR (400 MHz, DMSO-d
6) δ 1.20–1.23 (m, 9 H, ala CH3), 1.74 (m, 1 H,
CHH pip), 1.95 (m, 2 H, CH2 pip), 2.21 (m, 1 H, CHH pip), 2.58–2.70 (m, 4 H, CH2 pip, COCH2), 2.84 (m, 2 H,
H2NCH2), 3.16 (m, 2 H, pipNCH2), 3.27–3.31 (m, 4 H, NHCH2, CH2 pip), 3.87* (s, 2 H, ArCH2), 3.98 (s, 2 H,
ArCH2), 4.18 (m, 1 H, ala CH), 4.25 (m, 1 H, ala CH), 4.32 (m, 1 H, ala CH), 4.55* (m, 1 H, CH pip), 4.72 (m, 1 H,
CH pip), 6.91 (m, 1 H, ArH), 6.98 (d, J= 8.4 Hz, 1 H, ArH), 7.05* (d, J= 8.6 Hz, 1 H, ArH), 7.15–7.30 (m, 7 H, ArH), 7.84 (br s, 2 H, NH2), 7.92 (d, J= 7.3 Hz, 1 H, ala NH), 8.07 (t, J= 5.4 Hz, 1 H, NHCH2), 8.17 (d, J= 7.3 Hz,
1 H, ala NH), 8.39 (d, J= 7.0 Hz, 1 H, ala NH), 9.62* (br s, 2 H, NH2). 13C NMR (125 MHz, DMSO-d6) δ 17.81,
18.05, 18.19, 26.40, 28.18, 29.40, 29.62*, 35.57*, 35.97*, 36.42, 38.42, 47.29*, 47.38, 48.16, 48.29, 49.94, 50.03*, 51.28*, 52.08, 65.40, 69.98*, 112.24, 113.16*, 120.55, 120.91*, 125.76*, 125.83, 127.54*, 127.74, 128.17*, 128.36, 128.60, 129.51, 130.13*, 130.64*, 131.16, 140.95*, 141.37, 153.87, 154.22*, 168.56, 168.63*, 171.81, 172.08, 172.69. HRMS calculated for C32H47N6O5+ 595.3602 (M + H)+, found 595.3596.
(S)-N1
-(2-aminoethyl)-2-(2-(2-(3-(4-(2-benzylphenoxy)piperidin-1-yl)propanamido)acetamido)acetamido)succi-namide (21). 1,2-Diaminoethane trityl resin (250 mg) was reacted according to the General Procedure A, and the crude resin-cleaved residue purified using preparative RP-HPLC to give 21 (40 mg, 0.055 mmol) as a white solid. 1H NMR (400 MHz, DMSO-d
6) δ 1.75 (m, 1 H, CHH pip), 1.96 (m, 2 H, CH2 pip), 2.12 (m, 1 H, CHH pip),
2.52 (m, 2 H, asn CH2), 2.64–2.71 (m, 4 H, CH2 pip, COCH2), 2.87 (m, 2 H, H2NCH2), 3.18 (m, 2 H, CH2 pip),
3.27–3.37 (m, 4 H, NHCH2, pipNCH2), 3.74–3.80 (m, 4 H, gly CH2), 3.87* (s, 2 H, ArCH2), 3.98 (s, 2 H, ArCH2),
4.50 (m, 1 H, asn CH), 4.56* (m, 1 H, CH pip), 4.73 (m, 1 H, tyr CH), 6.91 (m, 1 H, ArH), 6.99 (m, 1 H, ArH), 7.04* (m, 1 H, ArH), 7.16–7.28 (m, 7 H, ArH), 7.48 (s, 2 H, asn NH2), 7.83 (br s, 2 H, CH2NH2), 8.04 (t, J= 6.0 Hz,
1 H, NHCH2), 8.16 (d, J= 6.8 Hz, 1 H, asn NH), 8.25 (t, J= 5.7 Hz, 1 H, gly NH), 8.48 (br m, 1 H, gly NH), 9.71*
(br s, 2 H, NH2). 13C NMR (125 MHz, DMSO-d6) δ 26.40, 28.21, 28.49*, 29.43, 29.65*, 35.61, 35.97, 36.41, 37.13,
38.69, 42.00, 42.07, 47.39, 48.61*, 49.79, 50.02*, 51.29*, 52.09, 54.93*, 65.43, 70.02*, 112.27, 113.18*, 113.64*, 116.03*, 118.41*, 120.56, 120.79*, 120.90*, 125.84, 127.58*, 127.74, 128.19*, 128.37, 128.61, 129.54, 130.14*, 130.64*, 131.15, 140.96*, 141.37, 153.89, 154.22*, 168.68, 169.28, 169.34, 171.60, 171.72. HRMS calculated for C31H44N7O6+ 610.3348 (M + H)+, found 610.3373.
(S)-N1-((S)-1-(((2 S,3
S)-1-((2-aminoethyl)amino)-3-hydroxy-1-oxobutan-2-yl)amino)-1-oxopropan-2-yl)-2-(3-(4-(2-benzylphenoxy)piperidin-1-yl)propanamido)succinamide (22). 1,2-Diaminoethane trityl resin (250 mg) was reacted according to the General Procedure A, and the crude resin-cleaved residue purified using preparative RP-HPLC to give 22 (55 mg, 0.07 mmol) as a white solid. HRMS calculated for C34H50N7O7+ 668.3766 (M + H)+,
found 668.3737.
N-((5 S,8 S,11 S)-15-(4-(2-benzylphenoxy)piperidin-1-yl)-5,8,11-trimethyl-4,7,10,13-tetraoxo-3,6,9,12-tetraaza pentadecyl)-6-(2-(4-((E)-2-(5,5-difluoro-7-(thiophen-2-yl)-5H-4λ4,5λ4-dipyrrolo[1,2-c:2′,1′-f][1,3,2]
diazaborinin-3-yl)vinyl)phenoxy)acetamido)hexanamide (23). According to General Procedure B, the neutral-ized amine of 20 (2.4 mg, 4 µmol) was reacted with BODIPY 630/650-X-SE (1.25 mg, 1.9 µmol) to give a blue solid. This was dissolved in methanol, filtered through a small column containing Amberlyst 21 resin, and the methanol evaporated to give 23 (1.4 mg, 1.2 µmol, 65%) as a blue solid. HRMS calculated for C61H73BF2N9O8S
1140.5358 (M + H)+, found 1140.5352. Analytical RP-HPLC R
t= 20.9 min.
(S,E)-2-(2-(2-(3-(4-(2-benzylphenoxy)piperidin-1-yl)propanamido)acetamido)acetamido)-N1
-(2-(6-(2-(4-(2-(5,5-difluoro-7-(thiophen-2-yl)-5H-4λ4,5λ4-dipyrrolo[1,2-c:2′,1′-f][1,3,2]diazaborinin-3-yl)vinyl)phenoxy)
acetamido)hexanamido)ethyl)succinamide (24). According to General Procedure B, the neutralized amine of 21(3 mg, 4.9 µmol) was reacted with BODIPY 630/650-X-SE (1.25 mg, 1.9 µmol) to give a blue solid. This was dis-solved in methanol, filtered through a small column containing Amberlyst 21 resin, and the methanol evaporated to give 24 (1.7 mg, 1.4 µmol, 73%) as a blue solid. HRMS calculated for C60H70BF2N10O9S 1155.5104 (M + H)+,
1155.5100. Analytical RP-HPLC Rt= 20.4 min.
(S)-2-(3-(4-(2-benzylphenoxy)piperidin-1-yl)propanamido)-N1-((15 S,18
S)-1-(4-((E)-2-(5,5-difluoro-7-(thiophen-2-yl)-5H-4λ4,5λ4-dipyrrolo[1,2-c:2′
,1’-f][1,3,2]diazaborinin-3-yl)vinyl)phenoxy)-15-((S)-1-hydroxyethyl)-2,9,14,17-tetraoxo-3,10,13,16-tetraazanonadecan-18-yl)succinamide (25). According to General Procedure B, the neutralized amine of 22 (3 mg, 4.5 µmol) was reacted with BODIPY 630/650-X-SE (1.25 mg, 1.9 µmol) to give a blue solid. This was dissolved in methanol, filtered through a small column containing Amberlyst 21 resin, and the methanol evaporated to give 25 (0.7 mg, 0.6 µmol, 37%) as a blue solid. HRMS calculated for C63H76BF2N10O10S 1213.5522 (M + H)+, found 1213.5541. Analytical RP-HPLC Rt= 20.5 min.
Computational modelling.
Construction of the 23-H1R model. The H1R crystal structure (PDB-codethe membrane (near the final part of the linker) and connected to the linker. The full 23 ligand was subsequently minimized while keeping the membrane and the protein rigid.
General Pharmacology Methods
Materials.
G418, Lipofectamine and Optimem were obtained from Life Technologies (Paisley, UK) and fetal calf serum from PAA Laboratories (Wokingham, UK). Furimazine was obtained from Promega (Southampton, UK). Fexofenadine and doxepin were from Tocris Bioscience (Bristol, UK). All other chemicals and reagents were obtained from Sigma-Aldrich (Gillingham, UK). GF/C plates, Microscint-O and [3H]mepyramine were fromPerkin Elmer (Waltham, MA,USA). 25-kDa linear polyethylenimine for transfection was from Poly- sciences (Warrington, PA, USA).
Generation of cell lines and cell culture.
The cDNA clone for the human H1R was obtained from theMissouri S&T cDNA Resource Centre (www.cDNA.org) and the H1-YFP was as used in Rose et al.26. Nluc-H1
was generated by amplifying the full length sequence H1R (with the methionine start signal removed) and
fus-ing it in-frame with the membrane signal sequence of 5HT3A receptor and Nluc. Chinese hamster ovary (CHO;
obtained from ATCC, Manassas, VA, USA) cells were transfected with cDNA encoding the H1R or H1-YFP
and human embryonic kidney (HEK293T; obtained from ATCC) cells were transfected with Nluc-H1 using
Lipofectamine (Life Technologies, Paisley, UK) according to the manufacturer’s instructions. Cells were cultured in medium containing 1 mg/ml G418 to select for successfully transfected cells. Clonal cell lines were subse-quently generated for both the H1R and H1-YFP transfected cells. CHO cell lines were maintained in Dulbecco’s
modified Eagles medium nutrient mix F12 (DMEM/F12) supplemented with 10% fetal calf serum and 2 mM L-glutamine at 37 °C in a humidified atmosphere of air/CO2 (19:1). HEK293T cells were maintained in Dulbecco’s
modified Eagles medium (DMEM) supplemented with 10% fetal calf serum. HEK293T cells were grown in the presence of 1% penicillin/streptomycin prior to transient transfection for [3H]-mepyramine ligand binding
studies.
[
3H]mepyramine saturation and competition binding.
All [3H]mepyramine binding studies wereperformed on HEK293T cells transiently transfected to express the human H1R. This was achieved as
fol-lows, two million cells were seeded per 60 cm2 dish and transfected the following day with pcDEF3-HA-hH 1R
or pcDEF3-Nluc-hH1R using 5 μg DNA, 30 μg 25-kDa linear polyethylenimine in 150 mM NaCl per dish as
described by Nijmeijer et al.64. Two days after transfection, cells were removed from the dish and washed in ice-cold phosphate buffered saline (PBS; 137 mM NaCl, 2.7 mM KCl, 10 mM Na2HPO4 and 2 mM KH2PO4). Cells
pellets were obtained by centrifugation at 1900 ×g for 10 min at 4 °C and stored at −20 °C until further exper-imentation. Cell pellets (expressing HA-hH1R) were reconstituted in HEPES buffered saline solution (HBSS;
145 mM NaCl, 5 mM KCl, 2 mM sodium pyruvate, 10 mM D-glucose, 10 mM HEPES, 1 mM MgSO4 and 1.3 mM
CaCl2; pH = 7.4 at 37 °C) and dounce homogenized by plunging the pestle 10 times (Tamson, Bleiswijk, The
Netherlands). For association binding experiments cells pellets (expressing either HA-hH1R or Nluc-hH1R) were
instead reconstituted in phosphate buffer as described in Bosma et al.65 For saturation binding 1–4 μg of the cell homogenate was incubated (37 °C, 4 hours) with increasing concentrations of [3H]mepyramine (1–130 nM)
both in the absence and presence of 10 µM mianserin to differentiate between total and non-specific binding. In competition binding experiments cell homogenate was incubated (37 °C, 4 hours) with 4 nM [3H]mepyramine
and increasing concentrations competitor as required. Association binding experiments were performed accord-ing to the method described previously65, briefly, cell homogenate was incubation at 25 °C for between 1 and 41 min using 4 different concentrations of [3H]mepyramine (0–5 nM) both in the absence and presence of 10 µM
mianserin to differentiate between total and non-specific binding. All ligand binding was performed under gentle agitation. Incubations were terminated by three rapid wash steps over GF/C filter plates using ice-cold 50 mM Tris-HCl buffer at pH7.4. Filter plates were dried at 52 °C before adding 25 μL Microscint-O per well. Finally, bound [3H]mepyramine was measured using a Wallac Microbeta counter (Perkin Elmer).
Intracellular calcium mobilization assay.
CHO H1R cells were grown to confluence in black-walled,clear-bottom 96-well plates. On the day of the experiment, media was replaced with 100 µl HBSS containing 2.5 mM probenecid, 2.3 µM Fluo-4AM (Life Technologies), 0.023% Pluronic F-127, 0.5 mM Brilliant Black BN and where required 100 nM of fluorescent antagonist. Cells were incubated in this Fluo-4 containing buffer for 45 min at 37 °C in the dark. Plates were then loaded onto a multi-well fluorometric imaging plate reader (FlexStation; Molecular Devices, Sunnyvale, CA) and Fluo-4 fluorescence was measured (excitation, 485 nm; emission, 520 nm) every 1.52 s for 200 s. HBSS or HBSS containing the required concentration of histamine was added after 15 s.