THE EFFECTS OF TEMPERATURE ACCLIMATION ON
THE EXPRESSION OF CONTRACTILE PROTEIN
ISOFORMS IN THE SKELETAL MUSCLE OF THE
COMMON CARP (CYPRINUS CARPIO)
Tony Crockford
A Thesis Submitted for the Degree of PhD
at the
University of St Andrews
1989
Full metadata for this item is available in
St Andrews Research Repository
at:
http://research-repository.st-andrews.ac.uk/
Please use this identifier to cite or link to this item:
http://hdl.handle.net/10023/14940
THE EFFECTS OF TEMPERATURE ACCLIMATION ON THE EXPRESSION OF CONTRACTILE PROTEIN
ISOFORMS IN THE SKELETAL MUSCLE OF THE COMMON CARP (Cyprinus carpio)
Submitted for the degree of PhD. at the University of
St. Andrews by;
ProQuest Number: 10167083
All rights reserved
INFORMATION TO ALL USERS
The quality of this reproduction is dependent upon the quality of the copy submitted.
In the unlikely event that the author did not send a com plete manuscript and there are missing pages, these will be noted. Also, if material had to be removed,
a note will indicate the deletion.
uest
ProQuest 10167083
Published by ProQuest LLO (2017). Copyright of the Dissertation is held by the Author.
All rights reserved.
DECLARATION
I hereby declare that the research reported in this
thesis was carried out by me and that the thesis is my own
composition. No part of this work has been previously submitted for a higher degree.
The research was conducted in the Department of Biology and Preclinical Medicine, United College of St. Salvator and
St. Leonard, University of St. Andrews, under the direction
of Prof. I. A. Johnston.
/7
/CERTIFICATE
I hereby certify that Tony Crockford has spent eleven
terms engaged in research work under my direction, and that
he has fulfilled the conditions of General Ordinance No. 2
CONTENTS
Declaration
Summary 1
Chapter 1 General introduction 3
Chapter 2 The parvalbumins of the white muscle from cold- and warm-acclimated carp
(Cyprinus carpio) 27
Chapter 3 Electrophoretic analysis of white muscle myofibrillar proteins from
carp (Cyprinus carpio) 56
Chapter 4 Peptide mapping of myosin heavy chains and actin from carp (Cyprinus carpio)
acclimated to a range of
temperatures 136
Chapter 5 General discussion 168
Acknowledgements 172
SUMMARY. Chapter 1.
Part A reviews the current knowledge of temperature acclimation in teleost fish,with particular emphasis on
skeletal muscle. There appear to be two types of response to low temperatures, dormancy or a homeostatic response. The homeostatic response serves to compensate for the reduced
reaction rate usually seen at lower temperatures. In some species both responses occur depending on the water
temperature.
Part B reviews polymorphism in muscle proteins. All the myofibrillar proteins have been shown to exist as isoforms, which are differentially expressed in muscle types and with
development. The isoforms expressed appear to be related to
the contractile properties of the muscle. Chapter 2.
The parvalbumin content, isoforms, and calcium binding characteristics were studied in the white muscle of 5®C and 25*C acclimated carp (Cyprinus carpio). The total
parvalbumin concentration was 0.61—0.68mmols/kg wet weight. Two calcium binding sites per molecule and a dissociation
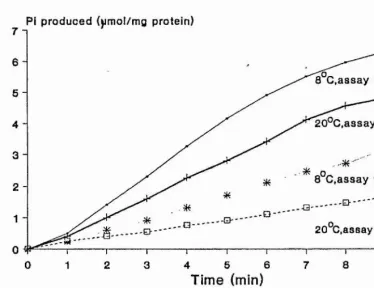
20*c acclimated carp (Cyprinus carpio) was shown to increase in cold-acclimated fish at both high and low assay
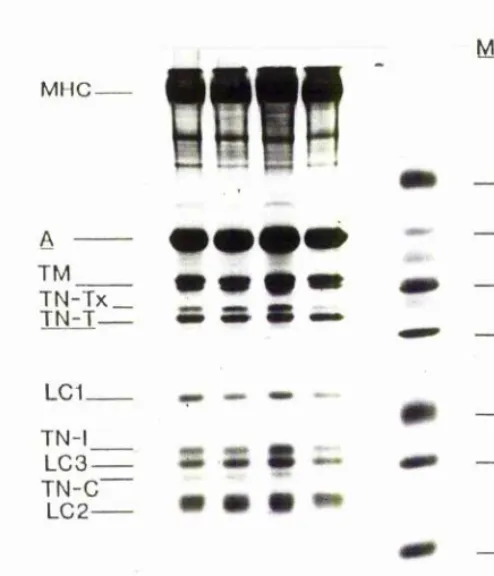
temperatures. Electrophoretic analysis of the myofibrillar
proteins showed a unique myosin light chain isoform to be present in cold-acclimated fish, and a unique troponin I isoform to be present in warm acclimated fish. The presence of tropomyosin and troponin T isoforms in carp white muscle
was also noted.
The (MLC3 + extra MLC):MLC1 ratio was found to be lower in
cold- than in warm-acclimated fish Chapter 4.
Myosin heavy chains and actin from the white muscle of carp (Cyprinus carpio) acclimated to 2*C, 5*C, 8*C, 11* C, 15*C, and 23*C were studied by peptide mapping. No
differences were found between fish from any of the
acclimation temperatures for either protein. Chapter 5.
The major findings of the study are discussed, in relation to the mechanisms that produce protein isoforms,
CHAPTER 1.
GENERAL INTRODUCTION
A; TEMPERATURE ACCLIMATION IN TELEOST FISH.
The rate of a chemical reaction is usually directly related to temperature, and in fish a decrease in water temperature leads to a corresponding decrease in body
temperature. In temperate fish, low water temperature leads to either dormancy or homeostatic responses which compensate
for the change in temperature with a time course of less than a second to more than a month. In some species both responses may occur, depending on the water temperature.
Whole animal metabolism.
Oxygen consumption, may be used as an estimate of total energy production, providing there is no net input from
anaerobic pathways, which is generally true for levels of activity that can be sustained for long periods. A number of measures of metabolic rate are commonly used (Fry, 1957; Doudoroff & Shumway, 1970). Standard or basal metabolic rate
plus any contribution from spontaneous activity. The active metabolic rate is the oxgen consumption at maximum
sustainable swimming speed. Sustainable swimming speeds are taken as those that can be maintained for 30-60mins (Brett, 1972). The aerobic scope for activity is the difference between the active and standard metabolic rate.
Locomotion in antarctic fish continues at temperatures below 0*C , but in most tropical species 15*C is the minimum
temperature for locomotion. Species found in similar water temperatures, but with different activity patterns and body shape may exhibit variation in active metabolic rates. For example, the active metabolic rate of the sockeye salmon
(Oncorhynchus nerka) (Brett, 1964) is 5-times that of the lemon sole (Microstomus kitt) (Duthie & Houlihan, 1982). These genetically fixed differences between species must be
taken into account when the effects of temperature on
metabolic rate are studied.
In the sockeye salmon (Oncorhynchus nerka) acclimation from 5 to 15° C produces a 4— fold increase in basal
metabolic rate and a 2—fold increase in active metabolism, compared with a 15— fold difference between basal and active metabolic rates. Above 15*C the active rate declines and
results in lower aerobic scope for activity (Brett, 1964). Largemouth bass (Micropterus salmoides) is a warmer water
temperatures between 15 and 30*C, but is lower at 35*C than at 30*C (Beamish, 1970). The temperature at which the
aerobic scope starts to decrease is possibly the point at which excessive energy demands of ventilation and
circulation restrict increased oxygen supply to the tissues (Jones, 1971).
Acclimatory responses are usually most marked in species that live in environments that exhibit a large seasonal variation in temperature. In the low water
temperatures of winter, some species cease feeding and
become relatively inactive, and are thought to enter a dormant state (Crawshaw, 1984). This is characterized by
extremely low metabolic rates that spare food reserves until prey numbers and water temperature increase in the spring,
as seen in the american eel Anguilla anguilla (Walsh et al. 1983). In other species, cold-acclimation, occuring over
several weeks, results in improved swimming performance at low temperatures relative to that of fish acutely exposed to
low temperatures. Both the above responses occur in acclimated largemouth bass (Micropterus salmoides), a dormant state is entered below 7° C while over the range
The standard and active metabolic rates of the goldfish (Carassius auratus) both show significant temperature
compensation responses (Kanungo & Prosser, 1959; Beamish & Mookherjii, 1964; Fry & Hochachka, 1970). However even in
fully acclimated individuals standard and active metabolic
rate decrease with a Qi o of 1.6-2.0 as water temperature is reduced (Fry & Hochachka, 1970).
Temperature acclimation in fish muscle.
Sustained swimming activity is largely supported by the recruitment of a relatively small volume of aerobic slow muscle fibres (Bone. 1978; Johnston, 1981). As speed
increases there is a sequential activation of slow > fast oxidative > fast glycolytic motor units (Johnston, Davison &
Goldspink, 1977). Reduction of water temperature from 20*C to 10* C decreases the recruitment threshold for fast
glycolytic fibres from 2.6 to 1.4 bodylengths/s (Rome, Loughna & Goldspink, 1984). This suggests that at 10*C the power necessary to sustain swimming speeds above 1.4
bodylengths/s cannot be provided by the slow oxidative
fibres alone. However following acclimation to 8*C the recruitment threshold speed for fast glycolytic fibres has been shown to increase (Rome, Loughna & Goldspink, 1985).
Changes in swimming performance and central patterns of muscle fibre recruitment with cold-acclimation are
associated with a major remodelling of the skeletal muscle. The fractional volume of aerobic fibre types is
significantly higher in cold- than warm-acclimated striped bass (Jones & Sidell, 1982), and goldfish, 1700 fast
oxidative glycolytic fibres/myotome for fish acclimated to 31*C compared withover 3000 for fish acclimated to 3*C
(Johnston & Lucking, 1978).
The activity of aerobic enzymes, when assayed at an intermediate temperature, has been shown to be higher in cold- than warm-acclimated fish in a variety of species,
including goldfish (Smit et 1974; Sidell, 1980), green sunfish (Shaklee et al. 1977), and common carp (Johnston,
Sidell & Driedzic, 1985). This in part results from the higher density of mitochondria in the muscles of
cold-acclimated fish. Mitochondria occupied 25% of slow fibre volume in crucian carp acclimated to 2*C, compared
with only 14% for fish maintained at 28*C (Johnston & Maitland, 1980), and in the slow muscle of goldfish the
similar amount of cytochrome c oxidase/mg of protein in mitochondria isolated from the slow muscle of cold— and warm-acclimated carp (Wodtke, 1981), and stereological
analysis of the surface density of the inner mitochondrial membrane in cold- and warm-acclimated goldfish (Tyler &
Sidell, 1984), suggest that cold-acclimation does not change the density of enzymes on the inner mitochondrial membrane. Changes in mitochondrial enzyme activity could occur as a result of the changes in membrane phospholipid composition that accompany temperature acclimation (Hazel, 1972; Van den Thillart & Modderkolk, 1978).
In crucian carp, cold-acclimation has been shown to result in relatively higher surface and volume densities of muscle capillaries (Johnston, 1982b), and a higher
mitochondrial volume density (Johnston & Maitland, 1980). These results taken together suggest an increase in the potential for aerobic ATP production in the muscle of low
temperature acclimated fish relative to acutely exposed fish. Assayed at intermediate temperatures the rate of
oxygen utilization of muscle fibres is higher for cold- than warm-acclimated fish. This is likely to result in a higher
active metabolic rate and an increase in the range of swimming speeds that can be sustained at low temperatures
(Fry & Hochachka, 1970; Rome et al. 1985).
from the recruitment of the fast muscle system (Johnston, 1981). Sprint activity is initially fueled by the hydrolysis of phosphocreatine stores, rapidly followed by the
activation of glycogenolysis resulting in the accumulation of lactic acid. In contrast to the results for aerobic
enzymes, the activities of glycolytic enzymes in muscle are generally unchanged by temperature acclimation (Shaklee ejt al. 1977; Sidell, 1980, Johnston et 1985).
The maximal enzyme activities in tissues from fish acclimated to 5 and 25*C in the laboratory have been
compared with those from winter and summer acclimatized fish from the wild (Kleckner & Sidell, 1985). It was found that
the general pattern of metabolic response to temperature was similar in acclimated and acclimatized fish, although the enzyme activity tended to be higher in the laboratory held rather than the wild fish. An exception was creatine
phosphokinase activity which increased in the slow muscle of the winter acclimatized compared with summer acclimatized
fish but did not change between acclimated fish. The
opposite result was found for creatine phosphokinase in fast muscle, and it was suggested that the differences were
following cold-acclimation (Johnston, Davison & Goldspink, 1975). The ATPase isolated from cold-acclimated goldfish was more susceptible to thermal dénaturation than the ATPase
from warm-acclimated fish (Johnston et a_l. 1975). This was the first demonstration of re-modelling of myofibrillar proteins of fish following cold-acclimation, and similar changes have now been reported in slow fibres in goldfish
(Sidell, 1980), and the fast muscles of common carp, tench, and roach (Heap ejt a_l. 1985).
The mechanical properties of single demembranated fast fibres from warm- and cold-acclimated common carp, assayed at 7*C, have shown that following cold-acclimation, fibres
develop twice the tension and have twice the unloaded contraction velocity of fibres from warm-acclimated fish
(Johnston et 1985). Starvation, leading to very low levels of protein synthesis, prevents this acclimatory response (Heap, Watt & Goldspink, 1986).
The thermal characteristics of the myofibrillar proteins in some eurythermal species do not appear to be
altered by acclimation, brook trout (Walesby & Johnston, 1981), rainbow trout (Penney & Goldspink, 1981), and
flounder (Johnston & Wokoma, 1986) are examples.
The energy stores in muscle are also affected by
temperature acclimation, more than double the glycogen concentration being found in muscle fibres from 2® C than
28*c acclimated crucian carp (Johnston & Maitland, 1980). The volume density of lipid droplets in slow muscle of the
B; POLYMORPHISM OF MYOFIBRILLAR PROTEINS.
Skeletal and cardiac muscle systems exhibit a very wide
range of variation in their physiological properties,
however the basic elements of contraction, the myosin thick filaments and actin thin filaments, are very similar in all muscles. The variation that exists is achieved by the
expression of different isoforms of the myofibrillar
proteins. Isoforms are defined as proteins that differ in their primary sequence, but their secondary, tertiary and quaternary structures are similar. Isoforms of a protein perform the same role, however their biological activities
may vary. Myosin.
Myosin exists as a polymeric protein of molecular weight about 460,000, consisting of two heavy chain's (MHC)
of molecular weight about 200,000, two P-light chains which may be phosphorylated (MPLC), and two alkali light chains
(MLC).
Myosin heavy chain (MHC) isoenzymes.
The myosin heavy chains have two distinct functional regions, the C-terminal half of the molecule is the region that forms the central filament of the thick filaments, the N-terminal half of the molecule forms the head that
protrudes from the thick filaments, and contains the site of
and actin molecules. The general structure of the MHC has been found to highly conserved (Kavinsky et 1983), but numerous isoforms of the MHC have been shown to exist, see Swynghedauw (1986) for a complete review.
In skeletal muscle there appear to be four major MHC isoforms, two developmental (embryonic and neonatal) and two
adult (fast and slow), (Whalen, 1985). Fast MHCs have been /
further divided into those found in white fast IIB fibres, MHCfB, and those found in red fast IIA fibres, MHCfA
(Salviati, Betto & Betto, 1982). The two fast MHCs have been found to coexist in single fibres of the rabbit (Staron & Pette, 1987b). Slow MHCs have also been subdivided into MHCsl and MHCs2, and in chickens the two types of slow MHC coexist, with the MHCsl isoenzyme being predominant
following hatching (Rushbrook & Stracher, 1979). Isoenzymes
of MHC have been shown in cardiac muscle, a homodimer of alpha-MHC is found in the atrium, while the ventricle contains both alpha-MHC and beta-MHC (Hoh et 1978). Molecular cloning data (Lompre et 1984), indicate that
ventricular beta-MHC is identical to slow muscle MHC, and is
differs from both fast and slow MHC {Rowlerson et 1981).
It would appear that there are at least eight MHCs isoforms, and the evidence that rat ventricular myosin exists as a MHC heterodimer may require the re-examination of previous results. Where the MHC content of a single fibre
was thought to be homogeneous, further isoforms of MHC may be found.
Myosin light chain (MLC) isoenzymes.
Two classes of myosin light chain are found in skeletal and cardiac muscle, the P-myosin light chains (MPLC) which can be removed from myosin by reaction with
5,5'-dithiobis-2—nitrobenzoic acid (DTNB) without loss of ATPase activity, and the alkali myosin light chains (MLC)
that cannot be removed from the myosin molecule without the
loss of ATPase activity (Perrie et 1973). The myosin
light chains are identified by a number which corresponds to their migration on SDS polyacrylamide electrophoresis, the
less mobile having the lower number.
Fast muscle contains contains three myosin light
chains, MLClf, MPLC2f, and MLC3f, of approximate molecular weights 25,000, 18,500, and 16,500 respectively. A fast myosin molecule will contain two MPLC2f, and either two
MLClf, two MLC3f or one MLClf and one MLC3f. This allows three isoforms of fast myosin with the homodimer of fast MHC
to exist, which may be seen by pyrophosphate gel
electrophoresis where fast muscle myosin runs as three
distinct bands (Lannergren, 1987). Slow muscle also contains three myosin light chains, MLCls, MLC2s, and MPLC3s, of
approximate molecular weights 27,500, 26,500, and 17,500 respectively, which, as in fast muscle, allows three isoforms of slow myosin to exist due to variation in the light chain content. The MWs of MLCls and MLC2s are very similar, 27,500 and 26,500 respectively, which leads to broad banding patterns on pyrophosphate gel electrophoresis, and, as yet, only two adult slow myosin isoforms have been detected in mammalian muscle {Staron & Pette, 1987b)
In cardiac muscle four light chains have been described, two in ventricular muscle MLClv and MPLC2v,
approximate molecular weights 27,500 and 19,000, and two in atrial muscle MLCla and MPLC2a, approximate molecular
weights 25,000 and 20,500 (Sartore e;t 1978; Hoh et al. 1978). In rat, MLClv appears to be similar or identical to
slow muscle MLCls (Hoh et 1978).
During development, fetal ventricles and atria contain
a specific light chain MLCemb that is similar if not
identical to MLCla and is probably a similar or identical light chain to that found in fetal skeletal muscle (Whalen et al. 1983). This light chain appears to be expressed in
Myosin isoenzymes.
Isoenzymes of the myosin molecule are called
isomyosins. The existance in both fast and slow muscle of two MHCs and three MLCs (Staron & Pette, 1987a; Billeter et
al. 1981), means that nine fast and nine slow isomyosins could exist. However, possibly due to the difficulty in resolving such similar molecules by electrophoresis under non-denaturing conditions, only four adult fast and two adult slow isomyosins have been detected (Hoh & Yeoh, 1979; Pinter et 1981; Lannergren, 1987). The study of single fibres by electrophoresis under denaturing conditions has demonstrated the coexistence of fast and slow myosin
subunits in single fibres (Salviati et sH. 1982, 1983;
Reiser et 1985; Staron & Pette,, 1987a, 1987b), and this
suggests that at least 60 theoretical isomyosins may exist (Staron & Pette, 1987b).
Actin.
Actin is the most strongly conserved of all the
myofibrillar proteins and is the only protein for which no isoforms have been found in fast and slow skeletal muscle
(Vandekerckhove & Weber, 1979). Only 5 of the total 375 amino acids vary between rabbit slow and bovine cardiac muscle (Vandekerckhove & Weber, 1979). This relative homology in structure suggests that the role of actin is
very similar in all muscle types and that alterations in the
biochemical properties of thin filaments are due to the presense of isoforms of the calcium regulatory proteins
(Dhoot & Perry, 1979), and not isoforms of the actin
molecule.
Tropomyosin (TM).
Tropomyosin molecules are dimers of two subunit each with a molecular weight of about 33,000. Two isoforms of TM were first described and named alpha-TM and beta-TM (Cummins & Perry, 1973) and were shown to differ at 39 amino acid
sites (Mak et 1980) leading to a small variation in
electrophoretic mobility on SDS PAGE, the beta-TM being the less mobile. In general, fast skeletal muscle, contains both alpha-TM and beta-TM, while slow skeletal muscle was thought to contains only beta-TM, until two additional iosforms of
tropomyosin,' gamma-TM and delta-TM were found to be present in the soleus muscle of rabbit (Heeley ejt aj^. 1983), the
four isoforms of TM may be resolved by the use of two
dimensional electrophoresis. It is not known if the TM dimer
can exist as a heterodimer, as well as a homodimer, of any of the four isoforms. Tropomyosin is not required for the
ATPase activity of purified actin and myosin (Lehman & Szent-Gyorgyi, 1972) but TM has been shown to be essential
shown. Variation between tissues is possibly related to the interaction between TM, and the troponin complex expressed in the muscle type. There is evidence for differences in the binding of troponin-T to the alpha-TM and beta-TM isoforms
(Perry, 1985). Phosphorylation of the TM isoforms is higher in foetal muscle than in adult muscle, suggesting a possible role for posphorylation of TM in development rather than in the regulation of contraction (Heeley et a_l. 1985).
Troponin complex.
Isoforms of all the components of the troponin complex are found. In most species a single isoform exists which is characteristic of either fast, slow, or cardiac muscle.
Troponin-C (TN-C).
Fast and slow isoforms of troponin-C, the Ca%+-binding
component of the troponin complex, are found in skeletal muscle. Cardiac TN—C has been shown to have the same amino
acid sequence as slow muscle TN-C. Fast TN-C contains two Ca%+ specific binding sites, while slow and cardiac TN—C
contain only one Ca^+ specific binding site (Potter & Johnson, 1982). The filling of the Ca%+ specific binding
sites is considered necessary to trigger contraction, thus fast muscle would require the uptake of two Ca%+ per TN-C molecule to activate contraction rather than the one
required by slow or cardiac muscle (Perry, 1985). Although
cardiac and slow TN-C possess the same amino acid sequence,
they may exhibit different Ca^+ binding characteristics in situ due to interactions with their respective troponin-I. Troponin-I (TN-I).
Troponin-I is the inhibitory component of the troponin complex which inhibits the ATPase activity of desensitized actomyosin (Wilkinson et al^ 1972). Fast, slow and cardiac muscle each contain a specific TN-I isoenzyme, and sequence
differences involving up to 40% of the amino acid sites have been shown between the three isoforms. However, the two
sites involved in interactions with TN-C and actin have been shown to be virtually identical in all three isoforms in
rabbit muscle (Wilkinson & Grand, 1978). Phosphorylation of fast and slow TN-I at two sites has been observed in vitro, however the extent of phosphorylation, and its possible role in modification of the action of TN-I in vivo is unknown
(Perry et a4. 1975). Cardiac TN-I however has an additional 26 amino acids at its N terminal. This region of cardiac
TN-I contains a serine residue at site 20 which is rapidly phosphorylated by cAMP-dependant kinase (Cole & Perry,
1975), and when isolated immediatly after death, cardiac TN-I possesses much more phosphate per molecule than does skeletal TN-I (Perry & Cole, 1974). In normally beating
cardiac TN-I increases the Ca%+ concentration required for 50% activation of actomyosin ATPase, and the phosphorylation is reversible and returns to normal following
beta-adrenergic stimulation (Perry, 1983, England, 1983). This suggests that phosphorylation of TN-I may play an
important role in the expressed activities of the various isoforms of TN-I, especially cardiac TN-I. Modification of the Ca2+ binding characteristics of the troponin complex may be dependent on interactions between TN-I and TN-C isoforms
and not just on the TN-C isoform present. Troponin-T (TN-T).
Troponin-T is the tropomyosin binding component of the troponin complex, it also binds TN-C in the presense of calcium (Ebashi et 1972).
TN-T exists as isoforms that are specific for fast, slow and cardiac muscle. In chicken fast muscle, three
isoforms of TN-T have been observed. One (MW 33,500) is present in breast muscle, two (MW 30,500 and 29,800) are present in the leg muscle (Wilkinson et 1984), and in rabbit skeletal muscle two fast and two slow isoforms of
TN-T have been observed. The two fast TN-T isoforms (TN-Tlf and TN-T2f) appear to be associated with different dimers of
TM, TN-Tlf with the alpha-beta-TM heterodimer and TN-T2f with the alpha-alpha-TM homodimer (Schachat ejt 1985).
Combinations of myofibrillar protein isoforms in muscle fibres.
From the study of single fibres, electrophoretically (Young & Davey, 1981, Pette & Schnez, 1977), histochemically and electrophoretically (Salviati et ad. 1982, 1983, Staron & Pette, 1987a, 1987b), their contractile properties and electrophoretically (Reiser et 1985, Lannergren, 1987), there appear to be five basic fibre types. The nomenclature used varies, but the most commonly used is; Type I the red
slow-twitch fibre, Type IIB the white fast-twitch fibre. Type IIA the red fast-twitch fibre, Type IIC the
intermediate fast-twitch fibre, and Type IC the intermediate slow-twitch fibre.
The general myofibrillar content of the various fibre types in adult skeletal muscle based on their histochemical
properties appears to be;
Type I fibres (ATPase staining after preincubation at
pH 4.3 and 4.5 high, and at pH 9.6 low) contain slow MHO, MLCls, MLC2s, MPLC3s, slow troponins I, C, and T, and
prédominently beta-tropomyosin.
Type IIB fibres (ATPase staining after preincubation at
1
Type IIA fibres (ATPase staining after preincubation similar to type IIB fibres, but with a high glycogen
content) contain MHCfA, MLClf, MPLC2f, MLC3f, and MLC2s, the troponin complex and the tropomyosin proportions are as
found in type IIB fibres.
Type IC fibres (ATPase staining present after
preincubation at pH 4.3, 4.5, and 9.6, but the pattern of staining resembles that of the type I fibres) contain
combinations of all the myofibrillar proteins with a predominance of the slow isoforms.
Type IIC fibres (ATPase staining present after
preincubation at pH 4.3, 4.5, and 9.6, but the pattern of staining resembles that of the type II fibres) contain combinations of all the myofibrillar proteins with a predominance of the fast isoforms.
The overall scheme appears to be that in slow muscle type I fibres predominate, and in fast white muscle type IIB
fibres predominate. However in intermediate muscles, and in muscle types previously thought to be of purely type I or
type IIB, a continuum of expression of the myofibrillar proteins is found (Salviati et 1982; Schachat et al.
1985; Lannergren, 1987; Staron & Pette, 1987a, 1987b; Greaser et ad. 1988).
Developmental changes in myofibrillar protein isoforms. During development different isomyosins are found in
skeletal muscle: embryonic and neonatal myosins (containing embryonic MHC, neonatal MHC, and embryonic MLC) were found to be different isomyosins to adult fast and slow myosins
(Hoh & Yeoh, 1979; Rushbrook & Stracher, 1979; Whalen e^ al. 1979, 1981). In rat and human muscle the sequential
appearence and disappearance of two neonatal isomyosins during development (Fitzsimons & Hoh, 1981, Bandman ^ al.
1982) has lead to the following sequence of isomyosin
expression being proposed (Whalen, 1985). Soon after their formation muscle fibres contain an embryonic myosin, which is replaced by a neonatal myosin. Following birth the adult myosin forms become established as the predominant forms.
There is little evidence for developmental changes associated with myofibrillar proteins other than myosin. It
has been shown that the beta-beta-TM homodimer may exist in early development (Dabrowska et a_l. 1977), and it is
proposed that during development the proportion of alpha-TM increases until it reaches the ratio of alpha-TM to beta-TM
found in the adult muscle (Amphlett et 1976). In the rat embryo presumtive fast muscle was found to stain with fast troponin antibodies only, while presumptive slow-muscle stains with both fast and slow troponin antibodies. The staining of slow muscle by fast troponin antibodies
The presense of neonatal and adult myosins in the same muscle, fibre of the rat (Butler-Brown ejt a^. 1982) suggests
that the mechanism for the transformation from neonatal to adult muscle involves the replacement of neonatal myosin with adult myosin within existing muscle fibres, rather than
the degeneration of neonatal type muscle fibres and their replacement with adult fibres.
Transformations between fast and slow fibre types.
The innervation of a muscle is an important determinant pf the .isoforms of myofibrillar proteins expressed. Cross innervation of one fibre type by nerves from another type, or direct stimulation of the muscle at the appropriate frequency has been shown to induce full or partial
transformation between fibre types. The myosin, troponin and tropomyosin isoforms present are those appropriate to the muscle type normally innervated by the nerve used. These
transformations have been shown for myosin (Buller ejb al. 1959; Barany & Close, 1971; Weeds et ad. 1974; Salmons & Streter, 1976), components of the troponin complex (Amphlett et al. 1975; Dhoot et a%. 1981), and tropomyosin (Heeley et
a%. 1983).
The role of myofibrillar protein isoforms in muscular
responses to exercise are not well understood. However in rat under an extensive exercise programme, a proportional
increase of type I. slow fibres, from 10% to 27%, in fast
type II muscles has been shown. Also, the number of type IIB fibres decreased, the number of type IIA fibres increased, and in the fast muscles an increased slow myosin light chain proportion was found (Green et ad. 1984). Conversion of
fibre type has also been demonstrated in young rats by
subjecting them to different levels of activity (Watt et ad. 1984). However as changes in isoforms of the myofibrillar proteins occur during development normally, it is uncertain whether the changes seen in young rats were due to
replacement of the fibre type within the muscle, or a change in the innervation of the muscle, which led to an altered developmental sequence being expressed (Goldspink & Ward, 1979; Goldspink, 1985).
Genetics of isoforms.
Isoforms of a protein may be produced in a various
ways. The isoforms may result from the transcription of different genes. The rat has seven HMC genes that have been cloned. These genes encode for embryonic, neonatal,
extraocular, fast IIA, fast IIB, ventricular/atrial, and ventricular/slow MHC isoforms. The isoforms are produced by the selective RNA transcription of these genes, in different muscles, and at different development stages (see Emerson &
Bernstein, 1987, for review).
showed that chicken MLCl and MLC3 could be produced from the same gene by the selective transcription of precursor RNA. The precursor RNA is then spliced, excluding certain
portions of the RNA to produce mRNAs for either MLCl or
MLC3. The control of differential transcription is presently unknown.
Isoforms of MHC may be produced from the same mRNA (Bandman ejt 1982). It was shown that the mRNAs for MHC in the posterior latissimus dorsi and pectoralis major
muscle produced identical MHCs in vitro, but in vivo peptide mapping showed the MHCs to be different. This suggests that post-translational modifications occur that give rise to the
MHC isoforms.
CHAPTER 2.
THE PARVALBUMINS OF THE WHITE MUSCLE OF COLD- AND WARM-ACCLIMATED CARP (CYPRINUS CARPIQ).
INTRODUCTION.
Parvalbumins (PVAS) are a group of acidic proteins with an approximate molecular weight of 12,000. They are found in the white muscle of lower vertebrates at a high
concentration of about ImM (Pechere et 1973). Their amino acid sequence contains little or no tyrosine or
tryptophan, which leads to little or no absorbance at 280nm,
and a distinctive UV absorbance spectrum.
Parvalbumins bind two calcium ions per molecule with a
high affinity (approx. kd = 10-?M), and the same sites have been found to bind Mg%+ with a lower affinity (Haiech et al. 1979a). Parvalbumins have been found to have extensive
sequence homologies with other calcium binding proteins, such as the myofibrillar Ca%+binding protein troponin C
(Collins, 1976; Perry, 1979b). PVAs are thought to to play an important role in the relaxation of muscle (Gerday & Gillis, 1976; Pechere ^ 1977). They have a higher
intracellular concentrations of calcium present in the cell
during relaxation the PVAs are thought to be fully bound with Mg%+. The rise in intracellular Ca%+ associated with
contraction leads to the dissociation of the Mg%+ and the binding of Ca^+ . It is thought to be the time necessary for the dissociation of the Mg%+ that prevents the PVAs
decreasing the intracellular Ca^+ before contraction has taken place. This important role in the relaxation cycle is thought to be necessary to allow relaxation before all the
Ca2+ has been resequestered within the sarcoplasmic reticulum.
METHODS.
Common carp (Cvprinus carpio) of length range 150-200mm
were acclimated over a period of 7-9 weeks. The water
temperature was gradually altered over a period of 1 week to
produce two populations of fish, at 5®C and 25®C. The fish were then held at this temperature for 6-8 weeks before
sampling. The light regime used was 12hr light:12hr dark. Preparation of parvalbumins.
The preparation of total parvalbumins from carp white muscle was adapted from the method of Pechere and Focant
(1965). All stages of the preparation of parvalbumins were performed at 0-4®C. The fish were killed by a blow to the head followed by decapitation. 0.6g of deep white muscle was
removed from the region between the dorsal fin and the lateral line, taking care to avoid any red or pink muscle. The muscle was homogenised in 8ml of extraction buffer, O.IM phosphate buffer pH 7.0 at 0®C, 0.05M NaCl, ImM
mercaptoethanol, for 3 x 30s using at Polytron homogeniser at speed setting 5. The homogenate was then centrifuged,
30,000g for lOmin, and the supernatant retained. The pellet was re—extracted twice more and the supernatants combined
chromatography column (2.6cm x 40cm) packed with Ultrogel ACA54 equilibrated with parvalbumin extraction buffer, at a flow rate of lOml/hr, at 4®C. 7ml of the parvalbumin extract was layered onto the column, and 4ml fractions were
collected. The fractions were scanned to obtain their UV spectrum at 240-280nm, using a Cecil automatic scanning spectrophotometer, and the calcium concentration of the fractions measured by flame spectrophotometery. The
distinctive UV spectrum and the calcium peak were used to identify the parvalbumin peak. The protein content was measured using the method of Lowry et ad. (1951) as
described in chapter 3. The parvalbumin content of the
original muscle sample was calculated, assuming a molecular weight of 12,000.
Electrophoresis of parvalbumins.
The molecular weight of the parvalbumin fractions was
estimated by electrophoresis on polyacrylamide gels in the presence of SDS. The gels used were composed of upper
stacking gels of 5% acrylamide, and lower separating gels of 15% acrylamide. Preparation and electrophoresis of SDS gels
is fully described in chapter 3. The standard molecular weight marker proteins of the Sigma MW-SDS-70L with a
molecular weight range of 14,200-66,000, and cytochrome C (MW 12,300) were used to estimate the molecular weight of the parvalbumins by the method of Weber & Osborn (1969) as
described in chapter 3.
The isoforms of parvalbumin were separated by non-denaturing alkali Tris-glycine polyacrylamide gel
electrophoresis. Preparation of the gels and electrophoresis was performed as described in chapter 3 for alkali—urea
gels, with the following exceptions (Blum et 1977). The pH of the gels was 8.6, and Ca%+ and urea were not included.
SDS gels were stained with coomassie blue to estimate molecular weight, and then stained with the Bio-Rad silver stain kit (see chapter 3) to check if there were any other
protein bands present. Alkali gels were stained with coomassie blue.
Samples for SDS electrophoresis were prepared by the addition to final concentrations of SDS 2%, glycerol 10%, 2-mercaptoethanol 1%, bromophenol blue 0.001%. The samples were heated to 100®C, for 3min, then cooled on ice. The
samples were used immediately, or stored at -25®C.
Samples for Tris-glycine electrophoresis were prepared
Densitometry of alkali gels.
Relative proportions of the parvalbumin isoforms were measured by scanning densitometry of the alkali gels using a Shimadzu CS-9000 densitometer. The gels were scanned at
550nm, and the peak areas calculated by the integral
computer. The proportion of an parvalbumin isoform present was calculated as the area under the appropriate peak
expressed as a percentage of the total area beneath all the peaks.
Calcium binding characteristics.
The dissociation constant ( k d i s s ) and the number of
calcium molecules bound per parvalbumin molecule, were
calculated using a flow dialysis method adapted from Haiech et a_l. (1979a) based on Colowick & Womack (1969).
Ultrapure water (Milli-Q) was used throughout the
calcium binding studies. To minimise calcium contamination, only plastic vessels were used and all equipment was washed in 10% nitric acid, then extensively rinsed with ultrapure water. Dialysis tubing was prepared by boiling in
neutralised EGTA, then washed thoroughly with ultrapure water.
Calcium was removed from the parvalbumins by dialysis at 4°C against 50 volumes of 0.15M KCL, 25mM Pipes (pH 7.3
at 25®C), lOmM EGTA, for 2 days, followed by dialysis at 4®C against 10 changes of 200 volumes of 0.15M KCl, 25mM Pipes
(pH 7.3 at 25®C) that had been passed through an ion
exchange column filled with Chelex 100 (Bio-Rad) to remove calcium ions (Haiech et 1979a). The calcium
concentration of the parvalbumins after dialysis, measured by flame spectrophotometry was found to be less than lOOnM.
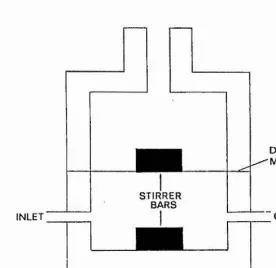
The flow dialysis cell (Fig. 1) consisted of two
chambers separated by a dialysis membrane. The volume of the upper chamber was 2.4ml, and the lower chamber 2ml. The cell was prepared by placing a small magnetic bar in the lower
chamber, then positioning a square of dialysis membrane to cover the lower chamber. The two halves of the cell were fixed together by bolts that passed through both halves of the cell, and a small magnetic bar placed in the upper
chamber. The lower chamber was filled by pumping buffer through the chamber whilst moving the cell to ensure all bubbles were removed. The cell was then placed in a water bath to equilibrate to the experimental temperature (5®C or
25® C).
The buffer used to flush the lower chamber was the same as that used to equilibrate the parvalbumins, and was held
INLET
STIRRER BARS
DIALYSIS •MEMBRANE
OUTLET
MAGNETIC STIRRER
Figure 1. Flow dialysis cell used to measure the Ca^+binding characteristics of parvalbumins. The upper chamber contained the 4 3Ca—parvalbumin sample. Buffer was collected from the lower chamber and the ^®Ca concentration measured. The
readings were used to estimate the dissociation constant and number of binding sites as described in the text.
[image:40.615.141.418.154.422.2]to equilibrate for Imin, then fractions of 3ml were
collected. Once six fractions had been collected, lOjul of 20mM CaClz was added to the upper chamber, to give a final concentration of 20^M Ca^+ . The Ca2+ addition was repeated every six fractions. Once the fractions from the
parvalbumins with 60pM Ca%+ had been collected, a final addition of 2jjl of IM CaClz was made and a further 10 fractions collected (see Fig.7, page 46 for example).
Colowick & Womack (1969) estimated that a steady state was set up once four times the volume of the lower chamber had been eluted. With a lower chamber volume of 2ml, and a flow rate of lOml/min, a steady state should be achieved by the time 8ml have been collected. Fractions of 3ml were
collected, so a steady state should have been reached after the third fraction. From each fraction 1ml was withdrawn and
added to 9ml of scintillant, and counted for 5min using a Packard Tri-Carb scintillation counter.
Counts per minute were plotted against fraction number (Fig. 7). The steady state that is reached following the
addition of non-radioactive Ca%+ is only dependant on the concentration of free ® Ca^ + , and not on the total Ca^ + in the upper chamber. The final addition of Ca%+ leads to a
38 41
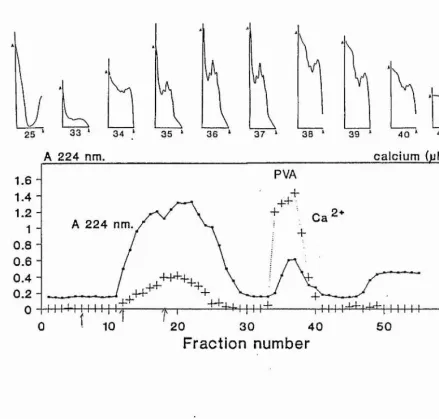
A 224 nm. calcium (jiM)
A 224 nm.
0.4
-0.2
-20 30 40
Fraction number
Figure 2. Various methods used to identify the fractions containing parvalbumins following gel filtration on Ultrogel ACA54. Absorbance measured at 224nm, the calcium
concentration, and the UV spectra between 240 and 280nm. The numbers below the UV spectra correspond to the fraction
[image:42.613.90.529.117.535.2]membrane was effectively the same as when all the Ca%+ was unbound. Thus the counts per minute at the steady state
following the final addition were taken to represent 100% of the Ca2+ in the free state. By dividing any other observed value by this maximum value, gives the fraction of Ca%» free at that concentration. Once the fraction of Ca%+ free at a give total concentration was known, then the bound Ca%+ concentration could be calculated. The bound concentrations
(B) were be plotted against bound/free (B/F) at a series of total concentrations (Fig. 8, page 47), (a Scatchard type
plot). The slope of this plot gave the dissociation
constant. The intercept on the bound axis gives the maximum molar concentration of calcium bound, which divided by the molar concentration of parvalbumin in the upper chamber gives the number of Ca^+molecules bound per parvalbumin
RESULTS.
A number of methods can be used to identify the PVA
peak following gel filtration (Fig. 2). The PVAs appear as a peak when the absorbance at 224nm was measured, but not at 280nm. The calcium concentration of the same fractions was high, and the position of the calcium peak suggests that it is associated with a larger molecule. Free calcium would be expected to appear in later fractions. This together with the distinctive UV spectrum, makes the identification of the fractions containing PVAs less subjective than absorbance at 224nm alone. The fractions containing the PVAs were combined and used in subsequent assays.
The mean concentration of PVAs in warm-acclimated carp was lower than that of the cold-acclimated carp, however the wide range of values obtained for both groups prevented any
significant difference being found (Table 1). Duplicate samples, prepared from separate muscle samples of the same animal gave consistant results, which showed that the
variation in measured PVA concentration was not due to the methods used. Alkali electrophoretic analysis of the muscle
extracts (Fig. 3), and purified parvalbumins (Fig. 4) showed the same banding pattern obtained by other workers (Pechere
et al. 1973, Gerday et 1979b). SDS electrophoresis of the purified PVAs (Fig. 5) showed them to migrate as a single band with an apparent molecular weight of
Acclimation Parvalbumin Range, temperature. concentration.
(oC) (Mean ± S.E)
5 0.684 ± 0.039 0.49-0.79
25 0.609 ± 0.045 0.39-0.78
Table 1. Total parvalbumin concentration in white muscle from 5®C and 25®C acclimated carp (mMol / Kg wet weight)
(n = 12 throughout). The difference between 5®C and 25®C
PVA4
PVA 3
PVA 2
PVA1
-A B O D E F G H I J
Figure 3. 10% Tris-glycine (pH 8.6) polyacrylamide gel of initial extraction of parvalbumins from white muscle of warm and cold acclimated carp. The lower portion of the gel
containing the parvalbumins is shown. The gel was stained with coomassie blue. Conditions of electrophoresis were as described in text.
Key; A, C, E, G, I, cold acclimated carp. B, D, F , H , J, warm acclimated carp. PVAl, PVA2, PVA3, PVA4, bands
corresponding parvalbumins 1, 2, 3, and 4.
-PVA4 -PVA3 -PVA 2
-PVAl
A B C D E F G H I J K L
Figure 4. 10% Tris-glycine (pH 8.6) polyacrylamide gel of parvalbumins, purified by gel filtration, from white muscle of warm and cold acclimated carp. Conditions of
electrophoresis were as described in text.
Key; A, C, E, G, I, cold acclimated carp. B, D, F, H, J, warm acclimated carp. PVAl, PVA2, PVA3, PVA4, bands
M.W.(X10 )
PVA
14.2
12.3
A B C D E F
Figure 5. 15% SDS polyacrylamide gel of parvalbumins from the white muscle of cold and warm acclimated carp, purified by gel filtration. Stained by both coomassie blue and silver stain. Molecular weights were determined by running proteins of known molecular weight as markers. Conditions of
electrophoresis were as described in text.
Key; A, C, E, purified parvalbumin samples from white muscle of cold acclimated carp. B, D, purified parvalbumin samples
from white muscle of warm acclimated carp. F, Sigma MW-SDS-70L marker proteins and cytochrome C (MW 12,300).
PVA, parvalbumin.
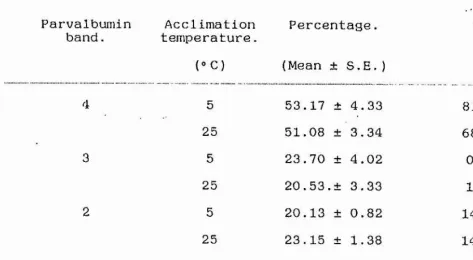
[image:48.616.139.447.74.360.2]approximately 12,300. There was much variation between the relative proportions of PVAl, PVA2, PVA3, and PVA4 seen with alkali electrophoresis, which showed no relationship to
acclimation temperature. This was clearly illustrated by the relative proportions measured by densitometric scanning
(Table 2). As with the total parvalbumin concentrations, the mean proportions of each PVA were not significantly
different between cold- and warm-acclimated carp. Variation in the proportions of the different PVAs was seen in both the muscle extracts and the purified PVAs, indicating that the differences are real and the relative proportions seen are present in the muscle, and are not an artifact brought
about by the purification method. Densitometric scans (Fig. 6) show that acclimation temperature does not lead to a particular distribution of the four PVAs, the cold— and warm-acclimated fish can show identical patterns. Gerday et al. (1979b) reported that in experiments to isolate the
individual PVAs from the lungfish, some specimens contained a low proportion of PVA3, and others a high proportion of PVA2. This indicates that variation of PVA components is not restricted to one sample or species, and is possibly a
common occurence.
Parvalbumin Acclimation Percentage. Range, band. temperature.
(® C) (Mean ± S.E. )
5 53.17 ± 4.33 81.3-31.2
25 51.08 ± 3.34 68.6-37.0
5 23.70 ± 4.02 0.0-40.7
25 20.53.± 3.33 1.9-36.5
5 20.13 ± 0.82 14.0-24.1
25 23,15 ± 1.38 14.8-31.2
5 1.71 ± 0.38 0.0-4.4
25 2.35 ± 0.41 0.0-5.7
Table 2. Percentage distributon of parvalbumins 1, 2, 3, 4, from white muscle parvalbumin fractions from 5®C and 25®C acclimated carp (n = 12 throughout). Densitometric scans of Tris-glycine, pH 8.6 PAGE gels.
[image:50.612.50.524.84.344.2](0
CO
<
t
MOBILITY DFigure 6. Densitometer traces of alkali-urea gels of
[image:51.615.143.371.14.504.2]C ounts/m in (Thousands)
Fraction number
6
5
4
3
2
IxlO'^M SOxlo'^M
1 SOxlO'll
40x10'®M
i---1---- i---- ,----
,---r-15 20 25 30 35 40 45 50
0
0 5 10
Figure 7. Plot of counts per minute against fraction from the analysis of the calcium binding characteristics of parvalbumins by flow dialysis. The ratio of bound to free calcium was calculated from the steady state reached
following each Ca^+ addition as described in the text. The inserted numbers show the total concentration of calcium following each addition.
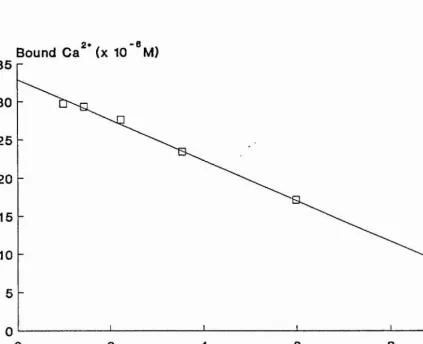
[image:52.614.37.438.105.460.2]Bound Ca^* (x 10 °M ) 35
30
25
20
15
10
10
4 2* 6 „
Bound Ca / Free Ca
80 2
Figure 8. Scatchard plot obtained from the data in figure 7 The bound Ca^+ and the bound/free Caz+ were calculated as described in the text. The dissociation constant was
[image:53.614.69.493.89.434.2]The Scatchard plot obtained {Fig. 8), showed very little deviation from a straight line, and the dissociation
constants and numbers of binding sites measured were highly reproducable (Table 3).
The values for the dissociation constants 2.17-2.42^ are within the range generally found ( 4jaM-0. IjjM) and the binding of 2 molecules of calcium per molecule of PVA has been
observed in many species (Pechere et 1971a, Benzonana et a%. 1972).
The calcium binding characteristics of cold- and
warm-acclimated carp (Table 3) show that there is little variation in either the dissociation constants, or the
number of binding sites at either assay temperature.
Acclimation temperature. (*C) b 5 25 25 Assay temperature (*C) 5 25 5 25 Dissociation constant (um).
(Mean ± S.E.)
2.42 ± 0.146 2.22 ± 0.159 2.32 ± 0.201 2.17 ± 0.188
Cq2 ♦ -binding
sites, (Mean ± S.E)
1.93 ± 0.069- 2.02 ± 0.087 1.91 ± 0.067 2.10 ± 0.207
DISCUSSION.
The total PVA concentration 0.6~0.7mM measured in the white muscle of cold- and warm-acclimated fish were similar
to that measured by Pechere et (1977) 0.53mM and in the range of other fish species, lungfish 0.2mM (Gerday et al. 1979b), coelacanth ImM (Hamoir et aj^. 1973), hake ImM (Baron, Démaillé & Dutruge, 1975). A correlation has been found between PVA concentration and speed of relaxation in different muscles of the guinea pig (Heizmann et aT. 1982). The PVA concentration in the sartorious (a fast muscle with a high relaxation rate) was 0.25g/Kg, while that of the soleus (a slow muscle with a low relaxation rate) was
<0.007g/Kg. In the muscle of different species the range of PVA concentrations is even larger. The mouse gastrocnemius, with a high relaxation rate contains 4.9g/Kg, whilst the
horse deep gluteal muscle with a low relaxation rate contains <0.001g/Kg (Heizmann et 1982). The same
correlation appears to exist in cardiac muscle, the PVA concentration of the rabbit heart is <0.Olj.imol/Kg (Baron, Démaillé & Dutruge, 1975) whilst that of the heart muscle of the shrew, which beats at 1000 beats/min, is 19jjmol/Kg (Le
Peuch et 1978). This suggests that an increase in the rate of relaxation may be accompanied by an increase in the concentration of PVAs. PVA concentration can change under conditions that produce a lower relaxation rate, denervation
of the rat extensor digitorum longus increased the
half-relaxation time from 9.4-19msec, and also resulted in a
20% decrease in the PVA concentration (Heizmann ejt al. 1982).
The rate of relaxation in the fin muscles of goldfish (Heap, Watt & Goldspink, 1987) and the myotomal white muscle of carp (Fleming, Altringham & Johnston, 1989) were shown to
increase following cold- acclimation. If the rate of
relaxation was dependant on the PVA concentration, then it would be expected to be higher in cold-acclimated fish. The results showed that there was no significant difference between the PVA concentrations of cold- and warm-acclimated carp white muscle. Therefore, although there may be a
correlation between the PVA concentration and the relaxation rate when different tissues are compared, and in the same tissue following denervation, an increase in relaxation rate was not accompanied by an increase in PVA concentration
following cold-acclimation.
The range of PVA concentrations found in both groups of
fish, and the reproducability of the results, suggest that the total PVA concentration alone, may not be an important factor in the relaxation cycle.
{Gosselin-Ray, Riront & Gerday, 1978; Brandts et 1977; lio & Hoshihara, 1984). In cod (Bhushana-Rao et 1969) and pike (Bhushana-Rao & Gerday, 1973) two isoforms were found, in hake three isoforms were found (Haiech et al. 1979b) and in the antarctic fish, Champsocephalus gunnari, five isoforms (Hamoir & Gerardin-Otthiers, 1979). The
isoforms of carp white muscle PVA were found to be present as 46% PVA4, 16% PVA3, 32% PVA2, and 6% PVAl by Le Peuch et
al. (1978) which is different to the approximate 52% PVA4, 21% PVA3, 21% PVA2, 2% PVAl found in this study, especially
in the relative proportions of the PVA2 and PVA3 isoforms. This difference could be due to a number of factors, the
assumption that the staining by coomassie blue is
proportional to protein concentration in this study, or the assumption that ^®Ca binds equally to all the PVAs (Le Peuch et al. 1978) may not be valid. From the ranges of values obtained in this study it seems possible that the variation could be due to differences in the carp stocks used to
measure the proportions of the PVA isoforms. There appeared
to be no variation in the mean proportions of the four PVA isoforms between the cold- and warm-acclimated fish.
The isoforms of carp PVA have different calcium binding characteristics (lio & Hoshihara, 1984). Their apparent
calcium binding constants decreased in the order, PVA2
(Kd =2.8x10⁸^1 ) > PVAl (Kd =1.25x10⁸ M -^ ) > PVA3 and PVA4
(Kd =4x10? M-1 ). The rate of response to a change in calcium concentration was also seen to vary between the isoforms, decreasing in the order PVA2 > PVAl > PVA5 > PVA3 (lio &
Hoshihara, 1984). If the different characteristics of the PVA isoforms are an integral part of their function in the muscle, it would be expected that their relative proportions
would be conserved. The individual variation observed in this study shows that the relative proportion of a PVA isoform is not fixed within a species. If all the PVAs isolated were in their active form, this would lead to the conclusion that the combined calcium binding characteristics of the total PVA fraction was not important in determining relaxation rates, otherwise large differences would exist between individuals.
The binding of 2 Caf+ per PVA, was in agreement with values found by other workers (Benzonana et al. 1972; lio & Hoshihara, 1984). The calcium dissociation constants
measured 2.17-2.42jjM are in the range generally found for
total PVAs 0.1“4^iM (Pechere et aT. 1971b; Benzonana et al. 1972). PVAs each contain a high and low affinity binding site, in carp the lowest affinity site is on PVA4
et al. 1979a). It would appear that the measured
dissociation constant was that of a combination of binding
sites. It would appear that the calcium-binding
characteristics of the total PVA fraction does not change with acclimation, when assayed at 5°C or 25®C.
The results suggest that the changes in relaxation rate seen in temperature acclimation are not accompanied by a change in total PVA concentration, expression of PVA
isoforms, or in the calcium binding characteristics of the
PVA fraction. These results would not appear to be consistent with the theory that relaxation rates are
dependant on PVA concentration (Heizmann et 1982), and that changes in PVAs are not the mechanism for the
acclimatory response of relaxation rates reported.
The variation in total PVA, and isoforms observed in individual fish has been seen previously. The absense of PVA3 in some carp but no variation in the other PVAs was seen on electrophoresis (Hamoir, Focant & Disteche, 1972). Considerable variation was reported in the proportions of
all five PVAs that could be isolated from individual lungfish (Gerday et 1979b).
This suggests that both the total calcium binding capacity, and the proportions of the various affinity
calcium-binding sites are not critical. Contraction is triggered by a rise in intracellular Ca%+ to lO^M, the
estimated total Ca^+ binding capacity of the PVAs is approximately 1.2mM (assuming two sites per PVA) thus allowing the binding of the Ca%+ associated with 120
contractions. The excess calcium-binding capacity present in carp white muscle may be the reason that the PVA
concentration does not need increase to allow higher
relaxation rates. This could be the reason no difference is observed in any of the PVA characteristics measured
CHAPTER 3.
ELECTROPHORETIC ANALYSIS OF WHITE MUSCLE MYOFIBRILLAR PROTEINS FROM COLD- AND WARM-ACCLIMATED
CARP (CYPRINUS CARPIO.)
INTRODUCTION.
The main division in fish myotomal muscle is between
the red and white fibres which are arranged in anatomically distinct regions (see Bone, 1978). Red fibres contain more
myoglobin, have a more extensive blood supply, a higher mitochondrial content, and smaller average diameters than white fibres (Bone, 1966). The ATPase activity of red fibres was found to be lower than that of white fibres in coalfish,
cod and plaice (Johnston, Frearson & Goldspink, 1972), brooktrout (Johnston & Moon, 1980), tuna (Johnston & Tota,
1974) and carp (Johnston, Davison & Goldspink, 1977). Histochemically red fibre ATPase activity was labile at
alkaline pH, whilst that of white fibres was less so (Johnston et 1974). The contractile properties of red
and white fibres are also different, red fibres having a lower Vmax than white fibres in dogfish (Johnston, 1982a; Bone et al.. 1986), tilapia (Flitney & Johnston, 1979), cod
(Johnston, 1982a), and carp (Granzier et al. 1983). In carp, fibres of intermediate properties, between red and white
fibres, can be distinguished histochemically by the alkaline stability of ATPase activity (Johnston et 1974; Akster, 1983). These fibres have been described as pink fibres and
have contractile properties between those of red and white fibres (Akster, 1985). Pink fibres appear to correspond to the type IIA, IIC and IC fibres of mammalian muscle
(Salviati, Betto & Betto, 1982; Betto, Zerbato & Betto, 1986; Staron & Pette, 1987a, 1987b),
The red and white muscle of fish have been shown to contain different myosin light chains. Studies on carp, pike, dogfish, mackerel and angler fish, by electrophoretic techniques, have shown a general pattern of 2 myosin light chains specific to red muscle (MLCls & MPLC2s), and 3 myosin
light chains (MLClf, MPLC2f & MLC3f) specific to white
muscle (Focant, Huriaux & Johnston, 1976; Focant, Huriaux & Vandewalle, 1983). The pink muscles appeared to contain the myosin light chains of white muscle (Focant, Huriaux &
Vandewalle, 1983). This pattern was basically the same a seen in other vertebrate muscle, however, two isoforms of
MLCls were found (Young & Davey, 1981; Salviati, Betto & Betto, 1982; Staron & Pette, 1987a, 1987b). The light chain pattern of the intermediate fibres has been been studied in mammals. Fibres with intermediate contractile properties
staron & Pette, 1987a, 1987b). There have been no previous studies on isoforms of the other myofibrillar proteins in fish. The presence of isoforms may be the mechanism for the acclimatory response to temperature seen in the contractile properties of carp white muscle (Altringham & Johnston,
1985; Fleming, Altringham & Johnston, 1989), and carp white muscle myofibrillar ATPase (Heap, Watt & Goldspink, 1985). The case for the molecular basis of acclimation being an alteration in the expressed isoforms of one or more proteins was supported by the lack of an acclimatory response in
starved carp, in which protein synthesis is reduced to a
very low level (Heap, Watt & Goldspink, 1986a).
The aim of this present study was to investigate the
presense of different isoforms of the myofibrillar proteins by the use of electrophoretic techniques.
METHODS.
Common carp (Cvprinus carpio) were obtained from
Humberside Fisheries (near Drifield, England) and held for several weeks in a re-circulated freshwater aquarium at
12-15°C prior to acclimation over a period of 7-9 weeks. The water temperature was gradually altered over a period of 1 week to produce two populations of fish, at 8°C and 20°C.
The fish were then held at this temperature for 6-8 weeks before sampling. The light regime used was 12hr light:12hr dark. The fish were fed ad libitum three times a day with commercial trout pellets. The total length and weight of the fish used were (mean + SD) 31 + 2.5cm, and 735 + 225g.
Preparation of myofibrils.
Fish were stunned by a blow to the head and then killed by decapitation. All the following procedures were carried out on ice. Fast muscle was removed from the dorsal epaxial region, care being taken to avoid superficial fast (pink)
and slow oxidative (red) fibres. Red muscle was removed from the region below the dorsal line, taking care to avoid the fast (white) and superficial fast (pink) fibres.
Myofibrils were prepared from the muscle immediately
following excision. The preparation of myofibrils was based on the method of Perry & Grey (1956). Muscle was minced with
placed on ice to cool between homogenisations. The homogenate was centrifuged at 6000g for lOmin, and the
pellet was washed and resuspended by a short homogenization at low speed, in 10 vol lOOmM NaCl, lOmM Tris-HCl pH 7.2. The homogenate was centrifuged at 6000g for lOmin, and the pellet washed a further 5 times, as described above. The pellet was resuspended in 20 vol of the wash buffer, and
centrifuged at 400g for 2min. The myofibrils were contained in the top 1/2 of the supernatent, they were carefully
removed with a pipette, and kept on ice.
An alternative method was used to check that all the soluble proteins were removed from the myofibrils, and that
the banding patterns produced on electrophoresis were not due to contaminating proteins that had not been totally
removed by the standard myofibril preparation technique. The method used a non-ionic detergent to dissolve the membranes
(Solaro, Pang & Briggs, 1971). 1% Triton X-lOO was included in the first two homogenization steps. The muscle was
homogenized in lOvol 1% Triton X-lOO, lOOmM NaCl, lOmM Tris-HCl pH 7.2, then left to stand for 30min before centrifugation at 6000g for lOmin. The pellet was
homogenized at low speed, in the same buffer and left to stand for 30min, then centrifuged at 6000g for lOmin. The
pellet was washed a further 5 times as described above.
Protein assay.
To obtain an accurate protein assay of myofibrils the
Macldy and Spooner (1970) adaptation of the method of Lowry et al. (1951) was used, as it ensured complete dissolution
of the myofibrils.
Stock solutions; 1. 2% Na deoxycholate, 2. 4% Naz COa ,
3. O.IM NaOH,
4. 2% Na tartrate,
5. 1% CUSO4 ,
6. 1 vol Phenol Folins reagent + 2 vol H2O,
7. A solution, stable for 1 day, was
prepared with 100ml stock 2 + 100ml stock 3 + 2ml stock 4 + 2ml stock 5.
50pl of sample, standard or appropriate blank was added to 0.45ml solution 1, and mixed well until the sample was fully solublised. 2.5ml of solution 7 was added, mixed well
Myofibril ATPase assay.
The ATPase activity was measured by the following method (White, 1982),
Solutions used;
A. Myofibril suspension, 0.5 mg/ml protein in lOOmM NaCl, lOmM Tris-HCl pH 7.2
B- Ca%+ buffer, 62.5mM Tris, 3.8mM MgCla , 0.2mM CaClz , pH
7.4 at 20° C.
C. EGTA buffer, 62.5mM Tris, 3.8mM MgCla , 0.2mM EGTA, pH 7.4
at 20° C .
D. 13.3% SDS, 0.12M EDTA, pH 7.0.
E. 0.5% (w/v) ferrous sulphate, 0.5% (w/v) ammonium molybdate, 0.5M HzSO4 , made fresh daily.
F. 20mM Disodium ATP at pH 7.0.
ATPase assays were carried out in water baths at 8°C
and 20° C .
As the myofibrils were in suspension, rather than
solution, it was important that all incubations were continually agitated to prevent precipitation of the myofibrils. In a small beaker, 1ml solution A was
pre-incubated, with 5.5ml of either solution B or C, for 5min. Before the ATPase reaction was started a 0.65ml sample was removed and placed in a test tube containing 0.25ml of
solution D, which stops any ATPase activity, then 0.1ml of solution F was added. This was the zero time incubation. The