1 Combination of (M)DSC and surface analysis to study the phase behaviour and drug distribution of ternary solid dispersions
Joke Meeus1, David J. Scurr2, Xinyong Chen2,Katie Amssoms3, Martyn C. Davies2, Clive J. Roberts2, Guy Van den Mooter1
1
Drug Delivery and Disposition, KU Leuven, Leuven, Belgium 2
Laboratory of Biophysics and Surface Analysis, School of Pharmacy, The University of Nottingham, Nottingham, United Kingdom
3
Pharmaceutical Companies of Johnson & Johnson, Janssen, Discovery Sciences, PD&S_PDM, Beerse, Belgium
* Corresponding author. Drug Delivery and Disposition, KU Leuven, Department of
Pharmaceutical and Pharmacological Sciences, Campus Gasthuisberg ON2, Herestraat 49 b921, 3000 Leuven, Belgium. Tel.: +32 16 330 304, Fax: +32 16 330 305, e-mail:
2
ABSTRACT
Purpose: Miscibility of the different compounds that make up a solid dispersion based formulation play a crucial role in the drug release profile and physical stability of the solid dispersion as it defines the phase behaviour of the dispersion. The standard technique to
obtain information on phase behaviour of a sample is (modulated) differential scanning calorimetry ((M)DSC). However, for ternary mixtures (M)DSC alone is not sufficient to
characterize their phase behaviour and to gain insight into the distribution of the active pharmaceutical ingredient (API) in a two-phased polymeric matrix.
Methods: MDSC was combined with complementary surface analysis techniques, specifically time-of-flight secondary ion mass spectrometry (ToF-SIMS) and atomic force microscopy (AFM). Three spray-dried model formulations with varying API/PLGA/PVP
ratios were analyzed.
Results: The distribution of the API in the ternary solid dispersions depended on formulation parameters. The extent of API surface coverage and therefore the distribution of the API over both polymeric phases differed significantly for the three formulations.
3 ABBREVIATIONS
AFM atomic force microscopy
API active pharmaceutical ingredient DDS drug delivery system
(M)DSC (modulated) differential scanning calorimetry HIV human immunodeficiency virus
PLGA poly(lactic-co-glycolic acid) PVP polyvinylpyrrolidone
Tg glass transition temperature
4 INTRODUCTION
Solid dispersions are an intensively investigated enabling technology to formulate poorly soluble drugs so as to improve their bioavailability (1–5). Phase behaviour of the different compounds plays a crucial role in this type of formulation as it will determine whether a given
drug-polymer combination will be present as a glass solution (molecular dispersion) or a phase separated system (amorphous-amorphous or amorphous-crystalline phase separation).
Hence, the phase behaviour will have an influence on the release profile and stability performance of such a formulation. The technique of (Modulated) differential scanning calorimetry ((M)DSC) is generally used to study the phase behaviour and miscibility of a drug
delivery system (DDS). Based upon the experimentally observed glass transition temperatures (Tgs) the phase behaviour and composition of binary drug-polymer mixtures can be estimated by a number of expressions such as the Gordon-Taylor, Fox or Couchman-Karasz equation. All of these equations are mathematical derivations on the same theme and were originally developed for ideal binary polymer systems (6). For binary pharmaceutical samples the
Gordon-Taylor equation is the most frequently used expression to describe the relationship between the Tgand sample composition (7). A similar expression for ternary mixtures has been developed but finds limited application due to the contradiction between the complexity of ternary mixtures and the assumptions made for this model equation (6). Therefore for ternary mixtures (M)DSC alone is not sufficient to characterize the composition of the
different phases present, as for a mixed phase it is virtually impossible to determine the weight fraction of each of the three compounds. Knowledge of the composition of the
different phases would inform on the distribution of a drug throughout the DDS. Inhomogeneous drug distribution, such as surface enrichment, can only be detected by comparing the bulk characteristics of that formulation to its surface properties, indicating the
5 Information on both phase behaviour and spatial drug distribution is indispensable as these characteristics can be decisive for the release characteristics of a solid dispersion. For example, phase behaviour might influence the release, as particles containing a poorly soluble
drug in the form of amorphous precipitates in the polymeric matrix are likely to have a slower release compared to ideal glass solutions where the drug is molecularly dispersed within a
matrix. Spatial drug distribution might also influence the performance of a solid dispersion. For instance, enrichment of drug at the surface results in an increased size or number of (amorphous) drug domains at the surface. This jeopardizes the increased solubility originating
from the (molecular) dispersion of the poorly soluble drug. In that way surface-bulk distribution of the drug will determine the release kinetics of the sample. Additionally surface
enrichment of an amorphous drug makes the solid dispersion more prone to surface crystallization and therefore might be detrimental to its stability. These issues highlight why surface characterization of solid dispersions is crucial in understanding how they perform with respect to dissolution and stability.
We have previously reported on the development of spray-dried polymeric microspheres for intramuscular injection for the long-term prophylaxis of infection with human immunodeficiency virus (HIV) (8,9). These shell structured microspheres contain two
biocompatible polymers, poly(lactic-co-glycolic acid) (PLGA) and polyvinylpyrrolidone (PVP) and are made up of a PLGA-rich surface layer and an underlying PVP-rich phase (8).
6 For the present study a poorly soluble active pharmaceutical ingredient (API) was dispersed in
these microspheres as a solid dispersion. The model drug used was an HIV protease inhibitor. Three model formulations with varying ratios of API/PLGA/PVP were developed. As mentioned above, after inclusion of the API the composition of the mixed phases cannot be
determined by (M)DSC. To discern the distribution of the API in the microspheres and thus the ternary solid dispersions, (M)DSC was combined with surface analysis techniques,
namely ToF-SIMS and AFM. The potential of this combination lies in the complementarity of the techniques. (M)DSC is a bulk thermo-analytical technique, whereas ToF-SIMS is a surface mass spectrometry technique capable of analyzing the top 1-2 nm. AFM enables
spatial characterization of topographic and mechanical properties of a sample surface at nanoscale resolution.
For ToF-SIMS analysis, chemical identification of different compounds at the sample surface is based upon the detection of secondary ions, including molecular species or fragments
derived from these compounds. Besides chemical identification, this technique can also provide information on spatial distribution of compounds at the sample surface via ToF-SIMS
chemical imaging. The utility of ToF-SIMS for the analysis of solid dispersions lies mainly in its potential to reveal the spatial distribution of drug and excipient at the sample surface (9– 12). Evidently, this information is indispensable for complete characterization of solid
dispersions. Homogeneous mixing, at least at the resolution of the ToF-SIMS data (on the order of microns) is assessed by uniformity of the drug and polymer distribution at the sample
surface.
The main contribution of AFM for the analysis of solid dispersions lies in its potential to
7 technique is not yet that frequently used for the characterization of pharmaceutical samples, it
exhibits great potential as various mechanical properties (eg. stiffness, adhesion and friction) can be monitored to distinguish different compounds.
This study aims to clarify drug distribution in a multi-phased polymeric system. To do so, for the first time, (M)DSC was combined with ToF-SIMS and AFM to characterize the phase
behaviour of ternary solid dispersions.
MATERIALS AND MATHODS
Materials
Poly(lactic-co-glycolic acid) (PLGA) (lactide:glycolide molar ratio of 75:25, inherent viscosity of 0.2 dl/g) was purchased from PURAC Biomaterials (Gorinchem, The Netherlands). Polyvinylpyrrolidone K30 (PVP K30) (MW 44-54 kDa) was kindly donated by
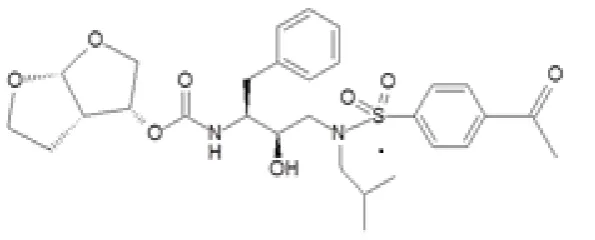
BASF (Ludwigshafen, Germany). The API was a poorly soluble HIV protease inhibitor provided by Janssen (Beerse, Belgium) and its structure is shown in Figure 1.
[image:7.595.73.371.581.701.2]Dichloromethane (DCM) was provided by Fisher Scientific (Leicestershire, United Kingdom).
8 Methods
Spray drying
Three model ternary solid dispersions made up of API, PLGA and PVP were prepared by spray drying and had the following composition: 10/75/15, 20/50/30 and 30/25/45 wt%
API/PLGA/PVP. Samples were spray dried with a Micro Spray lab scale spray dryer (ProCepT, Zelzate, Belgium) starting from a 5% feed solution in dichloromethane (DCM).
The inlet temperature was set to 115°C and the feed rate was 6 mL/min. The co-current drying air had a flow rate of 0.2 m³/min and the atomizing air was supplied with a pressure of
1.25 bar.
Modulated differential scanning calorimetry
The bulk miscibility behaviour of the spray-dried microspheres was determined by MDSC (Q2000, TA Instruments, Leatherhead, UK). Thermal Analysis Software (Version 4.4A) was used to analyze the obtained data. Crimped aluminum pans (TA Instruments, Brussels,
Belgium) were selected for the analysis of the samples. An empty pan was used as a reference and the masses of the reference pan and of the sample pans were taken into account. The DSC
cell was purged with a nitrogen flow rate of 50 mL/min.
Indium and octadecane were chosen for temperature calibration. The enthalpic response was calibrated with indium. The modulation parameters used were a heating rate of 1°C/min, a
period of 40 s and an amplitude of 1°C. Calibration of the heat capacity was done using sapphire. Samples were analyzed from -20°C to 220°C. Glass transitions were analyzed in the
reversing heat flow signals.
9 SEM was used to study the morphology and particle size of the samples which were prepared
by fixing an amount of powder on an aluminum stub using double-sided carbon tape. The samples were coated with a gold-palladium mixture by sputtering for 45 s at 20 mA. Field emission gun scanning electron micrographs (FEG-SEM) were taken by using a Philips XL30
ESEM-FEG instrument (Philips, Eindhoven, The Netherlands) at an acceleration voltage of 10 kV.
Time-of-flight secondary ion mass spectrometry
Spray-dried samples were adhered to double-sided adhesive tape in order to produce an
immobile surface suitable for ToF-SIMS analysis. The data were acquired using a ToF-SIMS IV instrument (ION-TOF GmbH) equipped with a bismuth liquid metal ion gun and a
single-stage reflectron analyzer. Typical operating conditions utilised a 25 kV Bi3+ primary ion source with a pulsed target current of approximately 0.3 pA. A flood gun producing low energy electrons (20 eV) was used to compensate for surface charging caused by the
positively charged primary ion beam on the insulating sample surface. A 4 mm × 4 mm area of each sample was raster scanned at a resolution of 100 pixels per mm. PLGA and PVP were
identified using C6H7O4- (m/z = 143), and C5H8O- (m/z = 84) respectively. The API was characterized by C8H7SO3- (m/z = 183). Prior to sample analysis, reference materials were analyzed and the characteristic ion peaks C6H7O4-, C5H8O- and C8H7SO3- were selected and
only present in PLGA, PVP and API respectively. Negative polarity ToF-SIMS spectra showing the markers for API, PLGA and PVP are shown in Figure 1 of the Supplementary
Information. Static conditions were ensured by keeping the total primary ion beam dose for every analyzed area below 1 × 10¹² ions/cm² throughout the analysis. Data in the negative secondary ion polarities were collected and analyzed using SurfaceLab 6 software (IONTOF).
10 peak was normalized to the total intensity count to enable a semi-quantitative comparison of
the different samples.
Atomic force microscopy
The spray-dried powders were applied onto a fresh mica surface using a Gilson pipette tip, and slightly blown with pressured nitrogen gas. Freshly cleaved mica (Agar Scientific,
Stansted, U.K.) was used as sample substrate. Samples were imaged with a Bruker Dimension FastScan Bio AFM in PeakForce Quantitative Nano-Mechanics (QNM) mode (Bruker UK Ltd, Coventry, UK). Tap150A (also called as MPP-12120, Bruker) tips (5 N/m, 150 kHz,
rotated tip, aluminum reflective coating) were used for Peak Force imaging.
PeakForce QNM is a novel development in AFM techniques. Whilst the tip is driven
oscillated at its resonant frequency in the traditional Tapping mode, the tip taps the sample surface at a frequency substantially lower than its resonant frequency in PeakForce mode, for example, 2 kHz vs 150 kHz in the present case. The vertical position of the AFM tip is
maintained under continuous active control allowing an accurate constant maximum contact force whilst maintain nanoscale spatial resolution (17). The active cantilever control allows a
simultaneous extraction of quantitative information related to surface properties such as stiffness and adhesion alongside the traditional topographic data (18). To calculate sample stiffness from the tip-sample interaction force data the Hertzian based DMT
(Derjaguin-Muller-Toporov) model was applied which assumes the contact is between a rigid sphere (the silicon AFM tip apex) and a soft flat surface (the polymeric microparticle). Gwyddion
11 RESULTS
Morphological characterization of microspheres
The particle size and surface morphology of the microspheres of the different formulations were compared via SEM. Although a statistically significant number of particles were not
analyzed, SEM could be used as an indicator for both particle size and morphology. Figure 2 shows that there are no striking differences regarding particle size and morphology when
[image:11.595.75.524.319.432.2]comparing the three model formulations. Particles are spherical, with a smooth, intact surface and an estimated diameter approximately between 1 µm and 7 µm.
FIGURE 2 Scanning electron micrographs of the model formulations with following API/ PLGA/PVP (w/w/w) ratios: (a). 10/75/15, (b). 20/50/30 and (c). 30/25/45.
Phase behaviour
MDSC was used to determine the Tgs of the pure compounds, which were 38°C for PLGA, 56°C for the API and 174°C for PVP under the given experimental conditions. The phase behaviour of the model formulations was examined and the resulting thermograms are
12 FIGURE 3 MDSC of the model formulations. From top to bottom reversing heat flow with following API/PLGA/PVP (w/w/w) ratios: (a). 10/75/15, (b). 20/50/30 and (c). 30/25/45.
Surface chemical analysis
ToF-SIMS was used to chemically analyze the surfaces of the microspheres and hence solid dispersions. The spatial distribution of the API and PLGA at the sample surface is represented in Figure 4. There is a negligible amount of PVP observed at the particle surface which is
consistent with previous studies (8,9) and depicted in Figure 2 of the Supplementary Information. At the micron-scale resolution of the ToF-SIMS data the drug seems to be
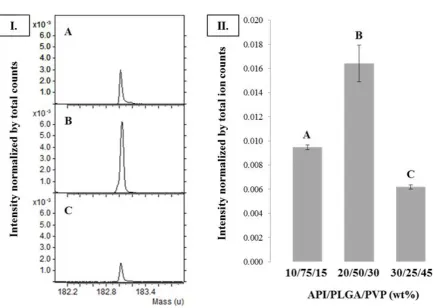
homogeneously distributed at the surface of the three model formulations. For the formulation containing 20 wt% API a significantly higher intensity for the marker of the API is observed.
Figure 5 illustrates the measured API intensity at the sample surface and hence depicts a measure of API surface coverage for the three model formulations. Ranking of the
[image:12.595.72.439.72.324.2]13 30/25/45 < 20/50/30 < 10/75/15 API/PLGA/PVP wt%. Hence the appearance of API at the
particle surface is not in agreement with the total amount of API present in the microparticles, e.g. formulation 30/25/45 API/PLGA/PVP wt% has the highest bulk concentration of API (30 wt%) but shows the lowest surface coverage compared to the other model formulations.
FIGURE 4 ToF-SIMS secondary ion intensity images of the model formulations with the following API/PLGA/PVP (w/w/w) ratios: (a). 10/75/15, (b). 20/50/30, (c). 30/25/45. Panels a
show results of the total intensity signal. Panels b and c show negative polarity images of respectively API (m/z=183) and PLGA (m/z= 142). Panels d show the negative polarity
overlay images (PVP in red, PLGA in green) (4 mm×4 mm scan size).
Surface topographical analysis
[image:13.595.68.521.183.483.2]14 20/50/30 and 30/25/45 API/PLGA/PVP wt% samples. The 3D data emphasize that these
images are acquired from the apex of immobilized microspheres. The 2D representation following the background subtraction of the image curvature reveals surface structure in details. For the 10 wt% and 30 wt% API samples little surface topographic variation is
observed with a smooth homogeneous surface evident (Fig. 6A-B, Fig. 8A-B). The 20 wt% API sample shows significant heterogeneity in surface topography (Fig. 7A-B). Similarly the
[image:14.595.80.515.282.590.2]corresponding stiffness maps only show significant heterogeneity in the 20 wt% API sample (Fig. 6C, 7C, 8C).
FIGURE 5 I. Negative ToF-SIMS spectra at m/z 183 (marker API) of the model formulations with the following API/PLGA/PVP (w/w/w) ratios: (a). 10/75/15, (b). 20/50/30, (c). 30/25/45.
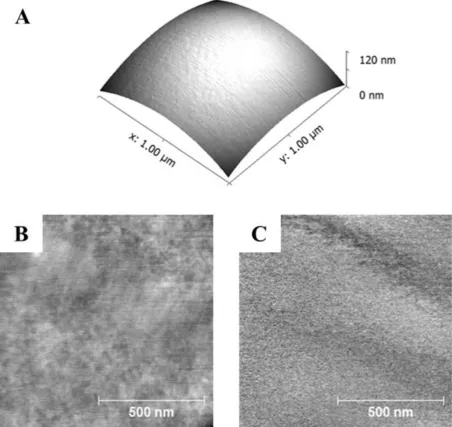
15 FIGURE 6 Peak Force QNM AFM analysis of a spray-dried 10/75/15 API/PLGA/PVP particle. (a). 3D representation of the AFM topographic data showing a region of the particle
displaying a smooth featureless surface, (b). 2D representation of the topographic data (following flattening of the data (vertical grey scale 4 nm)) and (c). a corresponding
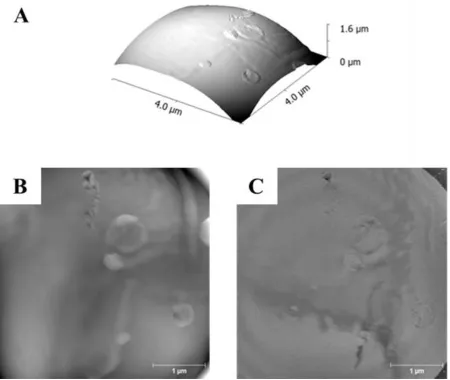
[image:15.595.71.524.76.503.2]16 FIGURE 7 Peak Force QNM AFM analysis of a spray-dried 20/50/30
API/PLGA/PVP particle. (a). 3D representation of the AFM topographic data showing a
region of the particle displaying clear heterogeneity including surface depressions, (b). 2D representation of the topographic data (following flattening of the data (vertical grey scale 30
17 FIGURE 8 Peak Force QNM AFM analysis of a spray-dried 30/25/45 API/PLGA/PVP particle. (a). 3D representation of the AFM topographic data showing a region of the particle
displaying a relatively smooth surface with some circular features, (b). 2D representation of the topographic data (following flattening of the data (vertical grey scale 300 nm)) and (c). a corresponding sample stiffness map (based upon DMT analysis, lighter being stiffer (arbitrary
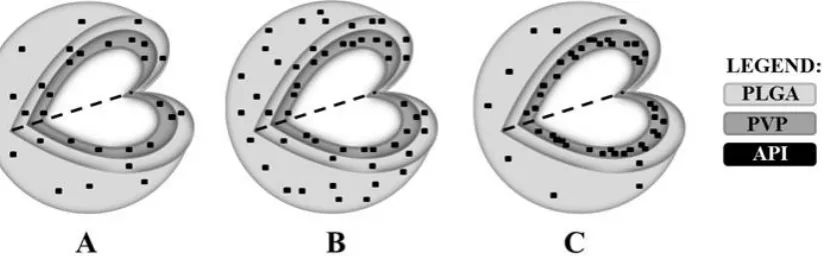
[image:17.595.72.523.77.457.2]18 FIGURE 9 Elucidated structures of the model formulations with following API/PLGA/PVP (w/w/w) ratios: (a). 10/75/15, (b). 20/50/30 and (c). 30/25/45.
DISCUSSION
MDSC was used to thermally study the phase behaviour of the three model formulations. For
each sample two mixing Tgs were observed, the first one approximating to the Tg of PLGA and the second one shifting towards the Tg of pure PVP (Fig. 3). In addition, the absence of a
Tg around 56°C (Tg of the API) indicates that the API is molecularly dispersed in a phase separated system made up of a PLGA-rich phase and a PVP-rich phase. Preceding work has already revealed that hollow spheres are formed when PLGA and PVP are spray-dried
together with a PLGA surface layer and an underlying PVP layer (8,9). The presence of PLGA at the particle surface is due to its surface activity and a consequence of restructuring
of the methyl side groups of PLGA towards the droplet-air surface (8,19). Moreover these two polymeric phases display a small degree of miscibility which is determined by the PLGA to
PVP ratio (8). The additional presence of an API will influence this phase behaviour.
Phase behaviour of the polymeric PLGA/PVP matrix was studied by estimating the polymer miscibility in these binary systems based upon the observed Tgs using the Gordon-Taylor equation for binary mixtures (equation 1) (7).
[image:18.595.80.492.71.206.2]19
In this equation, the weight fraction of each compound is represented by w, the glass transition temperature by Tg and the subscripts 1 and 2 represent the compounds with the lowest and the highest glass transition temperatures respectively. The constant K can be
assessed by using the Simha-Boyer rule (equation 2), with ρ being the density of the amorphous compounds.
K ≈ (ρ1Tg1) / (ρ2Tg2) (2)
Consequently the amount of PVP present in the PLGA layer and the amount of PLGA present
in the PVP layer could be calculated. The PVP content in the PLGA phase was thus estimated to be 15% and the PLGA content in the PVP phase 3% (9).
The complex phase behaviour of ternary, or even quaternary (when taking residual solvent into account), systems is however difficult, if not impossible to assess using this equation. An
extended form of the Gordon-Taylor equation for ternary mixtures has been developed (equation 3).
Tgmix = (w1Tg1 + K1w2Tg2 + K2w3Tg3) / (w1 + K1w2 + K2w3) (3)
With w representing the weight fraction of each compound,Tg the glass transition where the subscripts 1, 2 and 3 represent the compounds with the lowest, middle and the highest glass
20 This extended formula was originally used to account for residual (plasticizing) solvent (20–
22) and was expanded to the analysis of ternary solid dispersions (23). However, this extended form finds limited application due to the contradiction between the complexity of ternary mixtures and the assumptions made for this model equation. Generally the
Gordon-Taylor equation assumes additivity of the specific volumes of the compounds involved as well as a linear change in volume with temperature (6). Obviously the likelihood that those
assumptions apply decreases with increasing complexity of the system.
Illustratively equation 3 was applied to the observed Tg of the PLGA-rich phase of the 20/50/30 API/PLGA/PVP wt% sample (Tg= 42.45°C). Assuming ideal mixing of this ternary system, the calculated amount of API could vary between 0 and 10 wt% API in the
PLGA-rich phase. This variation in composition might be translated to differences in the release profile and physical stability of the formulation. The above indicates that (M)DSC alone does not allow the determination of the ternary composition of the two phases present and is not
sufficient to characterize these complex ternary system samples as it is unable to inform on the distribution of the API in the PLGA-rich surface layer and the underlying PVP-rich phase.
Owing to this limitation, for these systems MDSC must be applied in combination with surface analysis in order to determine the composition.
ToF-SIMS was utilised to chemically elucidate the surface composition of the microspheres of the different formulations. Chemical surface analysis by ToF-SIMS revealed that the
degree of API surface coverage of the solid dispersion clearly differed when formulation parameters were changed (Fig. 4-5). Additionally, an inconsistency was observed between the API bulk concentration and surface coverage. The sample with the highest total amount of
21 surface, in fact it displayed the lowest surface coverage. This discrepancy indicates that the
API distribution of the drug is influenced by formulation parameters. The observed susceptibility of these systems regarding API distribution induced by changes in formulation (and likely process) parameters indicates the need for in depth sample characterization,
combining miscibility, characterization of API surface coverage and spatial API distribution at higher resolution.
AFM imaging of the three samples showed identifiable differences between the appearance and organization of the formulations. In general, spray-dried particles of the 10/75/15
API/PLGA/PVP wt% formulation showed a smooth featureless topography with no evidence of sample heterogeneity. Corresponding surface stiffness maps also indicated a homogenous
material with no significant nanoscale variation in mechanical properties (Fig. 6). Similar observations were also made for the 30/25/45 API/PLGA/PVP wt% samples. Although particles did show some circular topographic features no significant variation in mechanical
properties was observed (Fig 8), again indicating a compositionally homogeneous surface. In contrast, the 20/50/30 API/PLGA/PVP wt% formulation showed some significant
heterogeneity in its surface topography and composition. There is clear evidence of pits in the surface of the order of hundreds of nanometers in diameter and 2-15 nm in depth. The stiffness map shows areas of reduced stiffness (darker contrast) in relation to the majority of
the surface, sometimes but not always associated with the pits (Fig. 7). Whilst AFM does not uniquely (chemically) identify components as in ToF-SIMS the observation of complexity at
22 underlying material that contains API and/or that surface heterogeneity (incomplete mixing of
components) in these samples is related to the higher API surface coverage.
The information regarding the phase behaviour of the polymers obtained by MDSC was
combined with the information ToF-SIMS provided on the spatial distribution of the API at the surface of the microspheres as well as on the ranking of the formulations based on API
surface coverage. AFM provided spatial information on the distribution of different compounds at the microsphere surface at nanoscale resolution. Taken together these techniques provide insights into differences in drug distribution (via the observed surface
coverage) for three differently composed ternary solid dispersions. A schematic illustration of the elucidated structures of the three model formulations is shown in Figure 9.
The observed differences between the formulations studied can be explained by the fact that a change in formulation parameters (here a change in the ratio API/PLGA/PVP and thus
composition of the feed solution) can influence particle formation during spray drying. A differently composed feed solution can result in different feed viscosity, evaporation rate or
solidification point of the compounds. These parameters might affect the distribution of the API in the formed microspheres and therefore the degree of API surface coverage. This is illustrated by the Peclet number (Pe) which is used to predict compound distribution of the
API during the particle formation process (equation 4).
Pei=κ / 8Di (4)
In this equation the evaporation rate is represented by ĸ and Di stands for the diffusion
23 influence API distribution. Evaporation rate can be influenced by a varying feed composition
as the affinity between solvent-polymer and solvent-drug molecules influences the evaporation rate. The extent of this influence will depend on the amount of polymer or drug molecules (with affinity for the solvent) present in solution (24). The potential influence of
feed viscosity on API distribution and (surface coverage) is illustrated by the Stokes-Einstein equation which pinpoints the different parameters that influence the diffusion coefficient of a
compound (equation 5).
D = kBT / 6πηr (5)
In this equation D is the diffusion coefficient, r the globular radius, T the absolute temperature and η the viscosity of the solution. kB is the Boltzmann constant.
The higher the concentration of a compound in the feed solution, the closer it will be to its solubility limit and the faster it will reach the solidification point during the particle formation process. This possible difference of solute deposition time might also influence the spatial
distribution of the API (25).
The lack of substantial differences in microspheres size and morphology (Fig. 2) when comparing the three model formulations indicates that differences in formulation parameters did not influence particle size and morphology.
In addition to influencing the particle formation process, changing the ratio of the three
24 CONCLUSIONS
This study demonstrated how a combination of (M)DSC and the surface analysing techniques ToF-SIMS and AFM offer synergistic benefits for the characterisation of the phase behaviour
and drug distribution of ternary solid dispersions (API/PLGA/PVP).
MDSC showed that the investigated formulations consisted of two mixed phases, a PLGA-rich phase and a PVP-PLGA-rich phase, in which the API is present as a glass solution. ToF-SIMS informed on the spatial composition of the ternary solid dispersions: the PLGA-rich phase
covers the surface of the microspheres, the PVP-rich phase is situated underneath. The degree of API surface coverage varies for the different formulations but is not in agreement with the
bulk API concentration. AFM imaging and mechanical mapping coupled nanoscale spatial information about the microsphere surface to these findings, indicating structural and compositional heterogeneity in the 20 wt% API samples (compared to 10 wt% and 30 wt%
API samples), which was consistent with their higher than expected surface coverage of API.
Interestingly, the distribution of the API in the ternary solid dispersions depended on formulation parameters. The extent of API surface coverage and therefore the distribution of the API over both polymeric phases differed significantly for the three formulations. As the
location of the API in the microspheres might significantly influence the performance of the formulation (release behaviour and physical stability) insight into how formulation and
25 ACKNOWLEDGMENTS
Dr. Matthew Piggott (ISAC, Nottingham, United Kingdom) is acknowledged for coordinating the AFM experiments.
REFERENCES
1. Janssens S, Van den Mooter G. Review: physical chemistry of solid dispersions. J Pharm Pharmacol. 2009;61(12):1571–86.
2. Van den Mooter G. The use of amorphous solid dispersions: A formulation strategy to overcome poor solubility and dissolution rate. Drug Discov Today Technol. 2012;9(2):e71–e174.
3. Leuner C, Dressman J. Improving drug solubility for oral delivery using solid dispersions. Eur J Pharm Biopharm. 2000;50(1):47–60.
4. Vasconcelos T, Sarmento B, Costa P. Solid dispersions as strategy to improve oral bioavailability of poor water soluble drugs. Drug Discov Today. 2007;12(23-24):1068– 75.
5. Vo CL-N, Park C, Lee B-J. Current trends and future perspectives of solid dispersions containing poorly water-soluble drugs. Eur J Pharm Biopharm. 2013;85(3 Pt B):799– 813.
6. Kalogeras IM. A novel approach for analyzing glass-transition temperature vs. composition patterns: application to pharmaceutical compound+polymer systems. Eur J Pharm Sci. 2011;42(5):470–83.
7. Gordon M, Taylor JS. Ideal copolymers and the second-order transitions of synthetic rubbers. i. non-crystalline copolymers. J Appl Chem. 1952;2(9):493–500.
8. Meeus J, Chen X, Scurr DJ, Ciarnelli V, Amssoms K, Roberts CJ, et al. Nanoscale surface characterization and miscibility study of a spray-dried injectable polymeric matrix consisting of poly(lactic-co-glycolic acid) and polyvinylpyrrolidone. J Pharm Sci. 2012;101(9):3473–85.
26 10. Rafati A, Boussahel A, Shakesheff KM, Shard AG, Roberts CJ, Chen X, et al. Chemical and spatial analysis of protein loaded PLGA microspheres for drug delivery applications. J Control Release. 2012;162(2):321–9.
11. Scoutaris N, Hook AL, Gellert PR, Roberts CJ, Alexander MR, Scurr DJ. ToF-SIMS analysis of chemical heterogenities in inkjet micro-array printed drug/polymer formulations. J Mater Sci Mater Med. 2012;23(2):385–91.
12. Kreye F, Hamm G, Karrout Y, Legouffe R, Bonnel D, Siepmann F, et al. MALDI-TOF MS imaging of controlled release implants. J Control Release. 2012;161(1):98–108.
13. Weuts I, Van Dycke F, Voorspoels J, De Cort S, Stokbroekx S, Leemans R, et al. Physicochemical properties of the amorphous drug, cast films, and spray dried powders to predict formulation probability of success for solid dispersions: etravirine. J Pharm Sci. 2011;100(1):260–74.
14. Lauer ME, Siam M, Tardio J, Page S, Kindt JH, Grassmann O. Rapid assessment of homogeneity and stability of amorphous solid dispersions by atomic force microscopy--from bench to batch. Pharm Res. 2013;30(8):2010–22.
15. Lauer ME, Grassmann O, Siam M, Tardio J, Jacob L, Page S, et al. Atomic force microscopy-based screening of drug-excipient miscibility and stability of solid dispersions. Pharm Res. 2011;28(3):572–84.
16. Qi S, Moffat JG, Yang Z. Early stage phase separation in pharmaceutical solid dispersion thin films under high humidity: improved spatial understanding using probe-based thermal and spectroscopic nanocharacterization methods. Mol Pharm. 2013;10(3):918–30.
17. Alsteens D, Dupres V, Yunus S, Latgé J-P, Heinisch JJ, Dufrêne YF. High-resolution imaging of chemical and biological sites on living cells using peak force tapping atomic force microscopy. Langmuir. 2012;28(49):16738–44.
18. Adamcik J, Berquand A, Mezzenga R. Single-step direct measurement of amyloid fibrils stiffness by peak force quantitative nanomechanical atomic force microscopy. Appl Phys Lett. AIP Publishing; 2011;98(19):193701.
19. Paragkumar N T, Edith D, Six J-L. Surface characteristics of PLA and PLGA films. Appl Surf Sci. 2006;253(5):2758–64.
20. Van den Mooter G, Wuyts M, Blaton N, Busson R, Grobet P, Augustijns P, et al. Physical stabilisation of amorphous ketoconazole in solid dispersions with polyvinylpyrrolidone K25. Eur J Pharm Sci. 2001;12(3):261–9.
27 22. Tobyn M, Brown J, Dennis AB, Fakes M, Gao Q, Gamble J, et al. Amorphous
drug-PVP dispersions: application of theoretical, thermal and spectroscopic analytical techniques to the study of a molecule with intermolecular bonds in both the crystalline and pure amorphous state. J Pharm Sci. 2009;98(9):3456–68.
23. Janssens S, Nagels S, Armas HN de, D’Autry W, Van Schepdael A, Van den Mooter G. Formulation and characterization of ternary solid dispersions made up of Itraconazole and two excipients, TPGS 1000 and PVPVA 64, that were selected based on a supersaturation screening study. Eur J Pharm Biopharm. 2008;69(1):158–66.
24. Wan F, Bohr A, Maltesen MJ, Bjerregaard S, Foged C, Rantanen J, et al. Critical solvent properties affecting the particle formation process and characteristics of celecoxib-loaded plga microparticles via spray-drying. Pharm Res. 2013;30(4):1065– 76.