• We describe the output of a collaborative modelling project to develop tools to estimate the potential effects of wave and tidal stream marine renewable energy (MRE) developments on the marine environment.
• Realistic generic tidal stream and wave MRE devices that could be used by scientists without access to the technical details available to developers are described.
• Results show largely localised sea bed effects at the level of the currently proposed MRE developments in our study area.
• Large scale three-dimensional modelling is critical to understand and quantify the direct, indirect and cumulative effects of MRE extraction.
Large scale three-dimensional modelling for wave and tidal energy resource and environmental impact: methodologies for quantifying acceptable thresholds for sustainable exploitation
A. Gallego1*, J. Side2, S. Baston2, S. Waldman2, M. Bell2, M. James3, I. Davies1, R. O’Hara Murray1, M. Heath4, A. Sabatino4, D. McKee4, C. McCaig4, H. Karunarathna5, I. Fairley5, A. Chatzirodou5, V. Venugopal6, R. Nemalidinne6, T. Z. Yung6, A. Vögler7, R. MacIver7 and M. Burrows7
1 Marine Scotland Science 2 Heriot-Watt University
3 Marine Alliance for Science and Technology for Scotland 4 University of Strathclyde
5 University of Swansea 6 University of Edinburgh
7 University of the Highlands and Islands
1
1 Introduction
1 2
1.1 Background
3 4
In the context of increasing societal concerns about the effect of traditional energy sources
5
based on the combustion of fossil fuels on the earth’s climate, Marine Renewable Energy
6
(MRE) is a relatively new sector showing considerable promise, particularly in highly
7
populated areas of northern Europe where other (e.g. some terrestrial) renewable energy
8
sources have either fulfilled their potential or are likely to encounter significant challenges
9
as a result of lack of free/available resource, environmental or socio-economic impact, etc.
10 11
The MRE sector comprises a number of different technologies (see Magagna and Uihlein,
12
2015). In order of degree of readiness, these include offshore wind, tidal energy, wave
13
energy and a few emerging technologies such as salinity gradient and thermal energy
14
conversion. The latter have been piloted already (in some cases, for quite some time) but
15
their current technology readiness level (see review by Magagna and Uihlein, 2015) suggests
16
that they are still some way off becoming commercially viable.
17 18
Offshore wind is the most mature offshore MRE sub-sector, building upon the widespread
19
deployment of onshore wind farms. By 2015, offshore wind had reached a generating
20
capacity of >5 GW in United Kingdom waters. Across Europe, the total adds up to >10 GW
21
and some 700 MW in the rest of the world (source: Offshore Wind Factsheet 2015;
22
http://www.renewableuk.com/en/publications/index.cfm/offshore-wind-factsheet). The
23
potential effects of offshore wind farms on the physical environment are relatively
straight-24
forward to measure and model. The main effects on the physical environment relate to the
25
effect of energy extraction on the wind field, which reduces e.g. the amount of energy
26
available to mix the water column, and the physical effect of the turbine support structures
27
on the flow and wave fields. Their main direct biological effect during the operational phase
28
is their potential interaction with birds, although other effects have been proposed (e.g.
29
support structures can serve as artificial reefs for native or invasive species). Some
30
construction methods produce levels of underwater noise that can be of concern regarding
31
marine mammals and, potentially, fish.
32 33
The tidal MRE sector includes a number of different technologies that exploit tides to
34
generate electricity. They include tidal stream devices, where turbines placed within the
35
tidal stream exploit the kinetic energy of the tidal flow to generate electricity, and dam-like
36
structures with turbines, such tidal lagoons and barrages (closed dams) or turbines in open
37
dams perpendicular to the tidal flow. Most Tidal Energy Converters (TECs), e.g. for tidal
38
stream developments, are typically horizontal axis bladed turbines (although other designs
39
exist) and therefore share some similarities with wind turbines. However, TECs are yet to
40
reach the required level of technical maturity for routine large scale commercial
41
deployment, although they show promise, particularly in areas where the resource is most
42
abundant, such as parts of the coastal waters west and north of Scotland (The Scottish
43
Government, 2013).
44 45
Wave energy converters (WECs), in contrast to TECs, are diverse in design, although they all
46
share the same source of energy to generate power: the combined wind seas and
2
swells as they approach coastal areas, where their potential for exploitation is currently
48
concentrated (for economic reasons). The lack of convergence towards a preferred design
49
has been identified as an obstacle to the commercial development of the waves sub-sector
50
and poses some practical challenges when it comes to investigate its potential
51
environmental impact.
52 53 54
1.2 Study area
55 56
The main geographic focus of this work is the Pentland Firth and Orkney Waters (PFOW)
57
area (Fig. 1), comprising waters around the Orkney Islands off the north Scottish coast and
58
the 10-12 km wide channel (the Pentland Firth) that separates this archipelago from the
59
Scottish mainland. The Pentland Firth is significantly deeper than the bays and channels
60
among the islands, which are generally less than 25 m and rarely exceed 40 m. Depths in
61
the main Pentland Firth channel typically reach 60-80 m and even >90m on the western
62
side. The Inner Sound, south of the Island of Stroma in the Pentland Firth, is somewhat
63
shallower (ca. 35 m). The M2 tide that propagates clockwise around the British Isles results 64
in an approximately 2 h phase difference between the west and east ends of the Pentland
65
Firth and sets up a hydraulic gradient that generates strong tidal currents which can reach 5
66
m s-1. Tidal currents are also forced around headlands and through other channels within 67
the Orkney Islands, where spring flows can exceed 3.5 m s-1. The amount of extractable 68
tidal stream power in the area has been the subject of a number of studies with
wide-69
ranging estimates. For the Pentland Firth, the higher limit has been estimated as 4.2 GW
70
averaged over the spring-neap cycle (Draper et al., 2014) but more recent work reports a
71
more realistic scenario of around 1.5 GW (O’Hara Murray and Gallego, submitted).
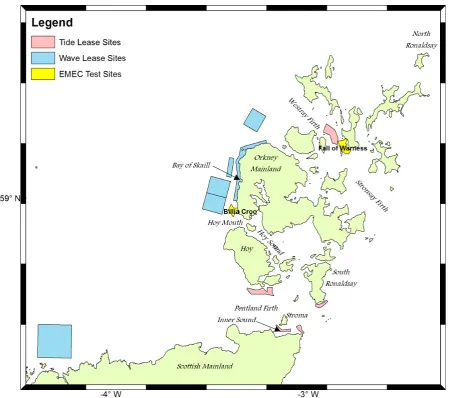
3 74
Figure 1: Map showing the Pentland Firth and Orkney Waters area and the location of the
75
wave and tidal stream MRE development sites considered in the project.
76 77
The wave regime in PFOW is dominated by Atlantic swells and the influence of low pressure
78
systems that travel primarily from west to east across the North Atlantic. Therefore, wave
79
conditions are most severe in the exposed coastal areas to the west. The seasonal range of
80
average wave resource in the area has been estimated between <10 (summer) and 50 kW
81
(winter, top range of the estimate) (Neill et al., 2014).
82 83
The PFOW area is rich in geological features, coastal landscapes and seascapes that
84
collectively support diverse habitats and species, many of which are considered rare and/or
85
vulnerable. There are four designated Special Areas of Conservation (SAC; European Union
86
designation) in Orkney and three SACs on the adjacent north coast of the Scottish mainland,
87
for the protection of marine and coastal habitats. Another 29 sites (some with marine
88
elements) have been designed as Sites of Special Scientific Interest (SSSI; national
89
designation) and three nature conservation Marine Protected Areas (MPA) were formally
90
designated in the area in 2014 (Pilot Pentland Firth and Orkney Waters Working Group,
91
2016).
4
The marine environment also has great social and economic importance for the Orkney
94
Islands and adjacent areas of the north of Scotland. Fishing is a long-established industry in the 95
area, targeting a wide range of pelagic (herring, mackerel), demersal (including cod, haddock, 96
whiting, saithe, monkfish) and shellfish (including prawn, Nephrops, lobster, brown and velvet crab, 97
whelk and scallop) species. The Scottish Sea Fisheries Statistics 2015 (The Scottish Government, 98
2016) indicates that there were 132 Scottish based active fishing vessels in the Orkney area and a 99
further 93 in the adjacent north Scottish mainland area of Scrabster (all vessel sizes). The combined 100
value of landings in 2015 by Scottish based vessels in the area was in excess of £39M. Fishing is an
101
integral part of coastal and island communities as a source of employment and as an
102
important link to maintaining associated services, thus contributing to community
103
sustainability. The PFOW area is utilised by a variety of other vessels with various cargoes,
104
passenger ferries and recreation. Aquaculture is also relatively important, although
105
aquaculture sites have so far been located largely in sheltered waters of no primary interest
106
for MRE exploitation. The marine and coastal area in the PFOW supports a wide range of
107
activities associated with recreation, sport, leisure and tourism that make a significant
108
contribution to the local economy and the sustainability of remote communities. Many of
109
these activities are based on the wildlife, the scenery or are water-based, and rely on a
110
clean, safe and diverse marine environment. Key interactions are expected to take place
111
between the MRE sector and the fishing industry, shipping and navigation and the natural
112
environment, and to be key elements of environmental impact assessments and the
113
licensing/consenting process. There may be interactions with other sectors but these are
114
anticipated to be minor.
115 116
1.3 Legislative framework
117 118
The Scottish Government has set a target of a largely decarbonised electricity generation
119
sector by 2030, with a renewable electricity target of 100% of the Scottish consumption
120
equivalent by 2020. MRE developments in Scottish waters are subject to licensing
121
conditions. Part Four of the Marine (Scotland) Act 2010 gives Scottish Ministers
122
responsibility for licensing activities within inshore Scottish waters (up to 12 nm), as well as
123
for offshore waters (12-200 nm) under the Marine and Coastal Access Act 2009 for
non-124
reserved activities such as MRE developments. Developers in Scotland need to apply for
125
licences or consents under a number of regulations which include the Electricity Act (S36)
126
1989, the Coast Protection Act 1949 and the Food and Environment Protection Act 1985.
127
The licensing landscape in Scotland has been simplified recently to provide a largely
one-128
stop-shop that allows simultaneous application for the relevant consents. In addition to a
129
marine licence, a project will require approvals or consents from other authorities such as
130
The Crown Estate, a landed estate under The Crown Estate Act 1961, which leases the
131
seabed within the UK 12 nm limit and the rights to non-fossil-fuel natural resources on the
132
UK continental shelf.
133 134
Although the specific details will vary between countries, most applicable national
135
environmental legislation in Europe is directly transposed from European Union legislation
136
and it is often similar to other international legislation, commonly based on international
137
conventions, so the information we present here will be of wider applicability beyond the
138
Scottish context. The primary instrument for monitoring and managing the quality of
139
Scotland’s coastal waters out to 3 nm from the coast is based on the European Union (EU)
140
Water Framework Directive (WFD; EC (2000)). The PFOW area is largely classified as ‘good’
5
status under the WFD. The waters on the eastern portion of the Pentland Firth are of ‘high’
142
status, as well as several “transitional waters” in the PFOW area (Pilot Pentland Firth and
143
Orkney Waters Working Group (2016)).
144 145
The Marine Strategy Framework Directive (MSFD; EC (2008)) is the piece of European
146
legislation which establishes a common framework and objectives for the prevention,
147
protection and conservation of the marine environment against damaging human activities
148
beyond the spatial domain of the WFD. EU countries must assess the environmental status
149
of their marine waters and set environmental targets, develop monitoring networks,
150
prepare programmes of measures and set specific objectives towards reaching a “Good
151
Environmental Status (GES)” by 2020. The MSFD sets out, in its Annex I, eleven qualitative
152
Descriptors of GES. The main Descriptors that may be directly impacted by MRE
153
developments are D6 (“The sea floor integrity ensures functioning of the ecosystem”), D11
154
(“Introduction of energy (including underwater noise) does not adversely affect the
155
ecosystem”) and, in particular, D7 (“Permanent alteration of hydrographical conditions does
156
not adversely affect the ecosystem”). Hydrographical conditions play a critical role in the
157
dynamics of marine ecosystems, particularly in coastal areas, and can be altered by human
158
activities. One of the main pressures on D7 explicitly identified refers to MRE installations
159
( http://ec.europa.eu/environment/marine/good-environmental-status/descriptor-160
7/index_en.htm).
161 162
In practice, experience has shown that the dominant pieces of environmental legislation
163
influencing licensing/consenting of MRE developments are Council Directive 92/43/EEC (the
164
“Habitats Directive”, (EC, 1992)) and Directive 2009/147/EC (the “Birds Directive” (EC,
165
2009)). The Habitats Directive aims to promote the maintenance of biodiversity, protecting
166
a wide range of rare, threatened or endemic animal and plant species and some 200 rare
167
and characteristic habitat types, taking account of economic, social, cultural and regional
168
requirements. The Birds Directive aims to protect all of the 500 wild bird species naturally
169
occurring in the European Union and, through national legislation, it establishes a network
170
of Special Protection Areas (SPAs) that include all the most suitable territories for these
171
species. In Scotland, there are a number of coastal SPAs protecting the breeding sites of,
172
particularly, migratory seabirds species that visit Scotland during the breeding season. In
173
parallel, Special Areas of Conservation (SACs) are established under the Habitats Directive to
174
protect habitats and species of conservation value. In marine systems, these include
175
distinctive habitats such as sandbanks, sea caves and cliffs etc., and key species such as
176
bottlenose dolphin and seal species. SPAs and SACs are included in the Natura 2000
177
ecological network set up under the Habitats Directive.
178 179
The potential impact of wave or tidal stream Marine Energy Converters (MECs) has been
180
discussed in the scientific literature. Pelc and Fujita (2002) considered wave devices to be
181
relatively environmentally benign and tidal stream turbines to be the most environmentally
182
friendly tidal power option. A review of the ecological impact of MRE (Gill, 2005) showed
183
that, despite a growth in publications on renewable energy, only a fraction at the time (<1%;
184
none on coastal ecology) considered its potential environmental risks. Theoretical risks of
185
the extensive subsurface structures introduced by MRE into the coastal environment
186
outlined by Gill (2005) identified changes to water circulation and to the transport and
187
deposition of sediment, noise and vibration during the construction and operational phases,
6
changes to the electrical and electromagnetic fields, and degradation and/or removal of
189
habitats. Gill (2005) also warned against an undue focus on rare species of high intrinsic
190
appeal to the detriment of impacts on the ecosystem structure, processes and key
191
functional species. The effects of near- and far-field changes to the flow and wave fields,
192
and sedimentation patterns have been identified by subsequent publications (e.g. Shields et 193
al., 2011) including specifically in the Pentland Firth area (Shields et al., 2009). These effects
194
are not just negative: a number of potentially beneficial effects has also been proposed
195
(Inger et al., 2009), such as the creation of artificial reefs, de-facto marine protected areas
196
and fish aggregation devices. Interactions between positive and negative effects, as well as
197
cumulative effects (Inger et al., 2009) requiring a different scale of management actions
198
(Boehlert and Gill, 2010). Shields et al. (2011) identified the PFOW area as a particular case
199
study to provide essential industry standards and environmental guidelines of worldwide
200
applicability. However, because of the relative lack of empirical data on how marine
201
habitats and wildlife will interact with wave and tidal stream MECs and their distinct nature
202
relative to other forms of marine developments, understanding their potential
203
environmental impact is particularly challenging and important. Smaller-scale demonstrator
204
devices have been studied in depth but there is a clear need to monitor carefully the
205
quantitative and qualitative nature of the effects of early commercial-scale developments
206
against the natural baseline. Environmental impact assessment procedures are covered by
207
European legislation such as Directives 2011/92/EU (the “Environmental Impact
208
Assessment, EIA” Directive) and 2001/42/EC (the “Strategic Environmental Assessment,
209
SEA” Directive) and their relevant national transposition (in Scotland, the Environmental
210
Assessment (Scotland) Act 2005), to ensure that the potential environmental implications
211
are taken into account before plans and projects are formally adopted and
212
licences/consents are granted. Where a project has the potential to have a significant effect
213
on a Natura site, a Habitats Regulation Appraisal (HRA) is required under the Habitats
214
Directive. This process progresses from qualitative assessment to a more detailed
215
Appropriate Assessment (AA). Projects can only be consented if the AA concludes that the
216
development will not affect the integrity of the relevant protected (Natura 2000) sites.
217 218
This paper summarises the output of a collaborative modelling project (the TeraWatt
219
project; Side et al. (this issue)). In the absence of comprehensive observational data,
220
modelling projects like the present one are fundamental to estimate the potential effects of
221
MRE developments on the physical environment and, consequently, on the marine
222
ecosystem.This paper draws on the project outputs and presents potential methodologies
223
for quantifying acceptable thresholds for sustainable MRE exploitation within the context of
224
the existing planning, regulatory and environmental legislative framework. In the following
225
sections, we describe the modelling methodologies to represent the hydrodynamics and the
226
implementation of energy extraction, and their effect on the physical environment, followed
227
by a description of the regulatory framework in Scotland and a discussion on the
228
acceptability criteria for sustainable exploitation.
229 230 231
2 Modelling methodologies: hydrodynamics and energy extraction
232 233
2.1 Data
7
In order to develop three dimensional hydrodynamic and spectral wave models, a number
236
of datasets was required for model initialisation, forcing, calibration and validation. In
237
addition, seabed sediment data were needed for sediment transport modelling. A
238
comprehensive description of the data used in the project is presented by O’Hara Murray
239
and Gallego (this issue) and O’Hara Murray (2015) so only a summary will be presented
240
here.
241 242
Bathymetry data are needed at the appropriate resolution for the model grids (typically
243
below 100 m). The bathymetric dataset used in the study (The Crown Estate, 2012) was
244
derived from a variety of high resolution sources interpolated to a regular 20 m horizontal
245
grid. Much of the underlying data were UK Hydrographic Office (UKHO) survey data, with
246
gaps filled from the Digital Elevation Model (DEM) (Astrium OceanWise, 2011).
247 248
Bed sediment distribution data, including particle size and particle size distribution data,
249
were obtained from the British Geological Survey (BGS) Web Map Services
250
(http://www.bgs.ac.uk/GeoIndex/offshore.htm). At specific sediment dynamics modelling
251
sites, such as the Bay of Skaill, targeted survey work was carried out within the project, such
252
as beach profiles (Fairley et al., this issue) or site-specific datasets were identified (Inner
253
Sound: MeyGen (2012) and Marine Scotland Science multibeam echosounder data
ground-254
truthed by video trawls).
255 256
The main sets of data on currents used in the project consisted of 3 moored ADCP 30-day
257
deployments in the Pentland Firth collected by Gardline Marine Sciences for the Maritime
258
and Coastguard Agency (MCA) and 4 vessel-mounted ADCP (VMADCP) transects along its
259
boundaries, as well as moored ADCP data purchased from the European Marine Energy
260
Centre (EMEC) at their Fall of Warness site, a short moored ADCP deployment in Stronsay
261
Firth, and two VMADCP surveys across the Hoy Mouth and Hoy Sound (see Fig. 2 in O’Hara
262
Murray and Gallego (this issue) for the location of these surveys).
263 264
Waves data were obtained from WaveNet, the Cefas-operated Datawell Directional
265
Waverider buoy network (https://www.cefas.co.uk/cefas-data-hub/wavenet), as well as
266
Waverider data purchased from EMEC’s Billia Croo site and data from a Waverider buoy
267
deployed off Bragar (west coast of the Isle of Lewis, Scotland; Vögler and Venugopal (2012)).
268 269
Tidal boundary forcing used the output of the barotropic Oregon State University Tidal
270
Prediction Software (OTPS; Egbert et al., 2010) and the DHI Global Tidal Model Database
271
(Cheng and Andersen, 2010). Wind forcing data for waves modelling were obtained from
272
the European Centre for Medium Range Weather Forecast (ECMWF) ERA-40 re-analysis
273
dataset.
274 275 276
2.2 Numerical models – flow
277 278
Following consultation with MRE project developers, it was clear that the industry places
279
considerably greater confidence in what are perceived to be tried-and-tested commercial
280
models in preference to others generally employed by the academic community in research
281
contexts. The project team was advised that, in order to engage fully with the renewables
8
industry, we would need to use models they would trust and be familiar with. Therefore,
283
MIKE3 (Danish Hydraulic Institute, DHI) and Delft3D-Flow (Deltares) were selected for tidal
284
modelling, and MIKE21 SW (DHI) for waves modelling.
285 286
MIKE3 is a free-surface hydrostatic model that uses a cell-centred finite volume method to
287
solve the three-dimensional incompressible Reynolds-averaged Navier-Stokes equations,
288
with the Boussinesq approximation and a k-ε turbulence closure scheme in the vertical and
289
the Smagorinsky horizontal eddy viscosity formulation. In the vertical, we used sigma
290
coordinates and, in the horizontal, triangular elements allowing for an unstructured grid
291
that provides enhanced flexibility to represent complex geometries (e.g. coastline and
292
bathymetric features) in areas where more detail is required, with greater computational
293
efficiency. A description of the MIKE3 implementation in our study area is given by
294
Waldman et al. (this issue) but, briefly, a model domain was set up covering the whole of
295
the Orkney Islands, the Pentland Firth and adjacent waters off the north and northeastern
296
Scottish mainland, with a horizontal resolution that varied between 4000 and 50-200 m (in
297
high tidal velocity areas) and 10 equidistant vertical sigma layers. The flow model was
298
calibrated against the 3 moored ADCP current profile datasets referred to above.
299 300
Delft3D-Flow is a finite difference hydrostatic model that solves the three-dimensional
301
incompressible Reynolds-averaged Navier-Stokes equations, with the Boussinesq
302
assumptions. We chose a sigma vertical coordinate system and the model’s rectangular
303
(structured) staggered Arakawa-C grid in the horizontal. To achieve the degree of horizontal
304
resolution required in the focus area while covering a wide enough domain to minimise
305
boundary effects, within computational constraints, two grids of different resolution were
306
bi-directionally coupled: a coarser resolution (1 x 1 km) grid in 2-dimensions covering an
307
area slightly larger than the full MIKE3 domain and a higher resolution (200 x 200 m),
3-308
dimensional (10 sigma layers), grid covering the Pentland Firth and the Orkney Islands (see
309
Waldman et al., this issue). The turbulence closure scheme selected was the same as for the
310
MIKE3 model (k-ε). The outer domain model was calibrated against water level data and
311
the inner domain model against the Fall of Warness ADCP dataset, using the 3 moored
312
Pentland Firth ADCP datasets for validation.
313 314
The two flow models predicted very similar relative changes in all parameters of interest
315
over their spatial domain. Depth-averaged current speeds showed very similar absolute
316
values but both models had been calibrated against this variable. This was achieved by
317
using different values for bed resistance (Waldman et al., this issue). Bed resistance is often
318
used as a tuning parameter and is therefore not necessarily representative of the actual
319
seabed resistance. It also influences the modelled vertical velocity profiles and,
320
consequently, parameters of relevance to sediment transport and ecological processes such
321
as bottom velocity and near-bed stress. However, in our study, relative changes (spatially
322
and as a result of energy extraction) in these variables are more important than absolute
323
values (Waldman et al., this issue), so the relative similarities between the two flow models
324
are reassuring.
325 326 327
2.3 Numerical models – waves
9
We used MIKE21 SW for wave modelling. This is an unstructured grid, finite volume,
330
spectral wave model that simulates the growth, decay and transformation of
wind-331
generated waves and swell. The model offers two alternative formulations: fully spectral or
332
a directional decoupled parametric formulation. The fully spectral version incorporates
333
wave growth due to wind effects, non-linear wave-wave interactions, dissipation due to
334
bottom friction, white-capping and wave breaking, effect of time-varying depth and
335
bathymetric effects on wave refraction and shoaling, and wave-current interactions. The
336
model domain used in this project spanned the whole of the North Atlantic (Venugopal and
337
Nemalidinne, 2015). The model resolution was coarser in the open North Atlantic (element
338
area approx. 2.5 km2) and finer in the Pentland Firth and Orkney waters, and in the Hebrides 339
and northwest Scotland (approx. 1700 m2). The detailed model setup is described in 340
Venugopal and Nemalidinne (2015) and Venugopal et al. (this issue). The model was
341
calibrated for significant wave height, peak wave period and peak wave direction against
342
four Waverider data locations from the WaveNet network and the Isle of Lewis Waverider
343
dataset, and successfully validated against three 2010 datasets, as described by Venugopal
344
et al. (this issue).
345 346
2.4 Simulating tidal stream MECs
347 348
One of the objectives of the project was to characterise sufficiently realistic generic devices
349
for tidal stream and wave MECs that could be used by scientists without access to the
350
technical details of such devices available to MRE developers. The characteristics of these
351
devices were developed from information in the public domain, including that provided in
352
licence applications, and was substantiated by consultation with developers. The most
353
common design at present for tidal steam converters is a horizontal axis turbine and this
354
was the device we aimed to represent in the models. Single 1.0-1.5 MW capacity rated tidal
355
turbines were characterised by monopiles with a single 20 m diameter rotor, cut-in/cut-out
356
speeds of 1 and 4 m s-1, respectively, 2.5 m s-1 rated speed and current speed-dependent 357
thrust coefficient (Baston et al., 2015). The types of wave energy devices likely to be
358
deployed in PFOW were more variable than tidal stream devices and so three broad device
359
types were used, representing those currently under consideration by developers; (i) a 750
360
kW wave attenuator, a floating device oriented in parallel to the direction of wave
361
propagation, which captures energy from the relative motion between two sections of the
362
device as the wave passes; (ii) a 2.5 MW wave point absorber, a fully- or
partially-363
submerged device that captures energy from the heave motion of the waves; and (iii) a 1
364
MW oscillating wave surge converter or terminator, where a buoyant hinged flap attached
365
to the seabed moves backwards and forwards, pushing hydraulic pistons to drive a turbine.
366 367
With the exception of experimental demonstrator devices, commercial-scale MRE
368
developments will consist of arrays of individual devices. The sites with agreement for
369
lease for MRE developments were used as initial general target areas for the location of
370
arrays of devices. Their precise exact positioning within these areas will be based on a
371
number of factors: 1) the availability of the resource; 2) potential interference between
372
devices; 3) water depth; and 4) seabed suitability, in terms of substrate and/or relief. Most
373
of these constraints will influence the location of all types of devices (tidal stream and
374
waves) and designs, although their relative importance will differ.
10
Based on licence application documentation, two types of tidal stream turbines were
377
considered: i) a 1 MW single axis turbine with a 20 m diameter rotor; and ii) a 2 MW device
378
with two horizontal axis turbines with 20 m diameter rotors and a hub-to-hub spacing of 30
379
m. Their layout within an array assumed a constant across- and downstream spacing,
380
aligned to the main direction of the flow and with staggered (offset) rows which takes
381
advantage of the expected flow acceleration around individual devices (e.g. see Rao et al.,
382
2016). Individual devices were also located within each general area on the basis of a)
383
number of devices as a function of the licensed total capacity of each development; b) main
384
current direction; c) distribution of the tidal resource within the development area; and d)
385
water depth (≥ 27.5 m below mean sea level, to ensure that the turbine blades would be
386
constantly submerged). O’Hara Murray and Gallego (this issue) provide greater detail of the
387
array design process and present the final layout of the hypothetical arrays in the licensed
388
sites used in the energy extraction simulations.
389 390 391
2.5 Simulating wave MECs
392 393
In the case of WEC arrays, there were fewer constraints on where many of the types of
394
devices could be placed so the general principle was to space out individual devices to
395
occupy the whole of the licensed areas, giving consideration to the necessary operational
396
depths for each device type. Four out of six wave development project sites within the
397
PFOW stated that they intended to use the wave attenuator device. The number and
398
spacing of attenuators in staggered rows was based on information provided by developers
399
in their licence applications, the intended electricity generating capacity of each site and any
400
spatial constraints. The one development planning to use point absorber devices required a
401
550 m (cross-stream) and 600 m (downstream) staggered design over the full development
402
site, while the oscillating wave surge converters planned for one development were spaced
403
by 45 m (71 m centre-to-centre, as they are 26 m wide), which is within the spacing window
404
reported in the licensing documentation. The appropriate number to achieve the intended
405
energy generating capacity was spaced out along the 12.5 m depth contour, which is within
406
their operational target depth range of 10-15 m. See O’Hara Murray and Gallego (this issue)
407
for full details.
408 409
Tidal stream arrays were implemented in the MIKE3 model of the study area (Waldman et 410
al., this issue) using the “Turbine” facility within the software, parameterising the device as
411
a sub-grid scale process using an actuator disk model with a user-defined thrust coefficient
412
(Baston et al., 2015). Turbine parameters and locations, as defined above, were input into
413
the model while supporting structures (2.5 m diameter cylindrical monopiles between the
414
seabed and hub height) were also represented using the built-in “Pier” facility. There was
415
no equivalent facility to model turbines in Delft3D and we were advised against customising
416
the standard software, e.g. to parameterise the devices as momentum sinks, so tidal stream
417
turbines were parameterised within the standard code as porous plates. Waldman et al. 418
(this issue) detail how this was implemented in the model and the limitations of the
419
approach in terms of e.g. vertical positioning, constant thrust coefficient and fixed
420
orientation.
11
WECs were implemented in the MIKE21 SW model for only 3 of the proposed development
423
sites, two with wave attenuators and one with an oscillating wave surge converter. The
424
model has no built-in facility to simulate WECs and so the arrays were represented by
sub-425
grid scale parameterisation (Venugopal et al., this issue). In a separate numerical modelling
426
exercise, the WAMIT model (www.wamit.com) was run to provide values of wave energy
427
transmission factors (energy absorption, reflection and transmission characteristics) which
428
were input into MIKE21 SW. WEC arrays were represented as a line structure where energy
429
transmission is characterised by the energy balance equation. MIKE21 SW can then be used
430
to model wave propagation over the model domain, incorporating the effect of wave energy
431
extraction. Some of the simplifying assumptions made in this approach require further work
432
to fully estimate the sensitivity of the results to the frequency-dependent behaviour and
433
dynamic response characteristics of the absorption, transmission and reflection coefficients.
434 435 436
3 Modelling methodologies: physical environmental effects
437 438
3.1 Tidal stream modelling
439 440
Both MIKE3 and Deltf3D produced similar results on the effect of tidal stream arrays on
441
depth-averaged current speeds, showing decreased velocities in tidal streams in line with
442
the arrays and increased velocities to either side, as flow is partly diverted around the array
443
(Waldman et al., this issue). These effects were particularly evident in the Inner Sound
444
development, where the flow is constrained by coastline on both sides (Fig. 4 of O’Hara
445
Murray and Gallego, this issue) and the turbines occupy a high proportion of the total water
446
depth. The relative effects of tidal energy extraction on bed stress were similar between
447
the two models. The results showed decreases of bed stress of 45% and increases of up to
448
100% in some areas (Waldman et al., this issue). However, some spatial differences
449
between the models were observed. These are believed to be the effect of differences in
450
the computational grid, which result in small differences in the exact locations of simulated
451
eddies which may affect individual devices in slightly different ways (Waldman et al., this
452
issue).
453 454
At the time this work was carried out, MIKE3 provided a superior capability to represent the
455
type of tidal stream device under consideration, as the limitations of the approach
456
implemented in Delft3D resulted in a constant thrust coefficient, fixed orientation and
457
spatially variable vertical position of the devices (Waldman et al., this issue). An error in the
458
calculation of turbine thrust in a high resolution model, of the type identified by Kramer et 459
al. (2014), was noted and a correction implemented (Waldman et al., 2015). A similar
460
correction has been incorporated into the latest version of MIKE.
461 462
The observed spatial differences in model results demonstrate the importance of validating
463
model output with field data in order to achieve the level of detail required for the precise
464
positioning of individual devices in any given area. Our results also underline the
465
importance of developing means of characterising bed resistance (empirically or
466
theoretically) instead of using it as a tuning parameter. Used as such, the use of the models
467
to obtain absolute values for variables of relevance to sediment transport and benthic
468
ecological processes such as bottom velocity and near-bed stress is limited. It is also critical
12
to obtain good quality velocity data (relatively rare in these operationally difficult areas
470
outside a commercially sensitive context) for model validation outside the calibration
471
areas/periods, in order to test the predictive power of these models. The quadratic
472
relationship between velocity and bed stress implies that increases in velocity have greater
473
effects on bed stress than decreases in velocity and, consequently, in some circumstances
474
the greatest environmental impact may not be caused by TECs slowing down the flow but
475
the increased velocities resulting from flow deflection (Waldman et al., this issue).
476 477 478
3.2 Waves modelling
479 480
The extraction of wave energy by WEC arrays resulted in a clear reduction in incident wave
481
height behind the arrays, with the greatest effect clearly in the area immediately behind. At
482
the point of maximum impact (immediately behind the array, close to the coastline), a large
483
decrease relative to average conditions was observed: approximately 1 m difference from
484
annual mean baseline conditions (Venugopal et al., this issue). The effect is reduced with
485
increased distance as a result of diffracted wave energy penetrating into the lee of the array
486
from the sides. For the proposed array off the Bay of Skaill, the results of Venugopal et al.,
487
(this issue) suggested that reduced wave height and (relatively less affected) wave period
488
and direction may result in relatively minor changes to sediments and coastal morphology
489
(beach erosion). An important finding of these simulations was the potential cumulative
490
effect of multiple developments. This is dependent on array layout and number of
491
developments (Venugopal et al., this issue) and needs to be studied both in the near- and
492
far-field. In the present work we generally constrained the spatial domain of our models to
493
investigate potential effects in our focal area (PFOW). Far-field effects can be significant in
494
some scenarios (e.g. van der Molen et al., 2015) and are being currently investigated by
495
project partners in a follow-up project.
496 497
3.3 Seabed sediment modelling
498 499
Fairley et al. (this issue) simulated the effect of MRE extraction on sediment processes
500
(bedload sediment transport and morphological change) in two case study areas within the
501
area of interest: the largest beach on the west coast of Mainland Orkney (the Bay of Skaill)
502
and the Inner Sound of the Pentland Firth. The Bay of Skaill is close to proposed wave
503
developments (Brough Head, West Orkney and Marwick Head). The Brough Head
504
development site includes the Bay of Skaill within the area but the indicative device layout
505
available to us shows the nearest WEC devices > 1 km from the bay. There is a proposed
506
development in the Inner Sound which, being constrained by Stroma and the Scottish
507
Mainland and using the criteria applied by O’Hara Murray and Gallego (this issue), would
508
occupy a significant proportion of the channel.
509 510
The Bay of Skaill is an important recreational asset and protects the Skara Brae Neolithic
511
village, which is part of a UNESCO World Heritage Site. Modelling for this site was carried
512
out using MIKE3, fully coupled with a spectral wave model and the non-cohesive sediment
513
transport module of the modelling suite (Fairley et al., this issue) and validated against the
514
only field data available on the site (5 beach profile transects), in the absence of concurrent
515
waves and current profile data. Differences between the baseline scenario and that with
13
wave energy extraction were observed, in the context of relatively lower confidence in the
517
modelling output, due to the lack of calibration data and the unavoidable use of default
518
model parameters as a result. These differences were greatest (approx. 0.5 m) on the
519
southernmost transects and are of the magnitude of the changes measured in the field.
520
These results need further investigation, particularly given the location of the Skara Brae
521
archaeological site on the south end of the bay. Other valuable lessons derived from the
522
exercise include the need for a longer period of field measurements that capture a range of
523
conditions; the data used in this project were acquired over a low wave energy period when
524
most sediment transport would have been dominated by swash zone transport (not
525
generally well represented in numerical models), plus it is not possible to evaluate the
526
model’s suitability under high energy conditions. Also, in practical terms, this work
527
highlighted the heavy computational requirements of the type of simulations needed to
528
adequately model seabed morphology beyond the short term. For consent applications,
529
where longer term predictions may be required, the accuracy of three-dimensional
530
modelling may need to be sacrificed in favour of computationally cheaper two-dimensional
531
models (Fairley et al., this issue).
532 533
To study the effect of tidal stream energy extraction on sediment dynamics in the Pentland
534
Firth, two commercial models were used. Delft3D with D-Morphology was used to study
535
the morphodynamic sediment environment in the Inner Sound and its results showed that
536
the currently observed sandbank dynamics are largely maintained by tidal flow asymmetries
537
in magnitude and direction (Fairley et al., this issue). MIKE3D was used to investigate the
538
effect of tidal stream energy extraction on the sandbanks in the wider Pentland Firth (see
539
Fig. 6 of Fairley et al., 2015). An anti-clockwise persistent eddy around the eastern
540
sandbank in the Inner Sound, with minimal transport over the crest, was shown in the
541
baseline simulations and explained the persistence of the feature. Energy extraction
542
resulted in the reduction of the eddy and the displacement of its centre, with a directional
543
flow over the crest of the bank. The magnitude of these changes was similar to the
544
simulated baseline temporal variability, suggesting that energy extraction in the Inner Sound
545
may affect the sediment dynamics in these subtidal banks (Fairley et al., this issue).
546
However, considerable uncertainty remains. For example, the predicted natural variability
547
in some other features such as a sandwave field to the west of Stroma is very high and,
548
intuitively, inconsistent with their perceived permanency. At present, it is not possible to
549
rule out model shortcomings, real sandwave variability or the combined effect of waves (not
550
modelled here) and tide. Therefore, Fairley et al., (this issue) concluded that, in some cases
551
such as the persistent eddy-influenced sandbanks, a relatively data-light modelling
552
approach, using default model settings, may be adequate to assess the impact of energy
553
extraction. In other areas of mobile sediments like the sandwave fields, additional field data
554
may be required to gain further confidence in the model results. Sediment transport
555
modelling is computationally complex and expensive, and the acquisition of suitable field
556
data is challenging and costly in these operationally and conceptually difficult environments.
557
Therefore, it may be more realistic and efficient to focus detailed efforts on areas where
558
high-risk receptors are present, using a more generic, pragmatic approach elsewhere, as
559
illustrated by our work.
560 561
3.4 Suspended particulate material modelling
14
Another example of a generic modelling approach to study the potential effects of wave and
564
tidal energy extraction was presented by Heath et al. (this issue). A one-dimensional model
565
was developed to investigate suspended particulate material (SPM) dynamics. SPM
566
characterises the light environment in the water column and is therefore critical for many
567
ecological processes, and it has been postulated that hydrodynamic changes to the marine
568
environment as a result of MRE extraction have the potential to affect SPM dynamics.
569
Numerical simulation modelling of SPM dynamics is a particularly challenging task, as
570
discussed by Heath et al. (this issue), but the parsimonious approach they developed was
571
sufficient to capture the observed natural temporal variability (seasonal, tidal, sub-tidal and
572
storm events), although high turbidity extremes were not fully replicated, probably due to
573
the nature of the forcing flow data (purely tidal, excluding wind and surge effects). The
574
extraction of wave and tidal energy of the magnitude expected of a large scale tidal or wave
575
array resulted in a reduction of water column turbidity within measurable detection
576
variability levels. With the caveat that this may need to be qualified by the likely non-linear
577
relationship between the energy extraction by MRE devices and wave or current variability,
578
Heath et al. (this issue) concluded that detectable levels of change in turbidity would require
579
some 50% attenuation of current speed, something unlikely beyond the immediate vicinity
580
of devices at current scales of development, where processes not represented in the model
581
are likely to dominate.
582 583 584
4 Regulatory framework and acceptability criteria for sustainable exploitation
585 586
As outlined in the Introduction, the regulatory framework for MRE developments we
587
describe in this paper will be of general applicability beyond the Scottish context due to its
588
foundation in European and other international legislation, although aspects may vary
589
through differences in details of the transposition of those regulations into national
590
legislation.
591 592
In Scottish waters, activities covered by the Marine (Scotland) Act 2010 with the potential to
593
have a significant effect on the environment, local communities and other users need to
594
undergo a pre-application consultation (Marine Scotland, 2015), to inform all potentially
595
interested parties. MRE developments with a total area exceeding 10,000 m2 fall within this 596
category. Not all licensable projects require an EIA as part of their application. Whether an
597
EIA must be undertaken for the provision of the Environmental Statement (ES) which
598
reports the findings of the EIA is dependent on whether the project features within Annex I
599
(mandatory EIA) or Annex II (EIA only necessary if the project exceeds certain limits or
600
thresholds) of the European Commission EIA Directive. MRE projects are likely to fall within
601
Annex II and the decision about EIA requirement will be made during the “EIA Screening”
602
stage (Marine Scotland, 2015). However, a statutory EIA is generally required. The next
603
stage in the process is termed “EIA Scoping” and involves preparing a preliminary analysis of
604
impact (Scoping Report) based on existing information, allowing the opportunity to identify
605
any issues that need further exploration or inclusion in the EIA. This occurs through formal
606
response to the Scoping Report from the consenting authority. These preliminary steps
607
define the structure and scope of the EIA and its reporting document, the ES. The EIA must
608
(BSI, 2015) i) describe the project; ii) outline the main alternative methods (e.g. pile
609
foundation types, construction methodologies, etc.) and the reasons for choosing any given
15
one; iii) describe in detail the environmental (physical, biological and human) baseline
611
regarding any aspects that could potentially be affected and the methodology used to
612
characterise it; and iv) present any mitigation measures that will be put in place to prevent,
613
reduce and offset adverse environmental effects, and how these will be monitored. Once
614
the impact pathways and receptor sensitivities have been established, receptor vulnerability
615
is evaluated. Both beneficial and adverse impacts are assessed on a scale of negligible to
616
major. Moderate or major adverse impacts require some form of impact reduction or
617
mitigation measure. EIA regulations specify that cumulative effects need to be accounted
618
for within an EIA. Guidance on the assessment of cumulative effects is available on EC
619
(2001).
620 621
If a proposed development has the potential to have a significant impact on a Natura site,
622
an HRA needs to be carried out. This is a consenting procedure that states that the
623
competent authority (normally the licensing/consenting authority) needs to carry out an
624
Appropriate Assessment (AA) of the plan or project. The AA needs to address whether the
625
integrity of the Natura site is likely to be adversely affected, considering closely the nature
626
conservation objectives of the site,based on, and supported by, evidence that is capable of
627
standing up to scientific scrutiny.
628 629
On a broader scale, under the MSFD, EU Member States are required to undertake an
630
initial assessment of the state of their seas (Article 8), determine a set of characteristics for
631
GES (Article 9), and establish relevant targets (Article 10), based on the 11 descriptors set
632
out in Annex I, the elements set out in Annex III (characteristics, pressures and impacts), and
633
a series of relevant Descriptors defined in the Commission Decision on criteria and
634
methodological standards for Good Environmental Status (EC, 2010). Regarding D7,
635
changes in the tidal regime, sediment transport, currents and wave action are explicitly
636
mentioned.
637 638
The reporting scale for MSFD does not apply to small scale, near-field effects (although
639
those may fall under other environmental legislation, as discussed above) but rather those
640
that may “affect marine ecosystems at a broader scale” (EC, 2010). Two D7 criteria are
641
defined: 7.1, spatial characterisation of permanent alterations; and 7.2, impact of
642
permanent hydrographical changes, with their respective indicators (7.1.1: Extent of area
643
affected by permanent alterations; 7.2.1: Spatial extent of habitats affected by the
644
permanent alteration; 7.2.2: Changes in habitats, in particular the functions provided, due
645
to altered hydrographical conditions). At the time of writing, no standard methodology has
646
been defined for assessment of GES for this Descriptor. Due to the nature of this descriptor
647
and its current state of development, D7 is not a quantitative descriptor at present and it is
648
not possible to define objective thresholds for its GES indicators.
649 650
A review of the Commission Decision for D7 (Stolk et al., 2015), recommended the use of
651
models to quantify the effects from permanent alterations to the hydrographic regime.
652
Modelling, applying a common methodology, should be used to reduce uncertainties in the
653
assessment of impacts. In order to understand the effect of D7-related impacts on other
654
descriptors such as D1 (“Biodiversity is maintained”) and D6 (“The sea floor integrity ensures
655
functioning of the ecosystem”), as well, additional research is needed on habitat modelling,
656
pressure mapping and cumulative impacts, along with monitoring of potentially affected
16
areas (Stolk et al., 2015). Models used within methodologies such as EIA, SEA, HRA and
658
marine spatial planning will contribute to evaluating and assessing the extent and the
659
cumulative aspects of impacts from MRE activities. The quantitative assessment of indirect,
660
combined and cumulative effects would still benefit from the development of suitable
661
quantitative methods and tools, which would be the next logical step from the work
662
presented here, although some advances have already been made (e.g. the TRaC-MImAS
663
tool assessing potential hydromorphological alterations in WFD “transitional and coastal
664
(TraC)”waters; UKTAG (2013). See Appendix A).
665 666
MRE developments also need to be compatible with their general planning context. In
667
Scotland, the marine planning framework is made up of the National Marine Plan (adopted
668
in March 2015 with the publication of the Strategic Environmental Assessment
Post-669
Adoption Statement), the ongoing roll-out of the Regional Marine Plans for the identified 11
670
Scottish Marine Regions and sectoral plans such as those prepared for offshore renewable
671
energy (wind, wave and tidal). Marine spatial planning, particularly at the broader
672
geographical level, makes uses of instruments such as The Crown Estate’s MaRS (Marine
673
Resource System), a GIS-based tool with hundreds of spatial datasets that allow spatial
674
analyses to identify areas of opportunity and potential constraint for development (e.g. by
675
MRE projects) by weighing combinations of technical constraints, sensitivities, competing
676
interests and other uses of the marine environment.
677 678
Current experience indicates that establishing compliance with the need to protect Natura
679
2000 sites is the key environmental element in determining whether licences/consent for
680
development should be granted. It is clear that changes to the hydrodynamic environment
681
from the current scale of development of MRE projects and those conceivable over the next
682
few years (such as the scenarios considered in the Terawatt project) should be measurable.
683
However, it is unlikely that they will be sufficient to cause projects to be rejected through
684
failure to meet WFD requirements (see Appendix A), or to lead to permanent hydrographic
685
changes of a magnitude that would cause failure to attain GES under Descriptor 7 of the
686
MSFD. It is much less clear whether we can be confident that this scale of development
687
does not have the potential to adversely affect the integrity of Natura 2000 sites. We have
688
demonstrated that changes in the tidal current speeds resulting from MRE developments
689
are sufficient to cause alterations to sediment dynamics in some locations. Impact
690
assessments, therefore, will need to take account of the potential for impacts on protected
691
sites that relay on sediment characteristics. These include sites such as designated
692
sandbanks, or sites designated for the protection of benthic species with particular
693
substrate requirements.
694 695
Similarly, our understanding of the feeding ecology of a range of protected species,
696
including marine mammals and seabirds, is indicating that species have particular preferred
697
feeding habitats, characterised by factors such as current speed, turbulence and primary
698
production rates (Waggitt et al., 2016a, 2016b), influenced by the presence/absence of
699
oceanographic fronts. There will be an increasing need to take account of the changes to
700
the physical environment in assessments of effects on foraging success and efficiency, and
701
consequences for reproductive success, mortality rates and the dynamics of protected
702
populations associated with Natura 2000 sites.
17
We can predict that there will be a continuing and intensifying need for specific quantitative
705
information on the individual and cumulative effects of MRE developments on the physical
706
and biological aspects of the marine environment. The EIA and, where appropriate, HRA
707
processes that underpin the planning and legislative framework will remain reliant on best
708
current science, together with qualitative judgement and expert opinion. We believe that
709
work such as that presented here makes a critical contribution to filling the existing gaps
710
and reducing the uncertainties in impact assessments.
711 712 713
5 Conclusions, further work and recommendations
714 715
This paper summarises the output of a collaborative modelling project to estimate the
716
potential effects of MRE developments on the marine environment.
717 718
At the basis of all modelling work lies the most appropriate and best quality data. Here,
719
various datasets for model initialisation, forcing, calibration and validation were compiled.
720
Most of these data will be freely available to developers, academia and regulators (O’Hara
721
Murray and Gallego, this issue) and will facilitate a common data framework for EIA
722
modelling.
723 724
Two commercially-developed numerical modelling suites were used primarily in this work,
725
following industry advice. The two flow models used produced a similar description of the
726
hydrodynamics of the study area and predicted very consistent relative changes to the
727
physical environment as a result of tidal energy extraction. However, bed resistance was
728
used as a tuning parameter for model calibration in both models and that influenced
729
velocity profiles and derived parameters of relevance to sediment dynamics and ecological
730
processes. Our results underline the importance of developing means of characterising bed
731
resistance adequately (empirically or theoretically) to circumvent this limitation. Our work
732
also highlighted the need for the appropriate facilities to characterise MRE devices within
733
the software suites, as technical approximations required in their absence can bring about
734
their own errors and inaccuracies. It could be argued that the most up to date
non-735
commercial models often favoured by the academic community may allow greater flexibility
736
and, eventually, provide more powerful and accurate modelling tools. However, open and
737
comprehensive cross-validation against commercial software will be required in order to
738
gain the confidence of industry and regulators.
739 740
The project succeeded in characterising sufficiently realistic generic devices for tidal stream
741
and wave MECs that could be used by scientists without access to the technical details
742
available to MRE developers. This was easier in the case of TECs than WECs, largely due to
743
the lack of design convergence of the latter, but also due to the technical limitations of the
744
modelling software used, which forced us to represent WEC arrays by sub-grid scale
745
parameterisation. We have high confidence in the way the tidal arrays were represented in
746
the models (in particular in MIKE3) and also the wave arrays but further work will be
747
desirable for the latter to fully estimate the sensitivity of the results to the
frequency-748
dependent behaviour and dynamic response characteristics implemented in the model.